Abstract
Background: The structure of modern golf balls is complex, with multiple layers, dimples, varying cover materials, and different compression ratings due to mantle composition and construction. Rigorous, statistical comparisons of commercially available golf balls, tested under a repeatable swing, are not commonly available. The results of this experiment are relevant since the USGA and R&A are instituting a golf ball rollback, meant to limit distance of all manufactured golf balls.
Methods: A single, experienced golfer hit eight commercial golf balls with a driver and a seven-iron. Each ball was compared with the control using Welch and Mann-Whitney tests with Holm and Benjamini-Hochberg correction, effect sizes, and analysis of variance. Tests were repeated on a well-struck subset of shots that was defined by an impact location near the center of the club face.
Results: With the seven-iron, no ball differed significantly from the control in either subset. With the driver, however, six of the seven experimental balls carried further than the control did, by 17 to 31 yd (all corrected p < 0.001). Only the two-layer Snell Prime 2.0 did not. The driver differences remained after repeated analysis of the well-struck subset.
Conclusions: The driver produced far more significant differences than the iron. Driver distances were associated with correlating metrics of spin and energy, not contact quality, as results persisted even when only well-struck shots were analyzed. Results are observational, yet support limited inferences about the effect of ball construction on performance, relevant to the rollback.
Keywords: golf ball construction, Trackman, launch monitor, distance, coefficient of restitution, spin, backspin
Introduction
Modern golf balls are specifically manufactured to engineer performance with how the ball launches, spins, and flies through the air. The structural features that manufacturers focus on are essential components of the ball, some prominent ones being dimple number, the number of layers, cover material, and compression. In a golf ball, dimple geometry governs the aerodynamic lift and drag when spinning; the number of layers determines how spin is separated, changing between full and short shots; the cover material, typically of urethane or ionomer that are tested in this study, primarily influences spin and durability; compression is what determines how the ball deforms at impact. Multiple previous research studies have detailed how these features act on a ball when it is struck at impact, and many specifically study the activity in flight1,2,3. However, comparisons of commercial golf balls for sale for all golfers rather than lab engineered balls are rarer. Even more unique is a rigorous study of these balls under a repeatable swing, filtered and analyzed statistically to highlight significant results.
Players and club fitters face many competing marketing claims from leading golf equipment providers, and have little direct evidence derived directly from commercial balls on which construction differences change performance on the golf course. Therefore, a side by side comparison of current balls under repeatable conditions, focused on general, variable differences in construction, would help golfers choose equipment, and inform observational inferences of the correlation between golf ball construction and overall performance in terms of distance, spin, and energy transfer. The fact that the USGA and R&A are introducing a golf ball rollback, beginning in 2028 for professional players and 2030 for recreational players, makes the results all the more valuable. As the rollback applies to golf balls, not golf clubs, the distinguishing factors in the golf ball that affect player performance bear directly on policy actions. This study measures eight different commercial balls under repeatable conditions and tests whether they perform differently, and why.
The objectives of the study are to (1) quantify how the eight balls differ from the control in distance, spin, smash factor, and estimated coefficient of restitution, providing insight into energy transfer and aerodynamic performance; (2) analyze those differences using normality testing, multiple-comparison correction, effect sizes, and confidence intervals; (3) test whether statistical differences are still apparent after only well-struck golf balls are accepted as valid data points; and (4) interpret results using established aerodynamics and impact physics, relating conclusions to possible implications in the golf ball rollback design.
Literature Review
The aerodynamics of golf balls have been studied and are well understood. Early work by Davies measured the lift and drag on spinning golf balls, and demonstrated the significant difference in behavior when a golf ball lacks dimples4. Using a wind-tunnel, Bearman and Harvey provided foundational measurements of drag and lift for dimpled balls, and they ended up showing that dimples trigger an early transition to turbulent boundary layer flow; this delays separation and in effect lowers drag5. Achenbach characterized the roughness effects on spheres, and showed that surface roughness also shifts the critical Reynolds number where drag will fall sharply2,6. The detailed mechanism where dimples reduce drag on a sphere was later identified by Choi et al. They linked dimple induced shear-layer instability to delayed separation7. Libii reinforced the idea that dimples reduce drag through a wind tunnel pendulum experiment across multiple different speeds3.
Within this literature, the geometry of the dimples themselves are found to have a special role as well. Tai et al found that interspersing small dimples between larger, existing ones increased lift8. Additionally, the scientists concluded that deep dimples favored lift over drag at low launch angles, and therefore may be beneficial for distance. Ting utilized computational fluid dynamics, which demonstrated that dimple size and depth do strongly influence aerodynamic forces9. Aoki et al visualized how dimples on a sphere alter flow pattern and the resulting flight of a sphere10. More recent experimentation has added to understanding by isolating certain variables: Alam et al measured drag differences across commercial golf balls, which they were able to attribute to dimple geometry11. Related work compared drag across the geometry of different sports balls and surface designs12. Chowdhury et al related dimple depth and coverage to drag by using custom made, 3D-printed golf ball models13. Additionally, Moriyama and Okanaga quantified how the surface occupancy of dimples, volume ratio, and depth affected the aerodynamic forces on a spinning sphere14. Similarly, Abbas et al found that the geometry and design of dimples measurably changes resulting drag patterns15. Across all these past findings, aerodynamic performance depended on dimple depth, geometry, diameter, coverage, and Reynolds-number dependent flow, not on dimple number alone. As a result, this study acknowledges that the dimple number is not an exclusive variable to determine aerodynamic activity. It is still useful to understand how commercial golf balls may behave practically under constant testing, and how their combined design features, including dimple pattern, translate into measurable performance differences for golfers.
Advances in computational fluid dynamics have also allowed detailed simulations of the flow around a golf ball. Smith et al quantitatively investigated the flow over a golf ball in the subcritical and supercritical regimes16. Li et al used large-eddy simulation (LES), studying the flow around a golf ball near the critical Reynolds number17, and they later extended this study to a rotating ball, comparing it to a rotating smooth sphere18. Crabill et al used high order simulations of a spinning golf ball to reproduce measured aerodynamic forces from first principles19. These studies have reinforced ideas regarding observed flow physics and how the boundary layer behaves and separates over dimpled, spinning surfaces.
Another direct line of research has examined backspin, specifically its effect on the Magnus force and its reversal. Aoki et al measured how rotation alters forces on the ball, as well as air flow patterns20. Muto and colleagues demonstrated that there is a negative Magnus effect approaching the critical Reynolds number, which highlighted that lift on a spinning ball is not always in the expected direction21. Kim et al explained the mechanics of this inverse Magnus effect, and why it occurs22, and Kray et al measured the Magnus effect on a rotating sphere at high Reynolds numbers23. The Magnus effect was specifically analyzed on dimpled spheres by Beratlis et al24. Relevant to this study, Lyu et al documented a reverse Magnus effect in commercial golf balls25, and Sakib and Smith observed the same effect on a golf ball and a smooth ball using particle image velocimetry26. Lyu and colleagues related the effect’s magnitude to the steepness of each golf ball’s drag crisis. Overall, the literature provides background on the behavior of golf balls with spin, and its interaction with the boundary layer, in relation to lift, drag, carry distance, and ultimately performance.
The activity at impact between the golf club and ball has been studied and is essential to understanding the mechanics of golf ball design. Arakawa et al measured the activity of a golf ball during impact, and showed how the core and cover deform and recover on a minuscule timescale, less than milliseconds27. They then extended this research to include oblique impacts, characterizing the tangential deformation and effect of friction between the golf ball and the target28,29. The coefficient of restitution, used in this study, helps to summarize the elasticity of impact, a measurement and interpretation Cross has reviewed in detail30. Similar to the model later used in this study, Cochran developed and discussed a one dimensional model of the golf ball at impact31. Caldwell and McPhee recently developed three-dimensional models of impact for both drivers and irons, and they were able to highlight how different the moment of collision can be between clubs32. Therefore, this study tests both the driver and a seven-iron, using smash factor directly measured by the trackman to evaluate the efficiency of energy transfer.
Overall ball construction links these studied aerodynamic and impact behaviors to convert to performance on the golf course. Essential components of the golf ball such as dimple number, cover material, compression, and layer count are engineered to work cohesively for certain players to balance spin, feel, and distance33. Quintavalla, Smits and Smith, and Ting have conducted modeling and computational studies that have reproduced trajectories from estimated coefficients based on spin and the Reynolds number, including lift and drag coefficients 1,34,35. These same essential performance characteristics are also the focus of current policy, as the R&A and USGA are instituting a rollback to limit driving distance. Specifically, they are revising conformance testing under the Overall Distance Standard36. Despite extensive literature, two gaps remain to be addressed. Most of the work characterizes fundamental physical ideas which govern the activity of the golf ball, using model spheres, specifically manufactured balls, wind tunnels, or simulations. These are highly specialized studies and do not give an idea of the entire picture of the performance of certain golf balls, and do not use equipment that is available to ordinary players. Second, current industry comparisons that test commercially available golf balls are rarely peer-reviewed with rigorous statistical testing to separate the performance of the golf ball from the golfer. This study utilizes a direct comparison of current commercial balls, tests structural differences under a repeatable swing, filters data for strike quality, and applies corrected statistics to produce clear, observational results useful to golfers, manufacturers, officials shaping the rollback, and those looking to conduct further research into the design of commercial golf balls.
Methods
Eight commercially available golf balls were selected and tested at an independent, Trackman simulator location. The Bridgestone Tour B XS is the control, and is relatively compared to the Mizuno RB Tour, Mizuno RB Max, Bridgestone Tour B RXS, Titleist Pro V1, TaylorMade TP5, Snell Prime 2.0, and PXG Xtreme Tour X. Each experimental ball was selected to differ primarily in one aspect from the Bridgestone Tour B XS while other specifications remained similar, yet there were small variations, so the results are observational and not strictly proven (see Discussion for implications of this study design and future experimentation options). The RB Tour was selected to have fewer dimples, while the Pro V1 had more dimples. The Prime 2.0 had fewer layers, and the TP5 had more layers. The RB Max had an ionomer cover rather than the typical urethane cover. The Bridgestone Tour B RXS had a low compression, while the Xtreme Tour X had a high compression. Full specifications are outlined in Table 1. This design produced an experiment where one feature primarily differed against a common baseline, not a completely controlled experiment, due to limited access to fully regulatory equipment.
| Ball | Dimples | Layers | Cover | Compression | Mass (g) | Primary difference |
| Bridgestone Tour B XS | 330 | 3 | Urethane | 84 | 45.80 | control |
| Mizuno RB Tour | 272 | 3 | Urethane | 90 | 45.62 | fewer dimples |
| Titleist Pro V1 | 388 | 3 | Urethane | 87 | 45.76 | more dimples |
| Snell Prime 2.0 | 332 | 2 | Urethane | 80 | 45.81 | fewer layers |
| TaylorMade TP5 | 322 | 5 | Urethane | 88 | 45.73 | more layers |
| Mizuno RB Max | 336 | 3 | Ionomer | 80 | 45.77 | cover material |
| Bridgestone Tour B RXS | 338 | 3 | Urethane | 65 | 45.56 | lower compression |
| PXG Xtreme Tour X | 338 | 3 | Urethane | 108 | 45.85 | higher compression |
One experienced golfer hit all recorded shots with the same driver and same seven-iron. Multiple sessions took place across different days, and results were all recorded on a Trackman launch monitor. The Trackman recorded club and ball speed, smash factor, launch angle, spin rate and axis, curve, carry and total distance, and the location of ball contact on the club face, among many other metrics. Using one golfer removes the bias that would occur from different golf swing mechanics, yet introduces possible day to day variation and fatigue effects from the repetition of striking golf balls. Since the driver produces more errant, variable results than a seven-iron, more driver shots were recorded per ball than iron shots.
With regards to the golf shots, two samples of recorded shots were statistically analyzed. The primary sample was analyzed only on a completeness rule. If the Trackman functioned correctly, and the shot maintained data on core metrics including club speed, ball speed, launch angle, spin, carry, and total distance, the shot functioned as a data point. This filter retained 327 of 331 seven-iron shots and all 740 driver shots. However, since human error was present while swinging the golf club, and a thin or off center shot can indicate a slow, inefficient golf ball, shots were also filtered on impact location. The second sample that was statistically analyzed contained only these well-struck shots, defined by impact location, or the point that the golf ball actually made contact with the club face. This was computed as Trackman provides horizontal and vertical impact offsets on the club face. It is a valid filtering method as impact location is independent of resulting distance, not biasing the comparison on results like a smash factor filter would (smash factor is ball speed divided by club speed). Shots that made contact with the club face outside of a fixed distance from the center were removed with an absolute cutoff. Impact must have been made within 16 mm of the club face center for the seven-iron and 25 mm of the club face center for the driver for a shot to be considered as a valid data point and included in statistical analysis. Overall, this filtering left 255 seven-iron shots. Due to Trackman inefficiencies, impact location was recorded for only two-thirds of driver shots, and applying the cutoff to those shots left 392 valid driver shots. Comparing this well-struck subset to the completeness pool of data helps to understand whether results depend on whether a ball was struck well, or if human error could have corrupted results.
For data, energy transfer was measured both by smash factor and the coefficient of restitution. Smash factor was reported directly by the Trackman monitor, yet the coefficient of restitution was also estimated for each shot in order to express energy transfer in terms of the elasticity of the club and ball collision, in a way that is comparable to published, widely known values. Through treating the clubhead of mass M and the ball of mass m as a simple, one dimensional collision, and applying the conservation of momentum formula for one dimensional collisions to derive the post-impact club speed, the formula is as follows: e = S(1 + m/M) – 1, where the variable S is the recorded smash factor. The clubhead mass was measured to be 205 g for the driver and 260 g for the seven-iron, and was found by weighing the entire club then subtracting known shaft and grip weights. Each ball mass, m, was measured using a tabletop balance, accurate to a hundredth of a gram. The one dimensional estimate is most appropriate and accurate for the driver, but is still recorded for the seven-iron for completeness. COR is reported on both golf ball samples, but has emphasis on the well-struck subset to ensure that golf balls are reflected properly. Limitations of the method used are given in the Discussion.
Core metrics of a golf shot, carry and total distance, were statistically tested for normality with each ball using the Shapiro-Wilk test. This test failed for multiple balls, and therefore motivated non-parametric confirmation. Each ball was tested against the control with Welch’s unequal-variance t-test and the Mann-Whitney U test. Since many comparisons were made, p-values had to be adjusted using both the Holm and Benjamini-Hochberg procedures. Overall, group wide differences were tested using a one-way ANOVA and the Kruskal-Wallis test, and Cohen’s d and 95% confidence intervals were reported throughout these tests. Each statistical test was run on both subsets of golf shots and data points.
Results
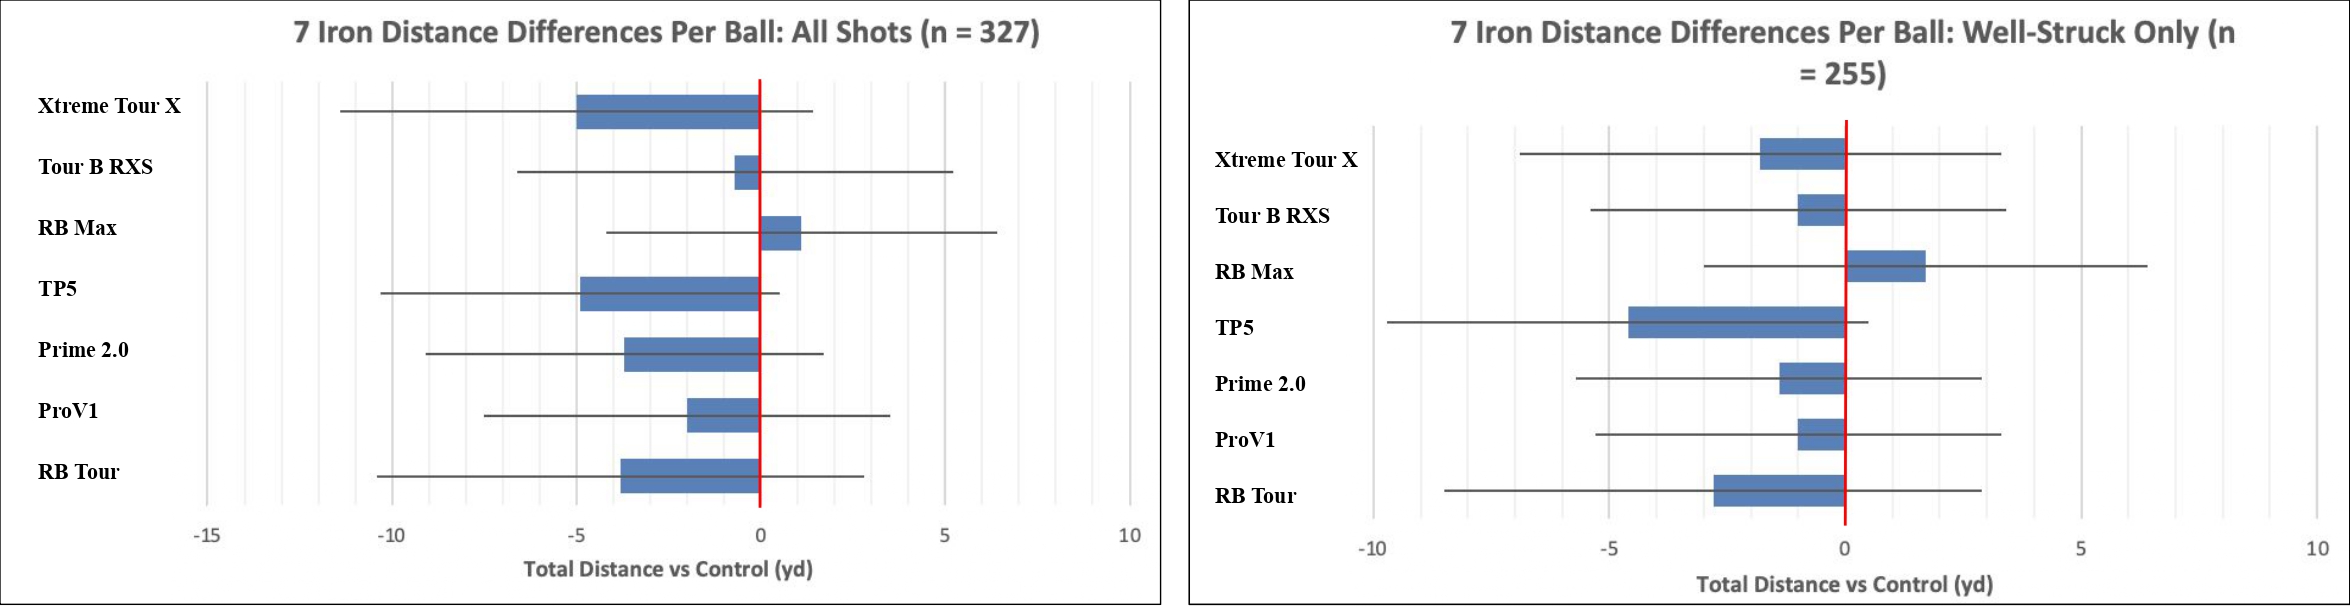
Using all 327 complete seven-iron shots, mean carry ranged from about 141 to 156 yards and total distance from 167 to 173 yards (Table 2). After corrections for the numerous comparisons, no ball significantly differed from the control in carry or total distance. Each calculated, Holm-adjusted p-value exceeded 0.55, all effect sizes were small (|d| < 0.5), and every confidence interval for the ball vs control difference included zero (Figure 1, left). The group wide tests correspond with these results, as the ANOVA p = 0.33 and the Kruskal-Wallis p = 0.35.
The results did not depend on strike quality (Table 3). On the well-struck subset, which included 255 shots, every distance difference remained non-significant, and any small apparent gaps in performance narrowed. For example, the PXG Xtreme Tour X moved from carrying about 5 yards shorter than the control to only two yards shorter (Figure 1, right). For the seven-iron, the eight balls, when struck well, were not statistically different in any distance metrics.
| Ball | Number of Shots | Carry (yd) | Total (yd) | Ball Speed (mph) | Spin (rpm) | Smash |
| Bridgestone Tour B XS | 40 | 149.6 | 171.7 | 108.9 | 4834 | 1.33 |
| Mizuno RB Tour | 29 | 144.8 | 167.9 | 106.1 | 4895 | 1.279 |
| Titleist Pro V1 | 31 | 150 | 169.7 | 108.8 | 5082 | 1.33 |
| Snell Prime 2.0 | 55 | 142.8 | 168 | 107 | 4817 | 1.272 |
| TaylorMade TP5 | 39 | 145.3 | 166.8 | 107.4 | 5156 | 1.301 |
| Mizuno RB Max | 37 | 156.3 | 172.8 | 111.3 | 5140 | 1.371 |
| Bridgestone Tour B RXS | 43 | 152.8 | 171 | 111.2 | 5223 | 1.364 |
| PXG Xtreme Tour X | 53 | 140.6 | 166.7 | 107.9 | 4876 | 1.284 |
| Ball | Number of Shots | Carry (yd) | Total (yd) | Ball Speed (mph) | Spin (rpm) | Smash |
| Bridgestone Tour B XS | 35 | 154.4 | 174 | 110.6 | 4931 | 1.349 |
| Mizuno RB Tour | 22 | 151.3 | 171.2 | 108.9 | 4916 | 1.313 |
| Titleist Pro V1 | 26 | 155 | 173 | 111 | 5091 | 1.355 |
| Snell Prime 2.0 | 43 | 152.9 | 172.6 | 110.4 | 5027 | 1.311 |
| TaylorMade TP5 | 29 | 149.1 | 169.4 | 109.3 | 5182 | 1.326 |
| Mizuno RB Max | 29 | 159.9 | 175.7 | 113 | 5123 | 1.392 |
| Bridgestone Tour B RXS | 37 | 156.2 | 173 | 111.8 | 5255 | 1.375 |
| PXG Xtreme Tour X | 34 | 150.6 | 172.2 | 110.3 | 4948 | 1.315 |
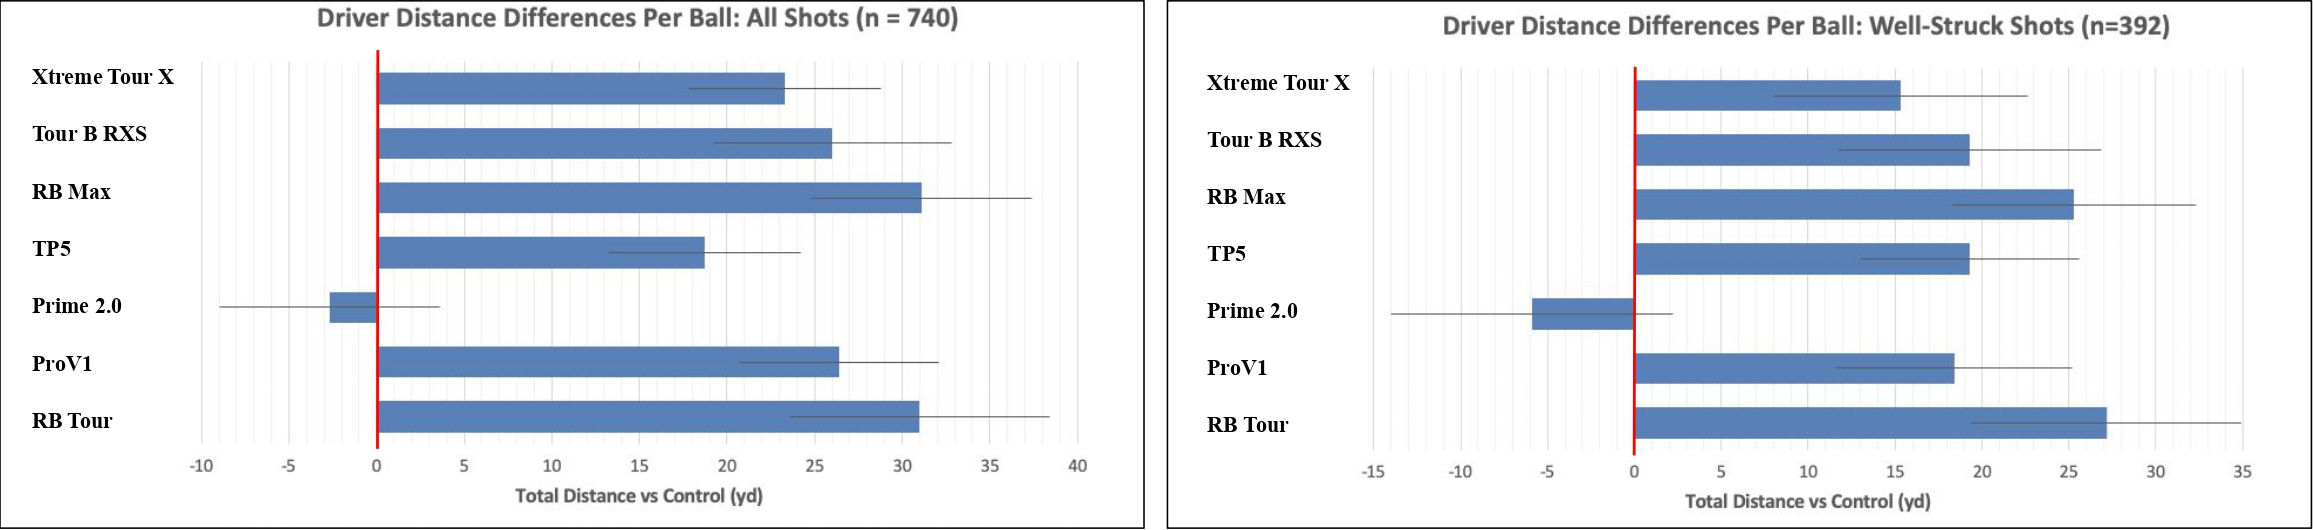
With the driver, there was much more variation and significance in results (Table 4). Total distance varied sharply among the balls across 740 shots (ANOVA p=3×10-40; Kruskal-Wallis p=1×10-37). When compared to the control, the Bridgestone Tour B XS, that had an average carry distance of 218.5 yd, six of the seven experimental balls flew significantly further after Holm correction (all p < 0.001). On average, the Mizuno RB Max flew 31.1 yd further, the RB Tour 31 yd further, the Pro V1 26.4 yd further, the Tour B RXS 26 yd further, the Xtreme Tour X 23.4 yd further, the TP5 18.8 yd further, with medium to large effect sizes (d ≈ 0.8 to 1.3). The only ball to not travel further than the control, being the exception, was the Snell Prime 2.0, as it matched the control, traveling 2.7 yd less far, which was not significant.
These major differences were not the result of better contact (Table 5). On the well-struck subset of 392 balls, the same six balls still outdrove the control (all Holm p values < 0.001) and the Prime 2.0 was still not significant. Since the difference persists even when only well-struck shots are compared, the differences can be attributed to the golf balls themselves, not the swing, which was repeated and consistent.
| Ball | Number of Shots | Carry (yd) | Total (yd) | Ball Speed (mph) | Spin (rpm) | Smash |
| Bridgestone Tour B XS | 134 | 203.1 | 218.5 | 134.9 | 4462 | 1.359 |
| Mizuno RB Tour | 41 | 219.7 | 249.5 | 141.2 | 3059 | 1.427 |
| Titleist Pro V1 | 63 | 221 | 244.9 | 141.6 | 3532 | 1.438 |
| Snell Prime 2.0 | 95 | 200.1 | 215.8 | 132.3 | 4348 | 1.345 |
| TaylorMade TP5 | 176 | 210.6 | 237.3 | 137.7 | 3622 | 1.411 |
| Mizuno RB Max | 67 | 220.2 | 249.6 | 140.8 | 3048 | 1.44 |
| Bridgestone Tour B RXS | 56 | 213.9 | 244.5 | 138.6 | 3122 | 1.424 |
| PXG Xtreme Tour X | 108 | 211.6 | 241.9 | 137.3 | 3173 | 1.422 |
| Ball | Number of Shots | Carry (yd) | Total (yd) | Ball Speed (mph) | Spin (rpm) | Smash |
| Bridgestone Tour B XS | 61 | 211.3 | 228.4 | 136.9 | 3997 | 1.379 |
| Mizuno RB Tour | 22 | 228.1 | 255.7 | 142.1 | 3032 | 1.443 |
| Titleist Pro V1 | 36 | 225.4 | 246.8 | 142.4 | 3550 | 1.448 |
| Snell Prime 2.0 | 42 | 205.1 | 222.5 | 133.2 | 3942 | 1.359 |
| TaylorMade TP5 | 92 | 218.3 | 247.7 | 139.2 | 3183 | 1.429 |
| Mizuno RB Max | 46 | 223 | 253.7 | 141.4 | 2903 | 1.452 |
| Bridgestone Tour B RXS | 35 | 217.6 | 247.8 | 139 | 3030 | 1.437 |
| PXG Xtreme Tour X | 58 | 212.4 | 243.8 | 138.2 | 3066 | 1.433 |
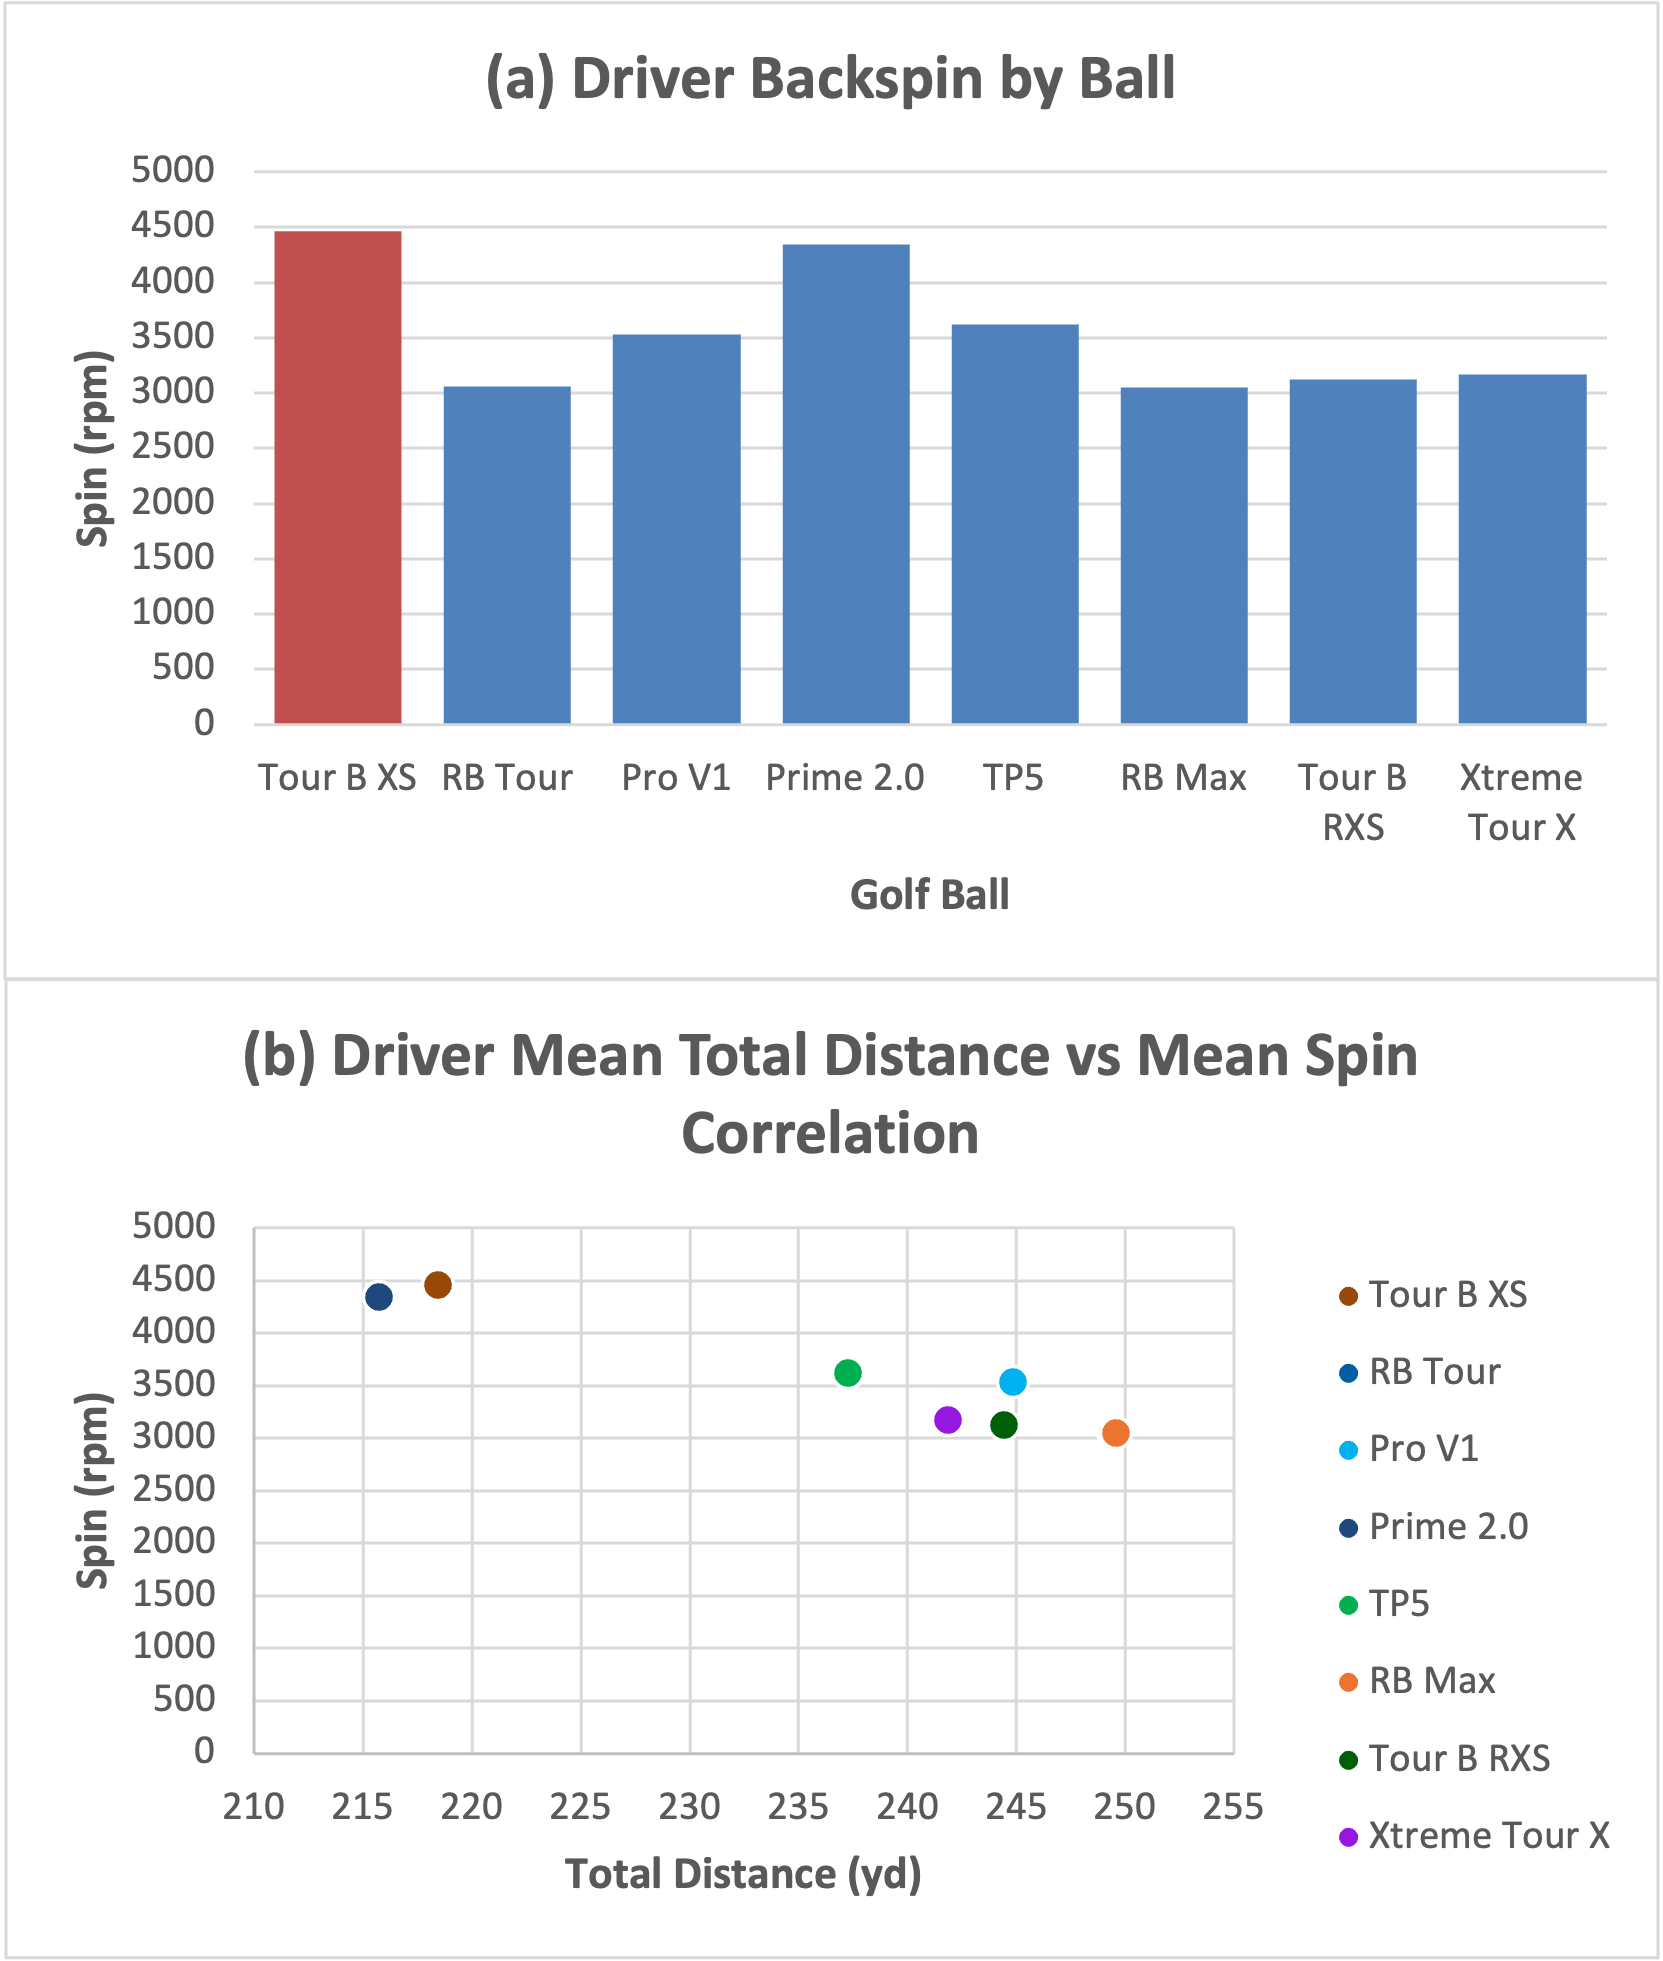
Two other measured quantities correspond to and help to explain the results of the driver shots, backspin and energy transfer metrics. Every ball except for the Prime 2.0 spun significantly less than the control, and this was by about 840 to 1,410 rpm (all Holm p < 0.001). Therefore, there was much more backspin on control and the Prime 2.0, having about 4,460 and 4,350 rpm (Figure 3). Additional driver spin increases lift-induced drag when it passes a certain optimum, which shortens carry. This spin difference was still seen on the well-struck subset.
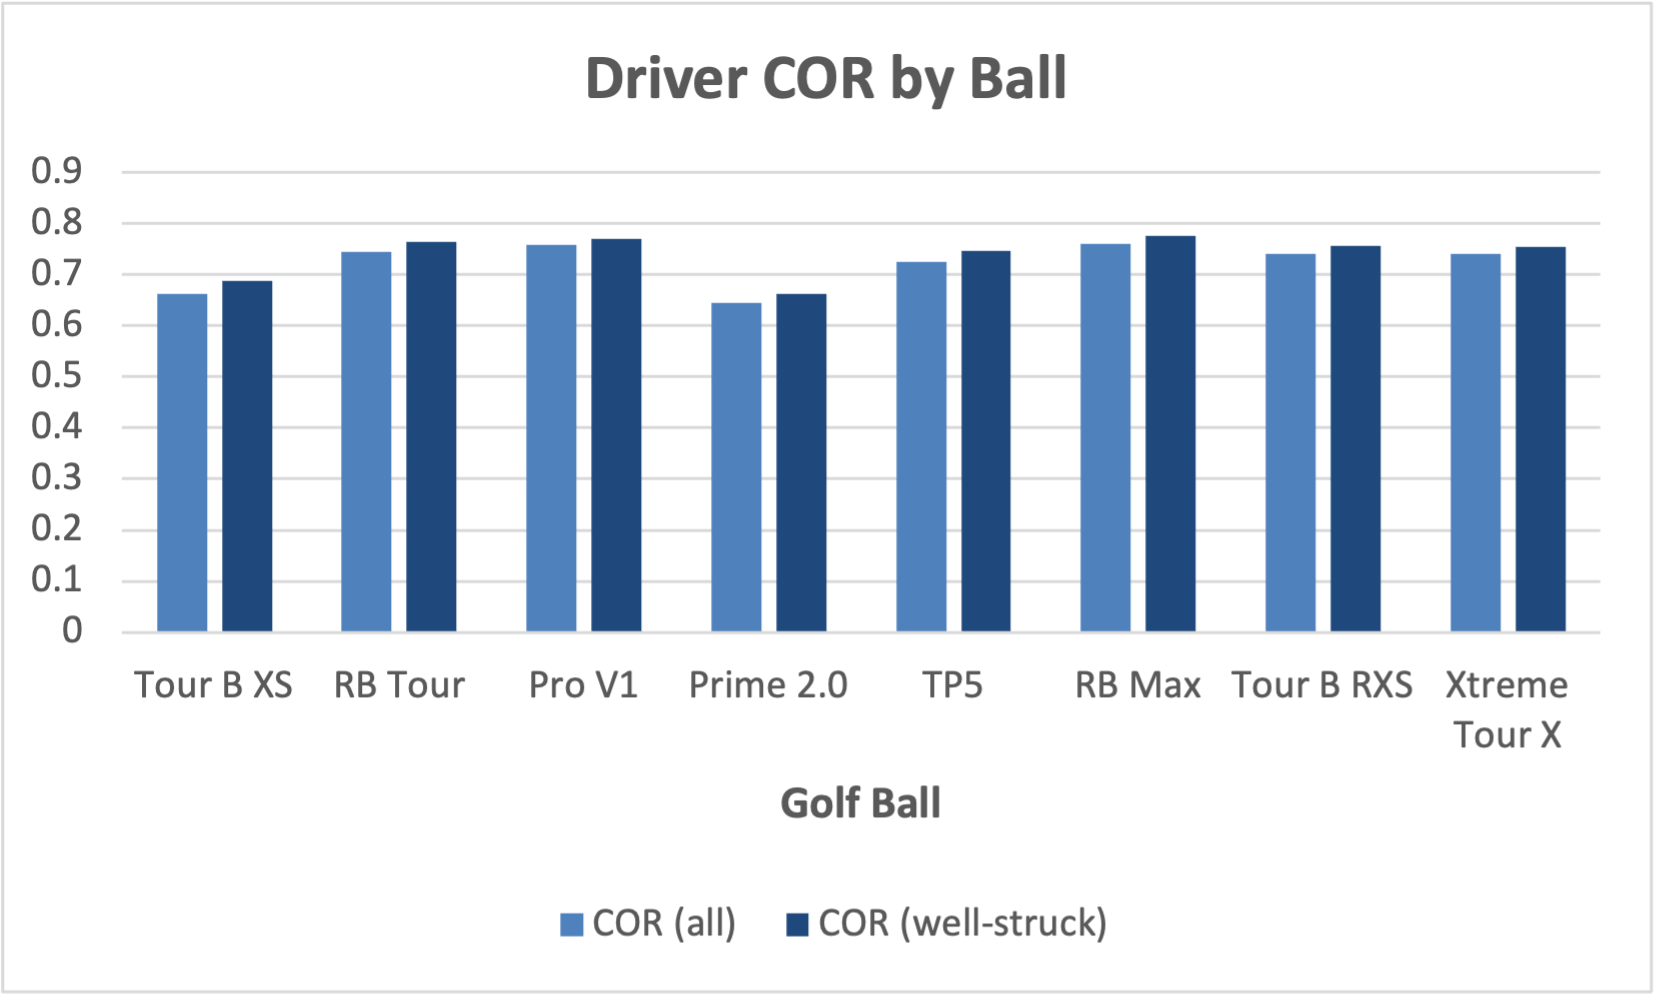
The energy transfer metrics of smash factor and estimated coefficient of restitution also help to explain the golf balls’ performance. The longer balls had a higher ball speed, higher smash factor, and higher estimated COR. When considering the completeness subset, the six longer balls had a significantly higher COR than the control (all Holm p values < 0.001), while the Prime 2.0 did not (Figure 4). On the well-struck data points, the calculated COR estimates rose. The Bridgestone Tour B XS had a value of 0.69, while the leader approached 0.78, a value that is close to the range reported for premium balls fired into a rigid plate, which is 0.78 to 0.81, or the 0.83 regulatory limit on spring like effect from the club face27,36. The seven-iron COR estimates were much lower, being in the range of 0.5 to 0.64, and showed no significant differences between balls. As discussed in the limitations later in the paper, a one-dimensional model does not properly describe a lofted iron strike with a negative attack angle, so the iron values are not considered accurate and are only reported for completeness in the study.
Discussion
Key Findings and Implications
From a broad perspective, each club produced vastly different results. With the seven-iron, the eight balls behaved nearly identically, and there was no significance between distance after statistical tests. However, the driver produced significant results, with six of seven balls outcarrying the control by 17 to 31 yd. The only ball to not travel significantly farther than the Bridgestone Tour B XS (control) was the Snell Prime 2.0. Driver distances, moreover, were large, survived correction, and survived the restriction to only considering well-struck shots. The differences in backspin and energy transfer only reinforced results, therefore highlighting that the differences in spin and energy transfer between balls were what caused significant results, not how the balls were struck.
These club-wide results have implications themselves. For a golfer or club fitter, the driver is where ball selection matters most. A ball that spins less is more efficient and gains more distance off of the tee. The overall findings also bear on rollback. Since the driver gaps are governed by spin and COR, largely influenced by golf ball construction, the balls already flying shorter off the tee may have constructions favorable for the rollback. The Snell Prime 2.0, and golf balls with a two layer construction, can be examined in a regulated environment for different behavior and physical activity at impact that may be conducive to achieving shorter distance in rollback balls. Beyond the results, the study demonstrates a method of filtering golf shots to be able to conduct scientific research, effectively separating the ball from the strike on a launch monitor using already recorded shot metrics.
Limitations
The golf balls were not perfectly matched in terms of construction metrics that were meant to be entirely controlled. Still, co-variation is limited, and each experimental ball had one construction variable that was vastly different, so comparisons function as reasonable inferences about which construction choices influence performance, not proofs. Moreover, all shots came from one golfer over multiple days of testing, with balls tested in a fixed order, introducing possible ambiguity between the quality of the golf swing across sessions. Finally, the main threat to the study was the disparity between golf swings, or human error. This was largely addressed through filtering all shots by completeness, then well-struck shots by impact location. Since significant differences in the driver distance and spin remained after filtering the data, it can be assumed that significant differences result due to construction differences in tested golf balls. The same filter left the statistically insignificant irons unchanged, supporting this conclusion.
Data was collected indoors on a launch monitor, without outdoor, wind, wedge, putting, or dispersion measurements. Impact location was only recorded for about two-thirds of the shots with the driver, meaning the well-struck subset had to be further derived from that portion. The equation for the COR estimate is derived from a one-dimensional momentum conservation model, not realistic for an iron swing with a negative attack angle, explaining the disparity in COR results for the driver and iron swings.
Ball-by-Ball Observations
The study is observational, and therefore cannot directly isolate a single design feature. However, individual balls behaved in ways consistent with measured spin and energy transfer metrics, and a few patterns stand out.
The Prime 2.0, the only two-layer ball tested, had the highest spin, travelled the shortest distance, and had the lowest estimated COR out of experimental balls. Its two-layer construction is likely the contributor, although this cannot be confirmed without matched prototypes.
The dimple number as a whole did not show a consistent relationship with distance. The Mizuno RB Tour, having the fewest dimples (272), and the Titleist Pro V1, having the most (388), were both among the longest golf balls. The fact that two balls at opposite extremes of the spectrum performed similarly supports that dimple count alone does not determine distance. There are much more intricate factors at play in aerodynamic performance, including dimple depth, coverage, and pattern. Similarly, compression did not track distance in a clear pattern. The Bridgestone Tour B RXS and PXG Xtreme Tour X, both testing opposite ends of the compression spectrum, outdrove the control by similar margins (+26 and +23.4 yd, respectively). This is interesting for the low compression ball, which was expected to lose some distance to the control. The disparity suggests that for the swing speed tested, about 100 mph, compression is not a limiting factor.
The Mizuno RB Max, which was testing an ionomer cover, was the longest ball overall, traveling 31.1 yd further than the control, on average. This ball also had the lowest spin (about 3,050 rpm) and the highest estimated COR (about 0.76). As ionomer covers are known to promote low spinning, distance oriented balls off the tee, the results are consistent with reputation. Accordingly, ionomer covers are associated with less greenside spin and control, though this trade-off was not analyzed in this study, as only full driver and seven-iron shots were recorded.
Physical Applications and Aerodynamics
The driver results follow established and understood physical patterns. With backspin, lift is generated through the Magnus effect, yet backspin also increases drag. Beyond a moderate optimum, added drag costs more carry than the lift from the Magnus effect returns20,21. The control and two-layer Prime 2.0 spun roughly 1,000 to 1,400 rpm more than other experimental golf balls, consistent with distance lost due to excessive spin. The estimated COR of well-struck shots approached the values reported for premium balls in rigid-plate testing27. The model however, is limited, both because of the tangential nature of iron impact and the fact that the shaft’s contribution during impact was not considered. Smash factor and coefficient of restitution are both very similar metrics that depend on contact quality, but COR re-expresses the metric in a physical, regulated form where it can be compared to recorded values for other golf balls. Since the coefficient of restitution is calculated on only well-struck shots, differences can be reasonably attributed to the golf ball, providing valuable insight for mechanics in rollback golf balls.
The reason why driver results had so much more significance than results with the seven-iron is due to swing speed and loft. At higher swing speeds used with the driver, combined with the significantly lower loft of the club face, small differences in spin and energy transfer compound into larger carry differences with more time in the air. With the seven-iron, however, which is swung at a slower speed and has a higher loft, those same differences turn into noise, limiting the amount of significant results.
Future Research
With access to more advanced equipment and materials, this study would benefit from using prototype balls matched exactly on every construction feature except for one. Moreover, a swing robot could be utilized to entirely remove human error from the golf swing. If a significantly larger subset of data points could be collected (more golf shots), whether with a human swing or robot, a multivariable model would be suitable to quantify differences between golf balls, even if they do not exactly match on every construction factor except for one. This would allow for more certainty in declaring correlations between ball construction and outcomes in performance. If a human swing was still necessary in this format, randomizing the ball order within sessions and analyzing data with a mixed effects model that includes data from each different club and day of testing would separate results from possible drift in swing quality between sessions, making the results more reliable. In terms of building on this study, extending the design across a multitude of common swing speeds and analyzing whether results differ for players that swing slower or faster would be relevant for the broader golf community and how the golf ball rollback may affect recreational golfers.
Acknowledgements
The author would like to thank mentor Henry Love of the University of Pennsylvania for his guidance throughout the research and writing process.
Appendix
Raw data, as well as complete per-ball inferential statistics (Welch and Mann-Whitney tests, Holm and Benjamini-Hochberg–corrected p-values, effect sizes) and ANOVA/Kruskal-Wallis results are available from the author upon request.
References
- S. J. Quintavalla. A generally applicable model for the aerodynamic behavior of golf balls. In: E. Thain (ed.), Science and Golf IV: Proceedings of the 2002 World Scientific Congress of Golf, pg. 341–348. Routledge, London, 2002. [↩] [↩]
- E. Achenbach. The effects of surface roughness and tunnel blockage on the flow past spheres. Journal of Fluid Mechanics. Vol. 65, pg. 113–125, 1974, doi:10.1017/S0022112074001285. [↩] [↩]
- J. N. Libii. Dimples and drag: experimental demonstration of the aerodynamics of golf balls. American Journal of Physics. Vol. 75, pg. 764–767, 2007, doi:10.1119/1.2673248. [↩] [↩]
- J. M. Davies. The aerodynamics of golf balls. Journal of Applied Physics. Vol. 20, pg. 821–828, 1949, doi:10.1063/1.1698540. [↩]
- P. W. Bearman, J. K. Harvey. Golf ball aerodynamics. Aeronautical Quarterly. Vol. 27, pg. 112–122, 1976, doi:10.1017/S0001925900007617. [↩]
- E. Achenbach. Experiments on the flow past spheres at very high Reynolds numbers. Journal of Fluid Mechanics. Vol. 54, pg. 565–575, 1972, doi:10.1017/S0022112072000874. [↩]
- J. Choi, W. P. Jeon, H. Choi. Mechanism of drag reduction by dimples on a sphere. Physics of Fluids. Vol. 18, pg. 041702, 2006, doi:10.1063/1.2191848. [↩]
- C. H. Tai, J. C. Leong, C. Y. Lin. Effects of golf ball dimple configuration on aerodynamics, trajectory, and acoustics. Journal of Flow Visualization and Image Processing. Vol. 14, pg. 183–200, 2007, doi:10.1615/JFlowVisImageProc.v14.i2.40. [↩]
- L. L. Ting. Effects of dimple size and depth on golf ball aerodynamic performance. ASME/JSME 2003 4th Joint Fluids Summer Engineering Conference. pg. 811–817, 2003, doi:10.1115/FEDSM2003-45081. [↩]
- K. Aoki, A. Ohike, K. Yamaguchi, Y. Nakayama. Flying characteristics and flow pattern of a sphere with dimples. Journal of Visualization. Vol. 6, pg. 67–76, 2003, doi:10.1007/BF03180966. [↩]
- F. Alam, T. Steiner, H. Chowdhury, H. Moria, I. Khan, F. Aldawi, A. Subic. A study of golf ball aerodynamic drag. Procedia Engineering. Vol. 13, pg. 226–231, 2011, doi:10.1016/j.proeng.2011.05.077. [↩]
- F. Alam, H. Chowdhury, B. Loganathan, I. Mustary. A study of aerodynamic drag of contemporary footballs. Procedia Engineering. Vol. 147, pg. 81–86, 2016, doi:10.1016/j.proeng.2016.06.193. [↩]
- H. Chowdhury, B. Loganathan, Y. Wang, I. Mustary, F. Alam. A study of dimple characteristics on golf ball drag. Procedia Engineering. Vol. 147, pg. 87–91, 2016, doi:10.1016/j.proeng.2016.06.194. [↩]
- K. Moriyama, H. Okanaga. Effects of golf ball dimple surface occupancy, volume ratio and depth on aerodynamic characteristics during rotation. Sports Engineering. Vol. 26, article 10, 2023, doi:10.1007/s12283-023-00400-0. [↩]
- Z. Abbas, S. I. A. Shah, A. Javed, M. Jamil. Influence of dimple design on aerodynamic drag of golf balls. 2019 6th International Conference on Aerospace Science and Engineering (ICASE), IEEE. pg. 1–7, 2019, doi:10.1109/ICASE48783.2019.9059229. [↩]
- C. E. Smith, N. Beratlis, E. Balaras, K. Squires, M. Tsunoda. Numerical investigation of the flow over a golf ball in the subcritical and supercritical regimes. International Journal of Heat and Fluid Flow. Vol. 31, pg. 262–273, 2010, doi:10.1016/j.ijheatfluidflow.2010.01.002. [↩]
- J. Li, M. Tsubokura, M. Tsunoda. Numerical investigation of the flow around a golf ball at around the critical Reynolds number and its comparison with a smooth sphere. Flow, Turbulence and Combustion. Vol. 95, pg. 415–436, 2015, doi:10.1007/s10494-015-9630-4. [↩]
- J. Li, M. Tsubokura, M. Tsunoda. Numerical investigation of the flow past a rotating golf ball and its comparison with a rotating smooth sphere. Flow, Turbulence and Combustion. Vol. 99, pg. 837–864, 2017, doi:10.1007/s10494-017-9859-1. [↩]
- J. Crabill, F. D. Witherden, A. Jameson. High-order computational fluid dynamics simulations of a spinning golf ball. Sports Engineering. Vol. 22, article 9, 2019, doi:10.1007/s12283-019-0300-y. [↩]
- K. Aoki, K. Muto, H. Okanaga. Aerodynamic characteristics and flow pattern of a golf ball with rotation. Procedia Engineering. Vol. 2, pg. 2431–2436, 2010, doi:10.1016/j.proeng.2010.04.011. [↩] [↩]
- M. Muto, M. Tsubokura, N. Oshima. Negative Magnus lift on a rotating sphere at around the critical Reynolds number. Physics of Fluids. Vol. 24, pg. 014102, 2012, doi:10.1063/1.3673571. [↩] [↩]
- J. Kim, H. Choi, H. Park, J. Y. Yoo. Inverse Magnus effect on a rotating sphere: when and why. Journal of Fluid Mechanics. Vol. 754, R2, 2014, doi:10.1017/jfm.2014.428. [↩]
- T. Kray, J. Franke, W. Frank. Magnus effect on a rotating sphere at high Reynolds numbers. Journal of Wind Engineering and Industrial Aerodynamics. Vol. 110, pg. 1–9, 2012, doi:10.1016/j.jweia.2012.07.005. [↩]
- N. Beratlis, K. Squires, E. Balaras. Numerical investigation of Magnus effect on dimpled spheres. Journal of Turbulence. Vol. 13, pg. 1–15, 2012, doi:10.1080/14685248.2012.676182. [↩]
- B. Lyu, J. Kensrud, L. Smith. The reverse Magnus effect in golf balls. Sports Engineering. Vol. 23, article 3, 2020, doi:10.1007/s12283-020-0318-1. [↩]
- N. Sakib, B. L. Smith. Study of the reverse Magnus effect on a golf ball and a smooth ball moving through still air. Experiments in Fluids. Vol. 61, article 115, 2020, doi:10.1007/s00348-020-02946-2. [↩]
- K. Arakawa, T. Mada, H. Komatsu, et al. Dynamic deformation behavior of a golf ball during normal impact. Experimental Mechanics. Vol. 49, pg. 471–477, 2009, doi:10.1007/s11340-008-9156-y. [↩] [↩] [↩]
- K. Arakawa, T. Mada, H. Komatsu, et al. Dynamic contact behavior of a golf ball during an oblique impact. Experimental Mechanics. Vol. 46, pg. 691–697, 2006, doi:10.1007/s11340-006-9257-4. [↩]
- K. Arakawa, T. Mada, H. Komatsu, et al. Dynamic contact behavior of a golf ball during an oblique impact: effect of friction between the ball and target. Experimental Mechanics. Vol. 47, pg. 277–282, 2007, doi:10.1007/s11340-006-9018-4. [↩]
- R. Cross. The coefficient of restitution for collisions of happy balls, unhappy balls, and tennis balls. American Journal of Physics. Vol. 68, pg. 1025–1031, 2000, doi:10.1119/1.1285945. [↩]
- A. J. Cochran. Development and use of one-dimensional models of a golf ball. Journal of Sports Sciences. Vol. 20, pg. 635–641, 2002, doi:10.1080/026404102320183202. [↩]
- A. Caldwell, J. McPhee. Three-dimensional golf clubhead–ball impact models for drivers and irons. Sports Engineering. Vol. 27, article 16, 2024, doi:10.1007/s12283-024-00456-6. [↩]
- A. J. Cochran, M. R. Farrally (eds.). Science and Golf II: Proceedings of the World Scientific Congress of Golf. E & FN Spon, London. 1994. [↩]
- A. J. Smits, D. R. Smith. A new aerodynamic model of a golf ball in flight. In: A. J. Cochran, M. R. Farrally (eds.), Science and Golf II, pg. 340–347. E & FN Spon, London, 1994. [↩]
- L. L. Ting. Application of CFD technology analyzing the three-dimensional aerodynamic behavior of dimpled golf balls. ASME International Mechanical Engineering Congress and Exposition. 2002, doi:10.1115/IMECE2002-32349. [↩]
- R&A and USGA. Distance Insights Report and Notice to Manufacturers on the Overall Distance Standard. USGA and R&A. 2020–2023. [↩] [↩]