Abstract
Insurance companies handle millions of vehicle damage claims each year, creating a need for faster and more consistent ways to estimate repair costs. This study investigates whether insurance claim amounts can be predicted using only images of damaged cars. Three deep learning models were tested: ResNet152V2, ResNeXt50, and a self-supervised Vision Transformer called DINOv2 (small). All models used the same dataset of 1,337 vehicle damage images and training setup to ensure a fair comparison. Model performance was measured using mean squared error and R² score on normalized values. A quantitative comparison was also made using GPT-5.5 as a Vision Language Model (VLM) that used in-context prompting rather than task-specific fine-tuning. The results show that DINOv2 achieved the lowest error when compared to the Convolutional Neural Network (CNN) models. GPT’s estimates consistently overpredict costs, especially for severe damage. Overall, the findings suggest that the self-supervised DINOv2 features were more effective than the supervised CNN features tested here, with DINOv2-Small having achieved R² = 0.12 vs. 0.07 for ResNet152V2 and 0.08 for ResNeXt50.
Keywords: Vision Transformer, CNN, Insurance claim prediction, DINOv2, Transfer learning, Computer vision
Introduction
Over 30 million vehicle insurance claims are filed annually in the United States, pushing insurers to develop efficient processing methods1. Automated claims systems increasingly use multiple sources of evidence, including vehicle information, policy data, historical records and visual evidence. Vehicle images are particularly useful because they provide direct evidence of visible physical damage.
Manual assessment of vehicle damage can be time-consuming and difficult to standardise, motivating the use of computer vision for automated inspection2,3,4. CNN-based systems have been widely applied to vehicle damage detection and are commonly transferred from supervised datasets such as ImageNet5,6,7. However, claim-cost estimation is a continuous regression problem rather than a damage-classification task, so the model must relate visual features to a numerical outcome rather than simply assign predefined categories8,9.
DINOv2 is a self-supervised Vision Transformer designed to learn general visual representations from large-scale unlabelled data. Its reported transfer performance across image and pixel-level tasks supports the use of pretrained features for downstream applications10. More broadly, recent self-supervised Vision Transformer research has shown that representations learned without task-specific labels can transfer effectively to new visual tasks11,12,13,14,15,16,17.
Despite substantial progress in automated vehicle-damage analysis and self-supervised visual representation learning, the literature identified here contains limited direct comparison of self-supervised Vision Transformers with supervised CNNs for insurance claim-cost regression. This study addresses that specific gap by comparing DINOv2-Small with ResNet152V2 and ResNeXt50 under a controlled experimental setup.
In addition to qualitative evaluation, this study examines model interpretability through attention-map analysis. Attention from the final DINOv2 block is visualised to investigate whether accurate predictions correspond to attention concentrated on structurally relevant vehicle regions. The study also includes a Vision Language Model baseline, motivated by recent work showing that multimodal models are beginning to be evaluated specifically for insurance tasks18,19.
Literature Review
Convolutional Neural Networks
CNNs remain an important foundation for image-based machine learning. ResNet introduced residual connections that allow very deep networks to be trained effectively20, while ResNeXt extended residual architectures through grouped transformations21. The pre-activation identity-mapping formulation used by ResNetV2 further improves information and gradient flow through deep networks22. More recent vehicle-damage research confirms the practical usefulness of CNN-based transfer learning: CNN systems have been used to localise and classify damage across multiple categories, including small damage under difficult lighting and surface conditions6,7.
However, CNN-based vehicle inspection studies also demonstrate important challenges. Reflections, dirt, image quality and variations in vehicle appearance can reduce detection performance6,23. These systems are primarily designed for classification, detection or segmentation, whereas insurance claim-cost prediction requires a continuous numerical estimate. This distinction is important because the final cost may depend on factors that are only partly visible in an image, such as the vehicle’s value, replacement versus repair decisions and labour costs8,9.
Vehicle Damage Assessment
Vehicle damage assessment has therefore developed from simple damage classification toward object detection and instance or semantic segmentation. Improved Mask R-CNN methods have been used to identify damage locations and severity24,8, while other CNN frameworks have focused on recognising damaged surface parts in real scenes25. Automated vehicle inspection systems have also used pretrained VGG and DenseNet models to classify multiple damage types2. Research on shared-mobility vehicles has shown that CNN-based systems can approach domain-expert performance for locating and classifying damage, although reflections remain challenging6.
Cost Prediction from Images
More recent datasets have helped move vehicle-damage research toward more realistic evaluation. CarDD provides thousands of high-resolution images with annotated damage instances for detection and segmentation26, while VehiDE was developed specifically for vehicle-damage detection in an insurance context27. Recent work has also explored AI-driven identification using VehiDE28 and high-performance detection methods such as DiffusionDet29. These studies demonstrate that visual damage localisation is becoming increasingly capable, but they mainly address detection, segmentation or severity rather than direct monetary claim regression.
Direct cost estimation introduces an additional challenge because the relationship between visual appearance and monetary value is indirect. Work on automatic damaged-vehicle estimation has combined detection, segmentation and severity assessment8, while other research has explicitly investigated car repair-cost prediction using regression and structured damage information9. This distinction supports the need to treat claim amount as a regression target rather than assuming that greater visible damage automatically corresponds to a proportionally higher claim.
Vision Transformers and Self-Supervised Transfer Learning
Vision Transformers (ViTs) provide an alternative visual representation by dividing images into patches and modelling relationships between them using self-attention30. The original ViT demonstrated that transformer architectures could perform strongly on image recognition, while later models such as DeiT and Swin Transformer improved data efficiency and architectural scalability31,32,13. These developments are relevant to damage assessment because attention-based models can integrate information from multiple image regions rather than relying only on local convolutional receptive fields.
Self-supervised learning has further expanded the use of Vision Transformers when labelled data are limited. DINO introduced self-distillation for Vision Transformers and showed that useful semantic representations can emerge without manual labels11. Subsequent approaches including MoCo v312, MAE14, SimMIM15, data2vec16 and iBOT17 demonstrated alternative ways of learning transferable visual features from unlabelled images. DINOv2 builds on this direction by scaling self-supervised training and producing general-purpose visual features that can be transferred to downstream tasks10.
Multimodal Insurance Models
Evidence from related continuous-value prediction tasks also shows why visual information may benefit from additional context. Image-based property valuation has used visual features to estimate continuous prices33, while more recent work has combined interior, exterior and satellite images with structured property attributes34. Other studies have found that image-derived information can provide only a modest improvement when added to conventional property variables35. These findings are relevant to insurance because claim cost is similarly influenced by information that may not be directly observable from an image.
Multimodal insurance research supports the same conclusion. Automated claims systems have combined computer vision with broader claim-management workflows3, while image-based antifraud systems have found that combining visual similarity with vehicle information improves performance36. More recent work has introduced insurance-specific multimodal benchmarks for large Vision Language Models, including tasks involving damaged vehicles and claim assessment37,19. These studies suggest that structured metadata and textual information can complement visual evidence, while also highlighting the difficulty of relying on images alone.
Research Gap
Overall, the literature shows strong progress in vehicle damage detection, segmentation, visual representation learning and multimodal insurance systems, but a specific gap remains in comparing self-supervised Vision Transformer representations with supervised CNN representations for direct insurance claim-cost regression. The present study addresses this gap using DINOv2-Small, ResNet152V2 and ResNeXt50 under a common experimental framework, while separately examining attention maps and a Vision Language Model baseline.
Methodology
Dataset
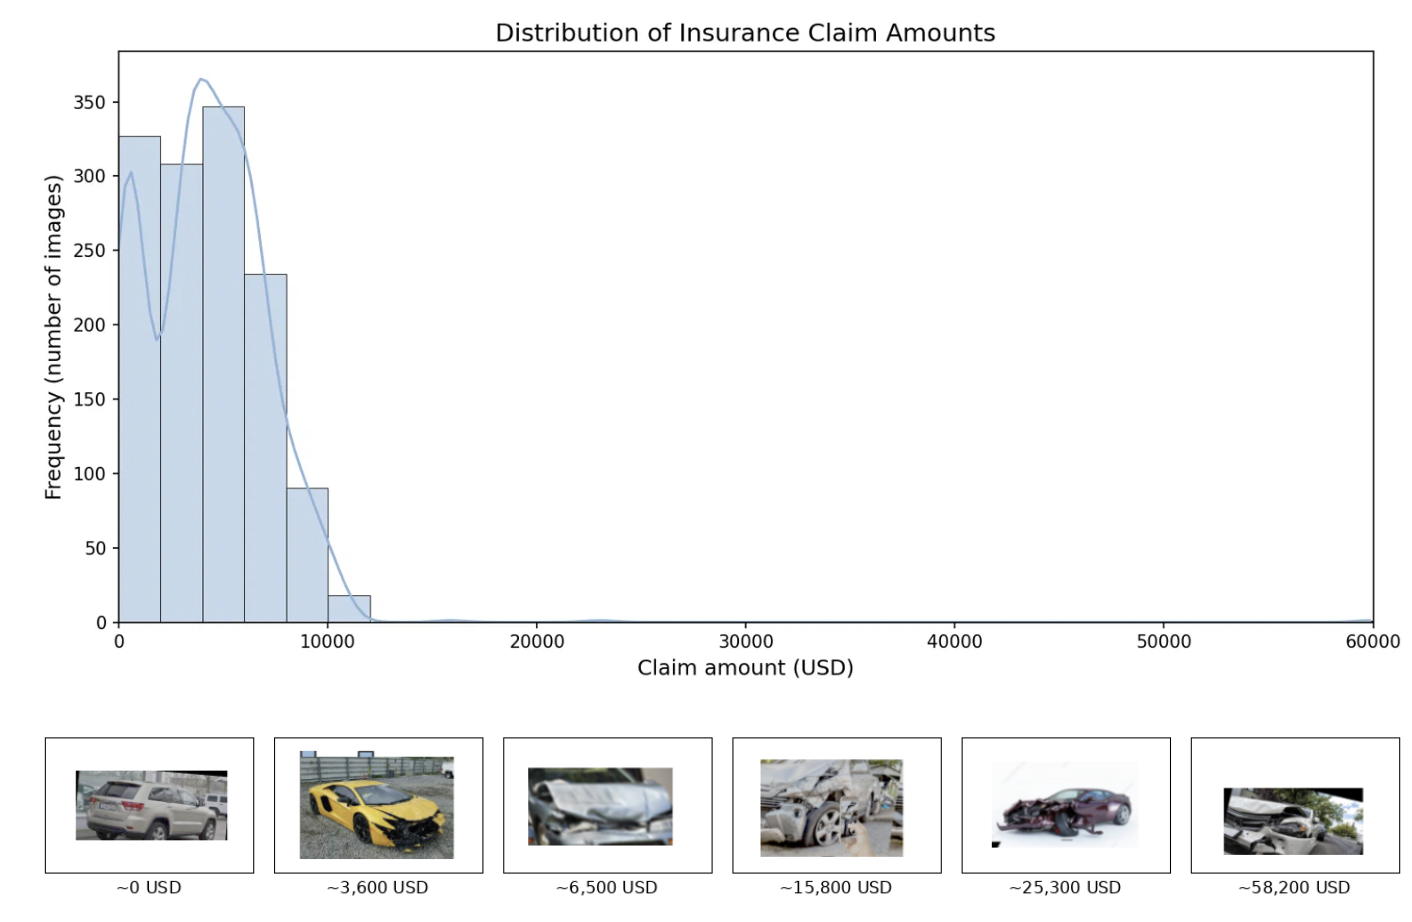
The dataset used in this study was obtained from a challenge hosted on HackerEarth38 mirrored on Kaggle. It contains 1,400 vehicle images along with associated metadata, including the insurance claim amount, minimum and maximum coverage, vehicle price, insurance expiry date, and an indicator of whether the vehicle was damaged. For this study, only the Image of the car and insurance claim amounts were used as the goal of the study is to compare performance in predicting the insurance claim amount based solely on an image. The insurance claim amounts were normalised using z score normalisation and formula (z = (x – μ) / σ) (μ = 4,117.4 and σ = 3,152.52) to ensure stable model training and allow for fair comparison between different models. Most insurance claim amounts were concentrated within the range of 0 to 10,000 USD, with a small number of anomalous values extending up to approximately 60,000 USD. The distribution of insurance claim values along with some example images in where they lie in the distribution is shown in Figure 1.
Data Preprocessing
All images were resized to a resolution of 518 × 518 pixels as the DINOv2 (small) is designed to work optimally with a native resolution of 518 x 518 pixels. The model is a Vision Transformer with a 14 x 14 patch size, and 518 is a multiple of 14 allowing for a clean division of the image into patches without padding or resizing artifacts. Although ResNet152V2 and ResNeXt50 are typically pretrained on 224 × 224 images, CNNs can naturally process larger input sizes because convolutional filters operate locally and are not restricted to a fixed resolution. Using 518 × 518 inputs is therefore a valid transfer learning approach and may preserve more detail in damaged regions. However, since this is not the resolution used during pretraining, the CNNs may not be as well calibrated as DINOv2, which was designed for this input size. In addition, the dataset was pruned through manual inspection to remove irrelevant images, as illustrated in Figure 2.
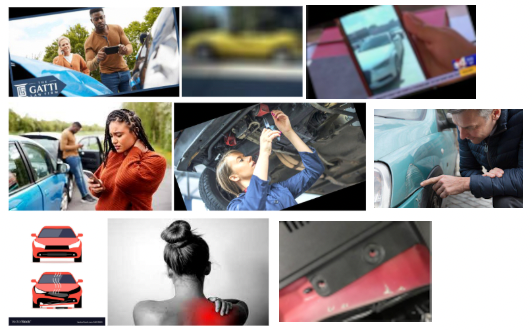
After preprocessing, the final size of the dataset was 1,337 images. Any images that could not be loaded correctly were automatically skipped to avoid introducing invalid data into the training process.
The dataset was originally provided with separate training and testing folders; however, the provided test folder did not include ground truth values for the insurance claim amount and was not used. As a result, the original training folder was split into training and validation subsets using an 80/20 split (1,071 training images and 266 validation images). All results reported in this study are on this validation subset.
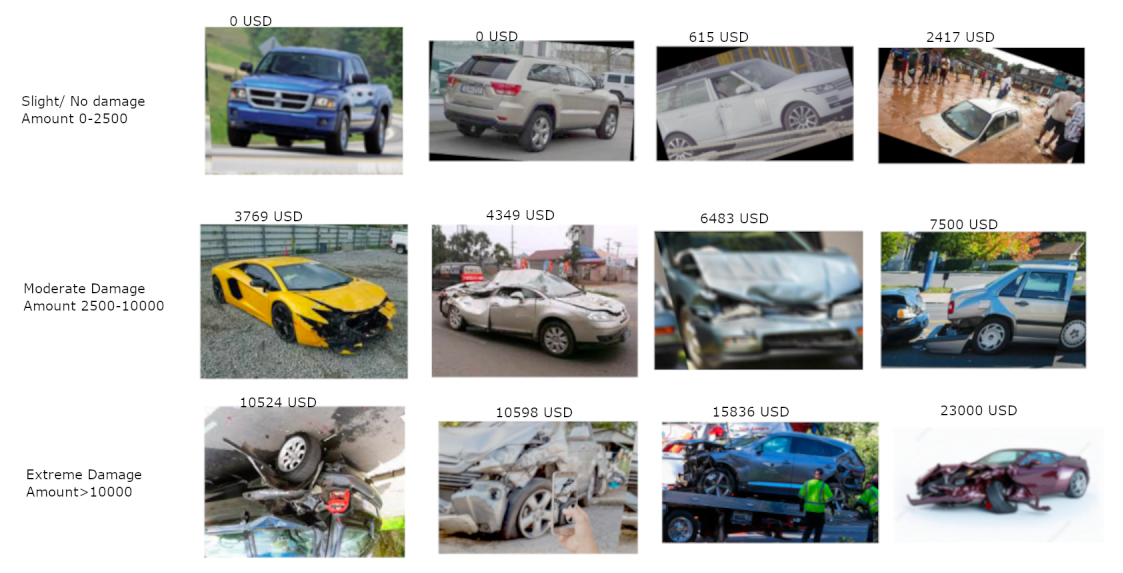
Figure 3 presents representative vehicle images alongside their corresponding ground-truth claim values, providing visual context for the types and severity of damage represented in the dataset.
Models Evaluated
Three deep learning models were evaluated in this study: ResNet152V2, ResNeXt50, and DINOv2-Small. For each model, the pretrained backbone was kept frozen and a lightweight regression head was added to predict the insurance claim amount. This design ensures that differences in performance are primarily due to the quality of the learned visual representations rather than variations in training complexity or extensive fine-tuning. For ResNet152V2 and ResNeXt50, the regression head consisted of a GlobalAveragePooling2D layer, followed by a fully connected layer with 512 units and ReLU activation, and a final single linear output neuron. For DINOv2-Small, the backbone already outputs a fixed-length feature vector, so a simple multilayer perceptron (MLP) regression head was used, consisting of a 512-unit hidden layer with ReLU activation followed by a single linear output neuron. Although the CNN models include an additional pooling layer, all three architectures use the same core regression structure of a 512-unit hidden layer and a single linear output, ensuring a consistent and fair comparison. Both CNN models used ImageNet-1K pretrained weights, while DINOv2-Small used self-supervised pretrained weights.
Training Procedure
Only the regression head of each model was trained, while all backbone weights remained fixed. Training was performed using mean squared error (MSE) loss on the normalised target values. There was no explicit L2 regularization or data augmentation applied to any of the models. All models had a fixed learning rate of 1e-4 with an adam optimizer. Model performance was evaluated using R2 (and MSE). All models used batch sizes of 32. The max epochs used was 50 for all models.
Scoring Procedure
The DINOv2 model was evaluated using the validation set with gradient computation disabled. Predictions and corresponding ground-truth values were collected across all validation batches and concatenated into a single set of predictions and targets. Samples containing NaN values were removed prior to evaluation. Model performance was assessed using mean squared error (MSE) and the coefficient of determination (R²), calculated on the normalized claim values using the corresponding implementations from scikit-learn.
Results
MSE and R2
| MODEL | Model MSE (mean ± sd) | R2 Score (mean ± sd) | Epoch with lowest validation MSE | Training time (s) (mean) |
| Constant mean baseline | 0.8078 | 0.0000 | – | – |
| Constant median baseline | 0.8078 | 0.0000 | – | – |
| Predict 0 baseline | 2.5661 | -2.1766 | – | – |
| ResNet152V2 | 0.7544 ± 0.0011 | 0.0664 ± 0.0010 | 16 | 12,999.0 |
| ResNeXt50 | 0.7460 ± 0.0029 | 0.0755 ± 0.0027 | 4 | 2,081.2 |
| DINOv2 Small | 0.7115 ± 0.0011 | 0.1201 ± 0.0009 | 3 | 265.2 |
Note: The MSE Values are of the normalised Amount values. Higher R2 and lower validation MSE indicates a better performance of the model. Each model was trained across 8 independent runs.
The reported epoch corresponds to the epoch achieving the lowest MSE on the 20% validation split.
Statistical comparison table
| Comparison | Mean difference | t-statistic | p-value | df | Significance |
| ResNeXt50 vs ResNet152V2 | 0.0091 | 9.48 | <0.0001 | 14 | *** |
| DINOv2 Small vs ResNet152V2 | 0.0537 | 96.38 | <0.0001 | 14 | *** |
| DINOv2 Small vs ResNeXt50 | 0.0446 | 38.89 | <0.0001 | 14 | *** |
Note: Independent two sample t test were run on the R2 scores using pooled variances
Analysis and Discussion
The performance of the three evaluated models – ResNet152V2, ResNeXt50, and DINOv2 Small were compared using validation mean squared error (MSE) and the coefficient of determination (R²), MSE is reported on normalised values; R² is invariant to scaling.
Among the CNN based models, ResNeXt50 outperformed ResNet152V2. This improvement is reflected in the R² scores, with ResNeXt50 achieving an R² of 0.0765, slightly higher than the 0.0661 obtained by ResNet152V2. The superior performance of ResNeXt50 suggests that its grouped convolution design allows for more effective feature extraction than the deeper ResNet architecture for this regression task. The DINOv2 Small model achieved the best overall performance across all evaluated metrics. It obtained the lowest validation MSE of 0.7115 and the highest R² score of 0.1191, demonstrating a stronger ability to explain variance in insurance claim amounts compared to both CNN models.
One possible explanation for DINOv2’s improved performance, though not directly tested by an ablation in this study, is its ability to model global image context using self-attention mechanisms, which may allow it to capture structural damage patterns and scene-level information more effectively than CNNs, which primarily focus on local texture features. This mechanistic account is offered as a plausible interpretation rather than a demonstrated causal finding. This global reasoning capability is particularly important for insurance claim estimation, where overall damage severity and spatial relationships are more informative than isolated visual details.
Although all models achieved relatively low R² scores, indicating that image only prediction remains a challenging task, the performance observed with DINOv2 suggests that self-supervised Vision Transformers provide modest but consistent improvements. These results lend support to the hypothesis that foundation vision models are better suited for image-based insurance claim regression than traditional supervised CNN architectures.
Attention map methodology
Attention maps were generated from the final attention block of the DINOv2-Small backbone. The attention from the CLS token to all image patches was extracted separately for each attention head and then averaged across heads to produce a single attention map. This patch-level map was reshaped into a square grid corresponding to the image patch layout and upscaled to the original 518 × 518 image resolution using Lanczos interpolation. The resulting map was normalised between 0 and 1 and overlaid on the original image to visualise the regions receiving the greatest attention from the model.
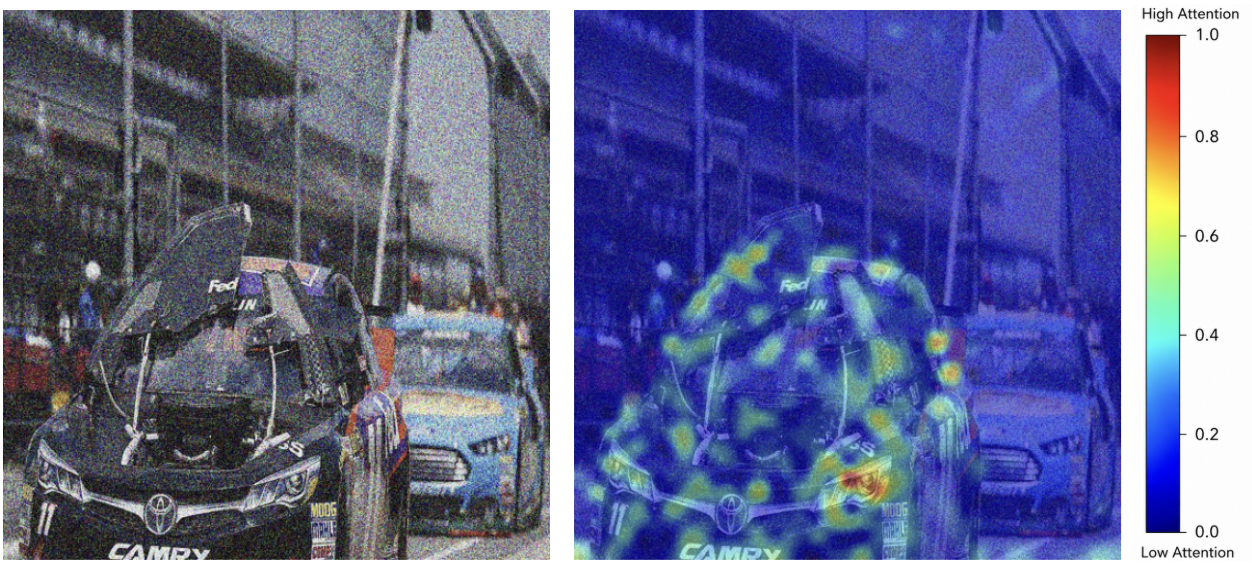
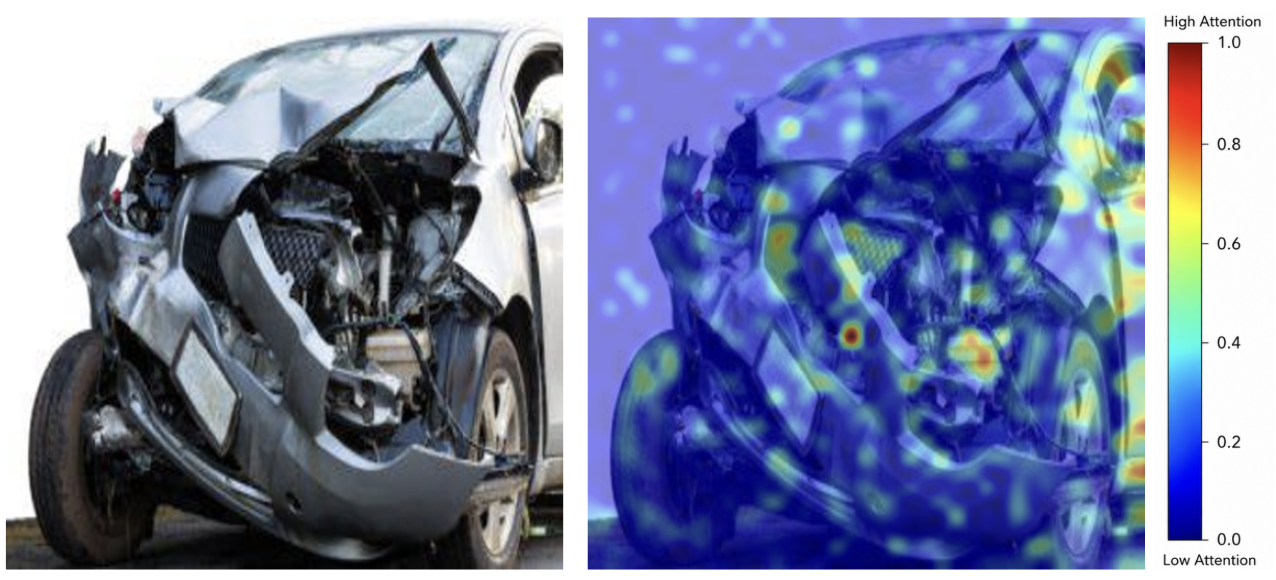
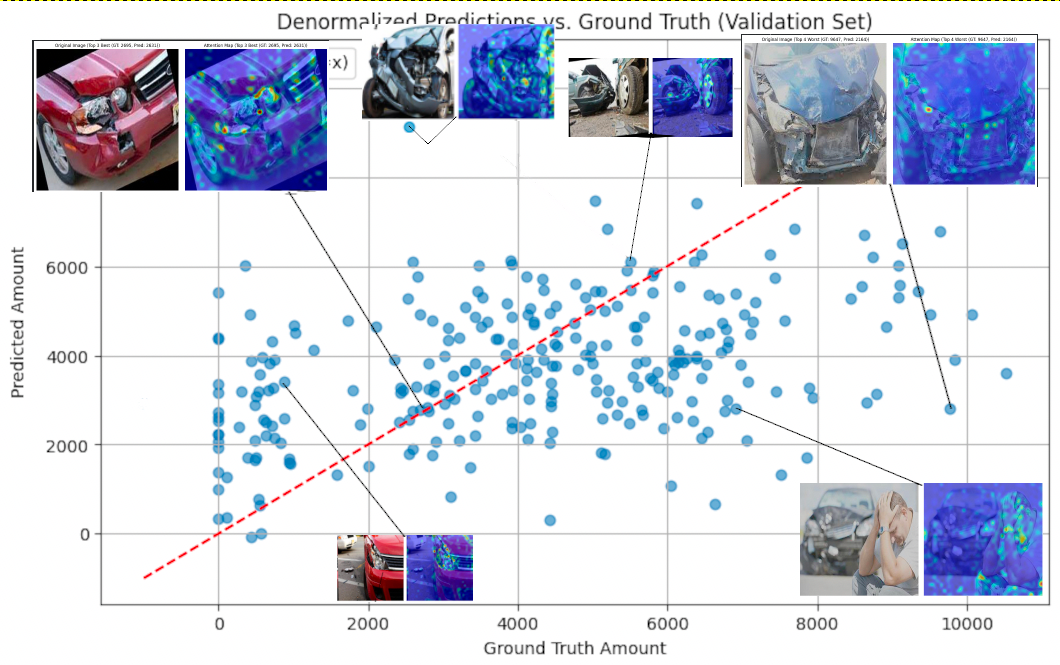
Figures 4 and 5 provide qualitative examples of attention behaviour for two individual predictions, while Figure 6 shows the overall relationship between predicted and ground truth claim values across the validation set. The red dashed line in Figure 6 represents the ideal prediction (y = x), and the spread of points around this line illustrates the prediction errors and bias of the model. A noticeable number of points lie above the diagonal, indicating a tendency toward overestimation for some validation examples.
The attention maps are presented here as illustrative examples rather than as evidence of a causal relationship between attention behaviour and prediction accuracy. In Figure 4, the model’s attention is concentrated on regions such as the front body panels, headlights, and windshield, and the resulting prediction of 3585 USD is close to the ground truth of 3579 USD. Similarly, Figure 5 provides an example of a substantially overestimated prediction, where the attention appears more diffuse and includes less informative regions. However, these two examples alone cannot establish that concentrated attention consistently produces more accurate predictions or that diffuse attention directly causes larger errors.
This distinction is particularly important for Figure 4 because the input is a NASCAR race car and is therefore outside the primary distribution of the dataset. Although the prediction is remarkably close to the ground truth, this single example should not be interpreted as evidence that the observed attention pattern causes accurate prediction. Instead, it demonstrates that the model can, in some individual cases, attend to visually meaningful regions while producing an accurate estimate.
More broadly, Figure 6 demonstrates substantial variability between predicted and actual claim amounts. The selected attention maps in Figures 4 and 5 help provide qualitative visual context for this variability by showing two contrasting examples of model behaviour. The accurate example demonstrates an instance where attention appears visually relevant, whereas the high-error example demonstrates an instance where attention appears less focused on relevant damage. These observations are useful for interpreting individual predictions, but they should not be generalised to the validation set without quantitative analysis of the relationship between attention characteristics and prediction error.
The relatively low R² score further indicates that substantial variation in claim amounts remains unexplained by the model. One possible contributing factor is that the model may rely strongly on visible damage severity while having limited information about vehicle-specific factors, such as model value and repair costs. Therefore, the attention visualizations should primarily be regarded as an interpretability tool for examining individual predictions, rather than as direct evidence that attention quality determines prediction performance.
VLM Comparison
Methodology
In addition to the trained deep learning models, GPT-5.5 (snapshot version May 3rd 2026) was evaluated as a Vision Language Model (VLM) baseline. Unlike the CNN and DINOv2 models, GPT was not fine-tuned on the insurance dataset and instead relied purely on visual reasoning from its generalised training to estimate claim costs from images. This comparison was included to assess how a general purpose multimodal model performs relative to models trained specifically for this regression task. Two experiments were conducted. In the first, the model was prompted directly with each one of the 1,337 images and asked to estimate the claim cost in USD (zero-shot setting). In the second, ten labelled examples were provided as few-shot demonstrations before inference. The VLM evaluation was conducted across the full dataset in batches of five images. The same prompt was applied to each batch to maintain consistency across predictions while reducing API usage.
“Estimate insurance claim cost in USD for each image. Return only numbers in order in the range 0-60,000 USD.”. The range was applied as otherwise, the model was seen exceeding the range by significant margins and producing extremely high MSE values.
Results and Analysis
The zero-shot results showed very poor performance, with a normalised MSE of 19.9610 and an R² score of -18.9755. A negative R² indicates that the model performs worse than simply predicting the mean target value. Predictions exhibited a strong tendency to overestimate costs, with many outputs falling between 10,000 and 60,000 USD regardless of the true claim amount. This suggests that the model relied heavily on the apparent visual severity of the damage while failing to account for factors such as vehicle value limits and realistic insurer payout distributions.
Providing ten labelled examples substantially improved performance. Under the few-shot setting, the normalised MSE decreased to 6.8234, while the R² score improved to -5.8284. The reduction in MSE indicates that the labelled examples helped the model produce estimates that were, on average, closer to the target values. The predictions also showed fewer extreme estimates at the upper limit of 60,000 USD, suggesting that the examples provided some degree of calibration and reduced the tendency toward severe overestimation. However, the improvement remained insufficient to produce reliable quantitative predictions, and performance was still considerably worse than that of the trained computer vision models.
Overall, GPT demonstrated that general-purpose visual reasoning alone is insufficient for accurate insurance claim cost prediction. Even with few-shot examples, the model remained poorly calibrated and substantially underperformed DINOv2, which achieved a validation MSE of 0.7115 and an R² score of 0.1201. This highlights the importance of task-specific learning and dataset-driven calibration for quantitative prediction problems.
Conclusion
This research explored whether recent self-supervised vision models can improve the prediction of insurance claim costs from vehicle images when compared to traditional convolutional neural networks. By evaluating ResNet152V2, ResNeXt50, and DINOv2 Small under a consistent training setup, the study aimed to isolate the effect of representation learning on regression performance.
The results show that the choice of visual representation plays a crucial role in model effectiveness. The self-supervised DINOv2 model achieved the best performance on the validation split amongst the models tested. This suggests that visual features learned from large-scale unlabelled data transfer more effectively to real world regression tasks than supervised convolutional features. In contrast, increasing CNN depth or architectural complexity did not consistently lead to better performance, highlighting the limitations of relying solely on supervised CNN representations for insurance claim estimation.
However, despite these relative improvements, the overall predictive performance remained limited. The best model achieved an R² score of approximately 0.12, meaning that only around 12% of the variation in insurance claim cost could be explained using image data alone. This is a significant finding. It indicates that visual information, while informative, captures only a small portion of the factors that determine final claim cost. Many critical variables – such as vehicle age, market value, repair pricing policies, regional labour costs, and insurer specific assessment rules are not directly observable from images. As a result, predicting precise insurance claim amounts from images alone is inherently difficult.
In addition to trained models, a quantitative comparison was conducted using GPT as a Vision Language Model (VLM). The VLM style predictions, based on visual reasoning rather than learned regression18, consistently overestimated claim costs, particularly in cases of visually severe damage. While reasonable estimates were produced for some moderate damage cases, this approach lacked the calibration and robustness demonstrated by trained models.
Qualitative analysis using attention maps further supports these findings. In cases where predictions were accurate, DINOv2 attention focused on structurally relevant regions of the vehicle, such as visible damage areas. Conversely, large prediction errors were often associated with diffuse or misleading attention patterns, particularly in scenarios where vehicle model, preaccident condition, or inherent value could not be reliably inferred from visual cues alone. This reinforces the idea that global structural understanding is beneficial, but also highlights the inherent limits of visual-only reasoning.
Overall, this study demonstrates two key conclusions. First, within this single-dataset, single-task setup, self-supervised DINOv2 features provided measurable advantages over the ImageNet-1K-pretrained CNN features evaluated here; whether this generalises to self-supervised Vision Transformers or image-based regression tasks more broadly remains to be tested. Second, and more importantly, insurance claim cost prediction from images alone is fundamentally constrained. Future work should therefore focus on multimodal approaches that combine visual information with structured metadata, repair estimates, and contextual financial information. Such integration is likely necessary to achieve meaningful real world performance improvements.
Limitations
One major limitation of this study is the size and quality of the dataset used. The dataset contained only 1,400 vehicle images, and a small number of these had to be pruned due to redundancy, further reducing the amount of available training data. This limited dataset size likely restricted the ability of all evaluated models to fully generalise, particularly for a complex regression task such as insurance claim cost prediction.
Another limitation of this study is that all models were evaluated using an input resolution of 518 × 518 pixels. This resolution matches the native input size of DINOv2, but differs from the standard 224 × 224 resolution used during pretraining for ResNet152V2 and ResNeXt50. As a result, the CNN models were applied at a non-standard resolution, which may have affected the quality of their pretrained feature representations and potentially disadvantaged their performance relative to DINOv2. Although using a common input size simplified the experimental setup, future work should evaluate each architecture at its optimal input resolution to ensure a more rigorous comparison.
Additionally, the images in the dataset varied significantly in resolution and aspect ratio. To ensure compatibility across models, all images were resized to a fixed resolution, which may have distorted visual features and altered important damage related details. This preprocessing step, while necessary for consistency, likely had a negative impact on model performance by reducing the quality and fidelity of the visual information.
A further limitation is that a separate held-out test set was not used. The 20% evaluation split was also used to identify the epoch with the best performance, so the reported metrics may be optimistic and should not be interpreted as unbiased estimates of generalisation to unseen data. In addition, all models used a common 518 × 518 input resolution; this matches DINOv2 but differs from the standard 224 × 224 pretraining resolution of the CNNs, which may have disadvantaged the CNN representations. Future work should use a separate validation and test set or k-fold cross-validation, and should evaluate each architecture at an appropriate input resolution.
Data Availability
License : CC0 Link to access : https://www.kaggle.com/datasets/infernape/fast-furious-and-insured
References
- Verisk. ClaimSearch trends report: 2024 year-end analysis. Published 2025. Available at: https://www.verisk.com/4951a1/siteassets/media/campaigns/gated/claims/claimsearch-trends-report-2024-year-end-analysis.pdf [↩]
- Fouad MM, Malawany K, Osman AG, et al. Automated vehicle inspection model using a deep learning approach. J Ambient Intell Human Comput. 2023;14:13971–13979. doi:10.1007/s12652-022-04105-3 [↩] [↩]
- Atanasious MMH, Becchetti V, Giuseppi A, et al. An Insurtech platform to support claim management through the automatic detection and estimation of car damage from pictures. Electronics. 2024;13(22):4333. doi:10.3390/electronics13224333 [↩] [↩]
- Pérez-Zarate SA, Corzo-García D, Pro-Martín JL, Álvarez-García JA, Martínez-del-Amor MA, Fernández-Cabrera D. Automated car damage assessment using computer vision: Insurance company use case. Appl Sci. 2024;14(20):9560. doi:10.3390/app14209560 [↩]
- Deng J, Dong W, Socher R, Li LJ, Li K, Fei-Fei L. ImageNet: A large-scale hierarchical image database. In: Proceedings of the IEEE Conference on Computer Vision and Pattern Recognition (CVPR). 2009:248–255. doi:10.1109/CVPR.2009.5206848 [↩]
- van Ruitenbeek RE, Bhulai S. Convolutional neural networks for vehicle damage detection. Mach Learn Appl. 2022;9:100332. doi:10.1016/j.mlwa.2022.100332 [↩] [↩] [↩] [↩]
- Pasupa K, Kittiworapanya P, Hongngern N, et al. Evaluation of deep learning algorithms for semantic segmentation of car parts. Complex Intell Syst. 2022;8:3613–3625. doi:10.1007/s40747-021-00397-8 [↩] [↩]
- Qaddour J, Siddiqa SA. Automatic damaged vehicle estimator using enhanced deep learning algorithm. Intell Syst Appl. 2023;18:200192. doi:10.1016/j.iswa.2023.200192 [↩] [↩] [↩] [↩]
- Martis JE, Sannidhan MS, Aravinda CV, Balasubramani R. Car damage assessment recommendation system using neural networks. Mater Today Proc. 2023;92:24–31. doi:10.1016/j.matpr.2023.03.259 [↩] [↩] [↩]
- Oquab M, Darcet T, Moutakanni T, et al. DINOv2: Learning robust visual features without supervision. arXiv. Published 2023. Available at: https://arxiv.org/abs/2304.07193 [↩] [↩]
- Caron M, Touvron H, Misra I, Jégou H, Mairal J, Bojanowski P, Joulin A. Emerging properties in self-supervised Vision Transformers. In: Proceedings of the IEEE/CVF International Conference on Computer Vision (ICCV). 2021:9650–9660. doi:10.1109/ICCV48922.2021.00951 [↩] [↩]
- Chen X, Xie S, He K. An empirical study of training self-supervised Vision Transformers. In: Proceedings of the IEEE/CVF International Conference on Computer Vision (ICCV). 2021:9640–9649. doi:10.1109/ICCV48922.2021.00950 [↩] [↩]
- Touvron H, Cord M, Douze M, Massa F, Sablayrolles A, Jégou H. Training data-efficient image transformers & distillation through attention. In: Proceedings of the 38th International Conference on Machine Learning. 2021;139:10347–10357. [↩] [↩]
- He K, Chen X, Xie S, Li Y, Dollár P, Girshick R. Masked autoencoders are scalable vision learners. In: Proceedings of the IEEE/CVF Conference on Computer Vision and Pattern Recognition (CVPR). 2022:15979–15988. doi:10.1109/CVPR52688.2022.01553 [↩] [↩]
- Xie Z, Zhang Z, Cao Y, Lin Y, Bao J, Yao Z, Dai Q, Hu H. SimMIM: A simple framework for masked image modeling. In: Proceedings of the IEEE/CVF Conference on Computer Vision and Pattern Recognition (CVPR). 2022:9643–9653. doi:10.1109/CVPR52688.2022.00943 [↩] [↩]
- Baevski A, Hsu WN, Xu Q, Babu A, Gu J, Auli M. Data2vec: A general framework for self-supervised learning in speech, vision and language. In: Proceedings of the 39th International Conference on Machine Learning. 2022;162:1298–1312. [↩] [↩]
- Zhou J, Wei C, Wang H, Shen W, Xie C, Yuille A, Kong T. iBOT: Image BERT pre-training with online tokenizer. In: International Conference on Learning Representations (ICLR). 2022. [↩] [↩]
- Bordes F, Pang RY, Ajay A, et al. An introduction to vision-language modeling. arXiv. Published 2024. Available at: https://arxiv.org/abs/2405.17247 [↩] [↩]
- Lin C, Lyu H, Xu X, Luo J. INS-MMBench: A comprehensive benchmark for evaluating LVLMs’ performance in insurance. In: Proceedings of the IEEE/CVF International Conference on Computer Vision (ICCV). 2025:9036–9047. doi:10.1109/ICCV51701.2025.00845 [↩] [↩]
- He K, Zhang X, Ren S, Sun J. Deep residual learning for image recognition. In: Proceedings of the IEEE Conference on Computer Vision and Pattern Recognition (CVPR). 2016:770–778. doi:10.1109/CVPR.2016.90 [↩]
- Xie S, Girshick R, Dollár P, Tu Z, He K. Aggregated residual transformations for deep neural networks. In: Proceedings of the IEEE Conference on Computer Vision and Pattern Recognition (CVPR). 2017:5987–5996. doi:10.1109/CVPR.2017.634 [↩]
- He K, Zhang X, Ren S, Sun J. Identity mappings in deep residual networks. In: Computer Vision – ECCV 2016. Lecture Notes in Computer Science. 2016;9908:630–645. doi:10.1007/978-3-319-46493-0_38 [↩]
- Küchler J, Kröll D, Schoenen S, Witte A. Uncertainty estimates for semantic segmentation: Providing enhanced reliability for automated motor claims handling. Mach Vis Appl. 2024;35:66. doi:10.1007/s00138-024-01541-3 [↩]
- Zhang Q, Chang X, Bian S. Vehicle-damage-detection segmentation algorithm based on improved Mask R-CNN. IEEE Access. 2020;8:6997–7004. doi:10.1109/ACCESS.2020.2964055 [↩]
- Parhizkar M, Amirfakhrian M. Recognizing the damaged surface parts of cars in the real scene using a deep learning framework. Math Probl Eng. 2022;2022:5004129. doi:10.1155/2022/5004129 [↩]
- Wang X, Li W, Wu Z. CarDD: A new dataset for vision-based car damage detection. IEEE Trans Intell Transp Syst. 2023;24(7):7202–7214. doi:10.1109/TITS.2023.3258480 [↩]
- Huynh NT, Tran NND, Huynh AT, Hoang VD, Nguyen HD. VehiDE dataset: New dataset for automatic vehicle damage detection in car insurance. In: Proceedings of the 15th International Conference on Knowledge and Systems Engineering (KSE). 2023:1–6. doi:10.1109/KSE59128.2023.10299490 [↩]
- Hoang VD, Huynh NT, Tran N, Le K, Le TMC, Selamat A, Nguyen HD. Powering AI-driven car damage identification based on VehiDE dataset. J Inf Telecommun. 2025;9(1):24–43. doi:10.1080/24751839.2024.2367387 [↩]
- Arconzo V, Gorga G, Gutierrez G, Omar A, Rangisetty MA, Ricciardi Celsi L, Santini F, Scianaro E. On the application of DiffusionDet to automatic car damage detection and classification via high-performance computing. Electronics. 2025;14(7):1362. doi:10.3390/electronics14071362 [↩]
- Dosovitskiy A, Beyer L, Kolesnikov A, et al. An image is worth 16×16 words: Transformers for image recognition at scale. In: International Conference on Learning Representations (ICLR). 2021. Available at: https://arxiv.org/abs/2010.11929. [↩]
- Wang Y, Deng Y, Zheng Y, Chattopadhyay P, Wang L. Vision Transformers for image classification: A comparative survey. Technologies. 2025;13(1):32. doi:10.3390/technologies13010032 [↩]
- Liu Z, Lin Y, Cao Y, Hu H, Wei Y, Zhang Z, Lin S, Guo B. Swin Transformer: Hierarchical Vision Transformer using shifted windows. In: Proceedings of the IEEE/CVF International Conference on Computer Vision (ICCV). 2021:10012–10022. doi:10.1109/ICCV48922.2021.00986 [↩]
- You Q, Pang R, Cao L, Luo J. Image-based appraisal of real estate properties. IEEE Trans Multimedia. 2017;19(12):2751–2759. doi:10.1109/TMM.2017.2710804 [↩]
- Chen M, Liu Y, Arribas-Bel D, Singleton A. Assessing the value of user-generated images of urban surroundings for house price estimation. Landsc Urban Plan. 2022;226:104486. doi:10.1016/j.landurbplan.2022.104486 [↩]
- Lee H, Han H, Pettit C, Gao Q, Shi V. Machine learning approach to residential valuation: A convolutional neural network model for geographic variation. Ann Reg Sci. 2024;72:579–599. doi:10.1007/s00168-023-01212-7 [↩]
- Maiano L, Montuschi A, Caserio M, et al. A deep-learning-based antifraud system for car-insurance claims. Expert Syst Appl. 2023;231:120644. doi:10.1016/j.eswa.2023.120644 [↩]
- Baltrušaitis T, Ahuja C, Morency LP. Multimodal machine learning: A survey and taxonomy. IEEE Trans Pattern Anal Mach Intell. 2019;41(2):423–443. doi:10.1109/TPAMI.2018.2798607 [↩]
- Infernape. Fast, Furious and Insured [dataset]. Kaggle. Published 2021. Available at: https://www.kaggle.com/datasets/infernape/fast-furious-and-insured [↩]