Abstract
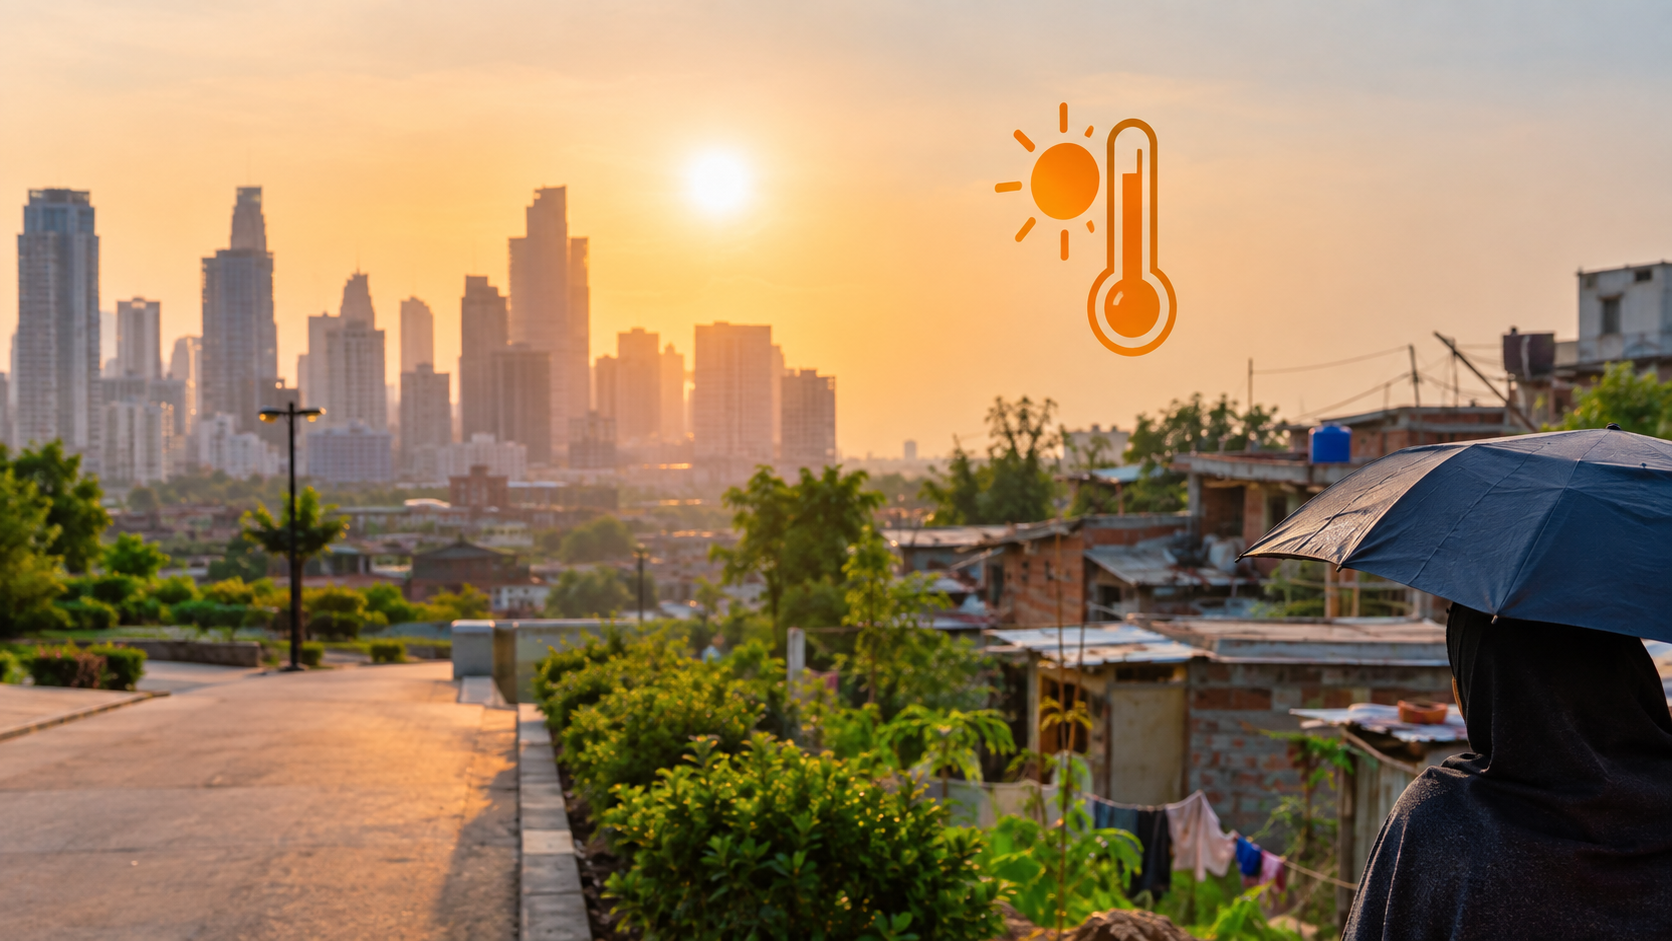
This exploratory, qualitative pilot study examined how residents of neighborhoods with elevated land surface temperatures describe the effects of urban heat exposure on their health, finances, and daily lives, and how those effects relate to pre-existing patterns of environmental injustice. Prior research has documented the physical causes and general mechanisms of urban heat islands (UHIs), but few studies have centered the first-person accounts of residents living in the neighborhoods most affected. Publicly available NASA land-surface-temperature data (Landsat/MODIS) were used only to help identify neighborhoods consistent with elevated urban heat, not as a dataset that this study independently analyzed. Semi-structured interviews were conducted with five adult residents (n = 5) of such neighborhoods, recruited through personal networks. Interview transcripts were read iteratively by the researcher to identify recurring patterns. Across the five interviews, participants described an initial lack of awareness of the “urban heat island” designation, minimal formal government mitigation response, self-reported increases in utility costs, and heat-related health effects among family members, particularly older adults and children. These findings are consistent with, and add lived-experience detail to, existing literature linking historical disinvestment to present-day thermal inequity. Given the small, non-random sample, findings should be read as illustrative of this study’s five participants rather than as generalizable claims about low-income communities or communities of color as a whole. Future research should pursue a longitudinal, mixed-methods design with a larger, systematically sampled population and a matched comparison group.
Keywords: urban heat island, environmental justice, qualitative pilot study, thermal inequity, social determinants of health
Introduction
Environmental justice is the principle that no group of people should bear a disproportionate share of environmental harm, and that all communities deserve a meaningful role in decisions that affect their environment1. Urban heat islands (UHIs) — the tendency of built-up urban areas to register significantly higher temperatures than surrounding vegetated or rural areas — are one contemporary manifestation of this problem. UHIs are not a natural feature of cities; they are, in large part, a downstream product of decades of land-use decisions, including the systematic underinvestment in greening and cooling infrastructure in specific neighborhoods2. Where a heat island forms and how severe it becomes is therefore not distributed randomly across a city, and this is what distinguishes UHI exposure as an environmental justice concern rather than simply a climate vulnerability concern: climate vulnerability describes exposure to a changing climate in general, while the environmental justice framing asks specifically who was made vulnerable, by what historical and policy decisions, and who currently holds the power to change that exposure1,3.
This paper is grounded in two complementary frameworks. Environmental Justice Theory, as articulated by Schlosberg1, holds that justice is not only about the distribution of environmental goods and harms, but also about recognition of affected communities and their meaningful participation in the decisions that shape their exposure. The Social Determinants of Health (SDOH) framework, used by the World Health Organization and the U.S. Centers for Disease Control and Prevention, describes health outcomes as shaped substantially by the non-medical conditions in which people live, work, and age, including housing quality, neighborhood investment, and the built environment3. Read together, these two frameworks suggest that a resident’s exposure to a severe urban heat island is not simply a matter of local geography or weather, but a health outcome shaped by historical patterns of investment and disinvestment, and a justice concern because that exposure was not equally or fairly distributed.
Recent advances in satellite remote sensing, including NASA’s Landsat, MODIS, and ECOSTRESS thermal instruments, have made it possible to observe land-surface-temperature patterns at a neighborhood scale4,5. These tools have allowed researchers to document, with increasing precision, that the hottest parts of many U.S. cities disproportionately overlap with low-income neighborhoods and neighborhoods with large Black and Hispanic populations5,6. What is less understood, and what this study aims to speak to in a preliminary, exploratory way, is how residents living inside these neighborhoods describe and make sense of that exposure in their own words.
Literature Review
This literature review defines urban heat islands, summarizes their principal causes, and situates them within the environmental justice and social determinants of health frameworks introduced above.
Overview and Causes of Urban Heat Islands
A UHI forms when a buildup of heat-absorbing surfaces and a reduction in vegetation cause an urban area to register significantly higher temperatures than its surrounding, less-developed areas, a basic mechanism documented as early as Landsberg’s foundational survey of urban climate effects7. Oke and colleagues later described this as a “dome” of elevated temperature that forms over a city and traps heat near the surface8. The resulting elevated temperatures are associated with a range of harms, including respiratory strain, increased energy demand, and general heat stress8,9.
UHIs are frequently confused with the broader phenomenon of climate warming, but the two are distinct: a UHI is a hyper-local, built-environment effect that can vary by several degrees within a few city blocks, whereas climate change describes a longer-term, global shift in baseline temperature. UHIs become considerably more dangerous during regional heat waves, when an already-elevated urban baseline compounds with extreme weather to overwhelm the body’s ability to thermoregulate10,11. Estrada and colleagues note that although NASA’s Landsat and MODIS instruments are capable of detecting these zones at high spatial resolution, that thermal data is rarely translated into a formal, neighborhood-level policy tool, which leaves many known heat islands unaddressed at the local level12.
The literature identifies two overlapping drivers of UHI formation. The first is a materials-and-design driver: Heaviside and colleagues describe how asphalt, concrete, and dark rooftop materials reduce a landscape’s ability to release heat through evapotranspiration, making dense, historically built-up urban cores more susceptible to heat retention9. The second driver is what this review terms a socially compounded pathway, in which a neighborhood’s heat exposure is shaped less by its materials alone and more by decades of unequal investment. Harlan and colleagues describe this as neighborhood microclimate vulnerability, tied closely to income and the built environment13. A site-level study by Mitchell and Chakraborty reached a similar conclusion in Pinellas County, Florida, where land surface temperatures were significantly elevated in census tracts with higher poverty rates and larger shares of racial and ethnic minority residents, even after accounting for other contextual factors14. Two independent, more recent lines of evidence support this pathway. Hoffman, Shandas, and Pendleton compared land-surface-temperature data with historical federal redlining maps (Home Owners’ Loan Corporation grades) across 108 U.S. urban areas and found that formerly redlined neighborhoods were, on average, warmer than non-redlined neighborhoods within the same city6. Consistent with this, Nardone and colleagues found that formerly redlined neighborhoods retain substantially less green space today than neighborhoods that were not redlined, and Locke and colleagues found a parallel pattern in urban tree canopy coverage across 37 U.S. cities15,16. This pattern also holds at a national scale and is not limited to formerly redlined cities: Hsu and colleagues found that the average person of color, and the average resident living below the poverty line, experienced significantly higher surface urban heat island intensity than non-Hispanic white and higher-income residents, respectively, in nearly all of the 175 largest urbanized areas in the continental United States17. Together, this body of work supports the claim that some heat islands are not incidental but are a traceable legacy of a specific set of historical housing policy decisions.
It is worth noting, however, that this relationship is not without nuance, and more recent work complicates a purely historical account. Using ECOSTRESS thermal data for Los Angeles, Shreevastava and colleagues found that present-day income inequality was a stronger predictor of a neighborhood’s heat burden than its historical redlining grade, though the two are correlated, and neighborhoods that are both historically redlined and currently low-income remain the most exposed18. A national, longitudinal analysis points in a similar direction: Johnson found that between 2003 and 2018, census tracts with growing Black, Hispanic, or Asian population shares experienced statistically significant increases in surface urban heat island intensity, while tracts with growing white population shares saw surface urban heat island intensity decline on average, suggesting that in many U.S. cities this disparity has been widening rather than narrowing over time19. This suggests that while historical disinvestment set the initial conditions for many of today’s heat islands, ongoing, present-day economic inequality — not history alone — continues to actively reproduce and, in some cases, widen that exposure gap.
Operationalizing Environmental Justice Indicators
For the purposes of this study, environmental injustice associated with UHI exposure is treated as observable along at least four indicators reported in the literature above: (a) land-surface-temperature anomaly relative to a city’s regional baseline, (b) percentage of tree canopy or vegetated cover, (c) median household income, and (d) the racial and ethnic composition of a census tract or neighborhood, sometimes considered alongside its historical redlining grade where that data is available. This study did not independently measure any of these four indicators; it relied on the existing literature cited above to characterize what an “environmentally unjust” heat exposure looks like in general, and used that general pattern only to select a research population whose neighborhoods were broadly consistent with it (see Methods).
Risks and Health Implications
The health literature distinguishes between moderate and severe UHI exposure. Moderate exposure is difficult for residents or clinicians to distinguish from ordinary hot-weather discomfort, and typically becomes visible only through a satellite thermal scan, such as NASA’s ECOSTRESS instrument, which measures land surface temperature and related thermal features from the International Space Station4. Because such analysis is rarely commissioned for individual neighborhoods, moderate heat islands often go unrecognized until conditions worsen. Where a moderate heat island is identified early, cities have implemented low-cost interventions such as surface modification and targeted tree planting to prevent further intensification.
It is important to distinguish, as this paper does throughout, between three related but different measurements: land surface temperature (what a satellite measures), ambient air temperature at a pedestrian or canopy level (what a person actually experiences outdoors), and an individual’s realized heat exposure or “heat dose” (which depends on air temperature, humidity, time outdoors, access to cooling, and individual health status). A satellite-measured land-surface-temperature anomaly is a useful proxy for locating a heat island, but it is not, by itself, a measurement of a resident’s health risk10,20. Broader vulnerability frameworks make a related point: a resident’s realized risk during extreme heat depends jointly on exposure, the built environment, socioeconomic status, and neighborhood stability, not on temperature alone21, which has motivated calls to reduce urban heat vulnerability by connecting residents more directly to place-based interventions rather than treating heat purely as a meteorological hazard22.
Severe, long-established UHIs carry substantially higher stakes. Luber and McGeehin describe a narrowing window for intervention once a heat island becomes severe, after which the most vulnerable residents face measurably increased mortality during extreme heat events10. This mortality risk is not confined to the United States: a 2023 health-impact assessment of 93 European cities attributed more than four percent of summer deaths to the urban heat island effect, and estimated that increasing average urban tree cover to 30 percent could prevent roughly one-third of these deaths, underscoring both the scale of heat-attributable mortality and the plausibility of vegetation-based mitigation23. Semenza and colleagues, analyzing the 1995 Chicago heat wave, found that social isolation, limited access to air conditioning, and residence in dense, high-heat neighborhoods were associated with substantially elevated heat-wave mortality among vulnerable urban residents11; this finding speaks specifically to acute heat-wave mortality risk rather than to chronic disease causation, and is cited here only for that narrower claim. Chronic, day-to-day heat exposure, even outside of a heat wave, remains a meaningful physiological stressor for urban residents10.
Gap Analysis
The existing literature establishes, with reasonable consistency, that UHIs are geographically patterned in ways that track historical and present-day economic and racial inequality13,5,6,15,16, a pattern corroborated by additional income- and race-based analyses17,19,14. What this literature says comparatively little about is how residents living inside these mapped hot zones describe, in their own words, the day-to-day and health effects of that exposure, and how they and their community understand its causes. Chakraborty and Lee’s global method for characterizing urban heat extent5, together with the redlining-era studies above6,15,16 and the national-scale analyses above17,19,14, establish that the geographic pattern is real and well documented. This study’s contribution is more modest than an earlier draft implied: McIntyre and colleagues have already published a directly comparable, interview-based study of an environmental justice community in Chelsea and East Boston, Massachusetts, finding that residents possessed air conditioning but limited its use because of cost, and identifying a range of structural and financial barriers to staying cool24. This study does not, therefore, claim to be the first qualitative account of resident experience in a heat-affected community; its narrower, still-useful contribution is a small set of first-person accounts explicitly linked to the NASA-thermal-data and historical-redlining framing used in this paper, drawn from a different set of neighborhoods than those studied by McIntyre and colleagues. This leads to the study’s central research question: How do residents of a neighborhood identified in the literature as consistent with elevated urban heat describe the effects of that exposure on their health, finances, and daily life?
Methods
Research Design
This study used a qualitative, exploratory, single-group case-study design based on semi-structured interviews. It was not designed as, and does not claim to be, a comparative or quantitative study; no statistical hypothesis was tested, and no comparison group was interviewed. This is an important scope limitation, discussed further below.
Participants
Five adult residents (n = 5) participated in this pilot study. Participants were eligible if they were adults who had lived for an extended period in a neighborhood that publicly available NASA Landsat/MODIS land-surface-temperature layers, viewed informally by the research team alongside the redlining- and income-based indicators described above, appeared broadly consistent with an urban heat island. This cross-reference was an informal, exploratory screening step performed by the research team, not a formal or NASA-issued neighborhood designation, and no specific temperature-anomaly threshold, acquisition date, or spatial resolution was documented at the time; this is a limitation addressed further below. Participants were recruited through the personal networks of individuals connected to NASA community science programs, which introduces a risk of selection bias discussed in the Limitations section. Beyond length of residency, systematic demographic information (age, ethnicity, household income) was not collected from participants in this pilot; this is a gap the study did not anticipate and should be corrected in any follow-up work.
Instruments and Procedure
Interviews were conducted using a consistent, ten-question, semi-structured interview guide (Appendix B) and were recorded using a voice recorder application. Each interview lasted approximately 15–20 minutes, consistent with the time described to participants in the informed consent process (Appendix A). Recordings were transcribed for analysis. Interviews were done on the phone and in in-person settings.
Data Analysis
Given the small sample size, this study used an inductive, reflexive reading of the five interview transcripts rather than a formal, multi-coder thematic analysis. The researcher read all five transcripts multiple times and grouped recurring, similar responses into descriptive categories, reported in the Results section below with the number of participants (out of five) whose responses fit each category. This approach does not include a codebook, a second coder, a formal inter-rater reliability calculation, or a documented saturation criterion, and its themes should accordingly be read as a preliminary, descriptive organization of the data rather than a validated qualitative analysis. This is a limitation of the current pilot and is addressed further below.
Ethical Considerations
Written informed consent was obtained from all five participants prior to the interview (Appendix A), and all participants were debriefed afterward about the purpose of the study. Participants were told in advance that some questions might be emotionally difficult. No participant is identified by name in this manuscript; each is referred to by a randomly assigned letter (Participant A–E), consistent with the labeling used in Appendix C–G.
Results
Across the five interviews, five recurring patterns emerged. Representative quotations are included for each; frequencies are reported out of the five total participants (labeled A–E, consistent with Appendices C–G).
1. Initial shock and lack of prior awareness (5 of 5 participants). All five participants described surprise or concern on first learning of their neighborhood’s association with elevated heat, and none had previously heard the term “urban heat island.” Participant E said, “It was a complete shock because I had always assumed every neighborhood in the city was roughly the same temperature.” Participant B described the days afterward as “a complete blur as I started researching what urban heat islands are.”
2. Little or no formal government mitigation (2 of 5 confirmed no intervention; 2 of 5 uncertain; 1 of 5 received a partial intervention). Participants B and C stated directly that their neighborhoods had received no cool-roof or tree-planting program. Participants A and D said they did not know whether any intervention had occurred. Participant E was the only participant to report receiving an intervention, describing a nonprofit-run cool-roof installation. Because two of five participants were simply uncertain rather than confirming an absence of intervention, this study cannot conclude that a majority of the sampled neighborhoods received no mitigation; it can only report what these five participants knew and observed.
3. Delayed or absent formal communication (3 of 5 could estimate a timeframe, ranging from several months to about a year; 2 of 5 did not know). Where participants had received any formal communication about their neighborhood’s heat conditions, they described a delay on the order of several months to a year (Participants B, C, and E).
4. Reported heat-related health effects concentrated in older adults and children (4 of 5). Four participants described a heat-related health effect experienced by a specific family member: an elderly grandmother (Participant A), a young child (Participant B), a mother (Participant D), and a mother again (Participant E). These are self-reported, non-verified accounts and should be read as participants’ descriptions rather than confirmed clinical diagnoses.
5. Self-reported increase in utility costs (3 of 5). Participants B, C, and D specifically described higher electricity bills tied to increased air-conditioning use. These figures were not independently verified against utility records.
6. Attribution of cause, where officials explained it (3 of 5 had direct contact and could recall an explanation; 2 of 5 had no direct contact). Where participants had spoken directly with a community organizer or official, they recalled explanations centered on historical development patterns: minimal tree canopy, dark roofing materials, and a high density of impervious surface (Participants B, C, and E). Participant E recalled being told the cause was “the historical lack of green infrastructure investment and the legacy of industrial zoning nearby.”
7. Informal, community-level caregiving as a coping strategy (4 of 5). Four participants described checking on elderly neighbors or family members during hot periods as their primary way of managing the heat’s effects, rather than a household-level infrastructure change.
Discussion
The patterns above are broadly consistent with the literature reviewed earlier: residents in neighborhoods associated with elevated heat frequently had no advance knowledge of that designation, described a slow or absent formal response, and reported health effects concentrated among the household members with the least physiological reserve to tolerate heat — older adults and young children. This is consistent with the social determinants of health framing introduced earlier: the conditions residents described (housing stock, neighborhood investment, and the built environment) shaped their heat exposure well before any individual behavior did.
At the same time, these findings should not be over-read. With five participants recruited through personal networks, this study cannot distinguish whether the patterns above are common across similar neighborhoods or specific to this small, non-random group. The study also did not interview any residents of a matched, non-heat-island or higher-income neighborhood, so it cannot make a direct comparative claim between “low-income” and “affluent” residents, only a within-group description of the five participants interviewed.
The literature is not unanimous on how much of today’s heat exposure traces to historical policy versus present-day economic conditions. As noted in the Literature Review, Shreevastava and colleagues found that in Los Angeles, present-day income inequality now predicts heat exposure better than a neighborhood’s historical redlining grade alone18. This pilot’s small sample cannot adjudicate between these explanations, but it is worth flagging that participants themselves, where they had spoken with officials, most often cited historical development patterns rather than current income levels, which may reflect what officials chose to emphasize rather than the full causal picture.
Two claims in earlier drafts of this study warrant explicit correction. First, this study did not conclude that urban heat islands cause a decline in “generational health” — that is a claim requiring longitudinal health data this pilot did not collect, and it has been removed. What the data support is a narrower claim: participants perceive a compounding risk to older and younger family members under current conditions, and some worry about that risk continuing if conditions do not change. Second, participants’ accounts of thermal exposure, indoor confinement, and reduced social interaction during the most severe part of summer (reported above under pattern 4 and pattern 7) are reported here as Results, not introduced for the first time as new examples in this Discussion section, consistent with keeping interpretation and evidence separate.
Policy and Planning Implications
Although this pilot’s findings are not generalizable, they are consistent with several policy directions already supported by the broader literature reviewed above. For urban planners, the redlining-era tree-canopy literature6,15,16 suggests that equity-weighted green-infrastructure budgets — explicitly prioritizing historically under-invested tracts rather than allocating tree-planting funds city-wide on a per-capita basis — would target investment where the thermal gap is largest. This kind of investment requires sustained political commitment: green-infrastructure programs typically demand substantial upfront costs that are less readily mobilized in lower-income communities, where the return on investment is less visible to policymakers25, even though modeling of climate-adaptation strategies in several US cities suggests that such investments can avert heat-related deaths in ways that offset their implementation costs over time26. For local government, the delayed-communication pattern reported by this study’s participants suggests a concrete, low-cost step: routinely publishing neighborhood-level heat advisories drawn from existing satellite thermal layers, rather than relying on ad hoc outreach. For public health and social service agencies, the concentration of reported harm among older adults and children suggests that utility-assistance and cooling-center outreach during heat events should be targeted specifically at households with these residents, rather than distributed uniformly. This targeting concern is reinforced by a national analysis of cooling-center placement across 81 US cities, which found that although cooling centers were disproportionately sited in areas of higher social vulnerability, they were on average less accessible to adults aged 65 and older than to the general population — meaning that proximity to a cooling center does not by itself guarantee that the residents most physiologically vulnerable to heat are actually being reached27.
Recommendations
Based on the discussion above, this study recommends:8 equity-weighted green infrastructure and cool-roof investment prioritizing historically redlined and currently low-income tracts;12 routine, proactive publication of neighborhood-level heat data by municipal governments rather than reactive, ad hoc communication; and9 targeted utility assistance and outreach during heat events for households with older adults or young children. These recommendations are drawn from the broader literature cited above and are consistent with, but not proven by, this pilot’s five interviews.
Limitations
This study has substantial limitations that qualify every claim above. The sample size (n = 5) is small, and participants were recruited through personal networks rather than a random or stratified sampling method, introducing meaningful selection bias. No matched comparison group (non-heat-island or higher-income residents) was interviewed, so no between-group claim can be supported. Beyond length of residency, demographic data on participants were not systematically collected. Neighborhood classification as an urban heat island relied on an informal cross-reference to publicly available NASA thermal layers rather than a documented, reproducible methodology with a specified product, acquisition date, spatial resolution, and anomaly threshold; this should be corrected in future work. All findings rely on self-reported interview data; no independent temperature, health, or utility-billing records were collected or reviewed, and no statistical analysis was performed. Data analysis consisted of a single researcher’s reflexive reading of transcripts, without a codebook, second coder, formal inter-rater reliability check, or documented saturation criterion. The study is cross-sectional, capturing a single point in time. Finally, several claims in earlier drafts of this manuscript extended existing citations beyond what those sources directly supported; this revision narrows those claims to what the cited sources establish, but a full line-by-line audit against original source texts was outside the scope of this pilot revision and is recommended before any further submission.
Conclusions
Within the boundaries of this small, exploratory pilot study, the five interviewed residents described a consistent set of experiences: an initial lack of awareness of their neighborhood’s heat exposure, limited formal government response, self-reported utility cost increases, and health effects concentrated among older adults and children. These experiences are consistent with, and add first-person texture to, the broader literature connecting historical disinvestment to present-day thermal inequity. Because of the study’s small, non-random sample, these findings should not be generalized beyond the five participants interviewed; they should instead be read as a preliminary basis for a larger, longitudinal, mixed-methods study.
Future Directions
A logical next step is a multi-city, longitudinal, mixed-methods study that8 recruits a larger sample using random, stratified, or purposive sampling rather than personal networks;12 includes a matched comparison group of residents from non-heat-island or higher-income neighborhoods;9 pairs interview data with objective land-surface-temperature, air-temperature, demographic, and health-outcome data; and13 re-interviews the same participants at intervals of several months to track whether mitigation efforts, if implemented, produce measurable improvement over time.
Closing Thought
Urban heat islands are not simply a meteorological inconvenience; the literature reviewed here indicates that many are a traceable legacy of specific housing and investment decisions. This pilot study’s five interviews suggest that residents living inside these zones experience that legacy as a lived, ongoing burden on their health and household finances, even where the exact causal weight of history versus present-day conditions remains an open empirical question.
Appendix A: Informed Consent Form
“Urban Heat Island Effects and Environmental Justice”
PURPOSE OF STUDY: The purpose of this study is to understand how health outcomes and quality of life are impacted by urban heat island conditions among residents of affected communities.
STUDY PROCEDURES: If you agree to take part in this study, you will be asked to be interviewed about how your daily life has been impacted by living in an urban heat island zone, and how your community’s conditions have changed over time. This interview will ask about community health conditions, daily routine changes, and your experience of heat in your neighborhood. The process will take approximately 15–20 minutes to complete. With your permission, this interview will be audio recorded.
RISKS: There is the risk that some questions may cause emotional discomfort.
BENEFITS: There will be no direct benefit to you for your participation in this study. However, the information obtained from this study will allow for a deeper understanding of how urban heat islands impact community health and quality of life in affected neighborhoods.
CONFIDENTIALITY: Your responses to this interview will be anonymous.
VOLUNTARY PARTICIPATION: Your participation in this study is voluntary. You are free to withdraw at any time and without giving a reason.
Appendix B: Interview Questions
- What was the immediate impact after you found out that your neighborhood had been identified as an urban heat island by NASA satellite data?
- How were the next few days after you learned about your community’s designation as an urban heat island zone?
- When community organizations or local officials discussed the different mitigation options with you, did your community end up receiving cool roof installation or an urban tree planting program?
- In what aspects did your daily routines and household habits change with your community now being identified as severely affected by an urban heat island?
- How were you and your household most impacted by the urban heat island conditions in your neighborhood?
- At the time when you first noticed the extreme heat conditions in your neighborhood, did your community know that there was an urban heat island designation, or did the heat impacts feel sudden and unexplained?
- Approximately how long did it take for your community to receive any formal communication or support from local government or community organizations regarding the urban heat island conditions?
- To the best of your ability, recall what community leaders or health officials said when they were explaining your neighborhood’s heat conditions and what was happening.
- What did community officials claim to be the biggest reason for the intensity of the urban heat island in your neighborhood?
- How do you plan on mitigating the effects of the urban heat island in your household and for the rest of your daily life?
Appendix C: Participant A’s Responses
- I was really surprised, and I didn’t fully understand what it meant at first.
- It was very stressful, and I was very worried about what this meant for my family’s health.
- I don’t know.
- My family stopped going outside during the afternoons in the summer and we started keeping the air conditioning on all day.
- My grandmother had a heat-related health episode and had to stay inside for weeks.
- It was all of a sudden. We just knew it was always hotter in our neighborhood.
- I don’t know.
- I’m not sure. I didn’t speak with the officials directly.
- I don’t know.
- By keeping my grandmother indoors during the hottest hours and using fans.
Appendix D: Participant B’s Responses
- It was a really big shock for me.
- The next few days were a complete blur as I started researching what urban heat islands are and what this meant for my family.
- We did not receive any formal intervention. No cool roofs or tree planting programs were offered to us.
- My family started keeping the windows shut during peak afternoon hours and we had to buy additional fans.
- Our electricity bills went up significantly because we were running air conditioning so much more. My youngest child also had a heat-related illness episode during one of the worst heat waves.
- We did not know anything formal about it. We always knew our neighborhood felt hotter than other parts of the city, but we didn’t know it had a scientific name or that it was documented by NASA.
- It took approximately several months before we heard anything from any local official, and even then it was informal.
- They were explaining that there was essentially a buildup of heat-absorbing surfaces in our neighborhood.
- The official said that the biggest reason was the historical development pattern of the neighborhood, with very few trees and a lot of impervious surfaces.
- We plan to mitigate these effects by planting some trees in our yard and constantly checking on our elderly neighbors during the summer months.
Appendix E: Participant C’s Responses
- It was just overall a really scary experience for me.
- The next few days were quite scary as I was very nervous about my children’s health.
- We were not offered any formal intervention. No cool roofs or tree planting were provided.
- My elderly mother-in-law was severely affected and could not go outside comfortably.
- Our household was most affected through increased energy bills and the inability to use our outdoor space comfortably during the summer.
- We did not know of any formal designation. We just always felt that our street was much hotter than others.
- It took somewhere between several months and a full year before we heard anything official.
- The community organizer was explaining to us how the lack of trees and the prevalence of dark rooftops in our neighborhood caused heat to accumulate.
- They said that it was the historical development of the neighborhood with minimal green space and maximum pavement.
- We plan on mitigating these effects through advocating for tree planting in our neighborhood.
Appendix F: Participant D’s Responses
- I was very concerned, and I didn’t fully understand what a heat island meant.
- It was very worrying, and I kept thinking about how much hotter our neighborhood is compared to the neighborhoods near the park.
- I don’t know.
- My family started keeping all the blinds closed and we stopped letting the kids play outside after noon during the summer.
- Our electricity bills got really high and my mom got sick with heat exhaustion once during a bad heat wave.
- I don’t know exactly. We just always noticed it was much hotter in our block.
- I don’t know.
- I don’t know. I didn’t speak with any officials directly.
- I don’t know.
- I call my elderly neighbors and check on them when it gets really hot outside.
Appendix G: Participant E’s Responses
- It was a complete shock because I had always assumed every neighborhood in the city was roughly the same temperature.
- It was a very scary experience. I was with my family, and we were very worried about what this meant for the safety of our elderly parents who live with us.
- We chose to pursue cool roofing through a nonprofit program that came to our area.
- My family started adjusting our entire summer schedule. My husband took time off work to stay home with our parents during the hottest weeks of the summer.
- My mother lost the ability to go outside in the afternoons comfortably.
- It was all of a sudden in terms of the formal designation. We didn’t know our neighborhood had been classified as a heat island through satellite data.
- It took around several months to a year before we were formally contacted by any organization with resources.
- They were explaining how the combination of old dark rooftops, minimal tree canopy, and the density of pavement in our neighborhood caused temperatures to remain much higher than surrounding areas.
- They said that in the case of our neighborhood, it was likely the historical lack of green infrastructure investment and the legacy of industrial zoning nearby.
- We plan on mitigating the effects by continuing our cool roof installation and visiting our parents and neighbors every single week to ensure that they are safe and healthy during the summer months.
References
- D. Schlosberg. Defining environmental justice: Theories, movements, and nature. Oxford University Press, 2007. [↩] [↩] [↩]
- B. C. Mitchell, J. Chakraborty. Exploring the relationship between residential segregation and thermal inequity in Phoenix, Arizona. Landscape and Urban Planning. Vol. 178, pg. 47–57, 2018, https://doi.org/10.1016/j.landurbplan.2018.05.023. [↩]
- World Health Organization. Social determinants of health. WHO. https://www.who.int/news-room/fact-sheets/detail/social-determinants-of-health, 2022. [↩] [↩]
- NASA Jet Propulsion Laboratory. ECOSTRESS: ECOsystem spaceborne thermal radiometer experiment on space station. NASA. https://ecostress.jpl.nasa.gov, 2020. [↩] [↩]
- T. Chakraborty, X. Lee. A simplified urban-extent algorithm to characterize surface urban heat islands on a global scale and examine vegetation control on their spatiotemporal variability. International Journal of Applied Earth Observation and Geoinformation. Vol. 74, pg. 269–280, 2019, https://doi.org/10.1016/j.jag.2018.09.016. [↩] [↩] [↩] [↩]
- J. S. Hoffman, V. Shandas, N. Pendleton. The effects of historical housing policies on resident exposure to intra-urban heat: A study of 108 US urban areas. Climate. Vol. 8, pg. 12, 2020, https://doi.org/10.3390/cli8010012. [↩] [↩] [↩] [↩] [↩]
- H. E. Landsberg. The urban climate. Academic Press, 1981. [↩]
- T. R. Oke, G. Mills, A. Christen, J. A. Voogt. Urban climates. Cambridge University Press, 2017. [↩] [↩] [↩] [↩]
- C. Heaviside, H. Macintyre, S. Vardoulakis. The urban heat island: Implications for health in a changing environment. Current Environmental Health Reports. Vol. 4, pg. 296–305, 2017, https://doi.org/10.1007/s40572-017-0150-3. [↩] [↩] [↩] [↩]
- G. Luber, M. McGeehin. Climate change and extreme heat events. American Journal of Preventive Medicine. Vol. 35, pg. 429–435, 2008, https://doi.org/10.1016/j.amepre.2008.08.021. [↩] [↩] [↩] [↩]
- J. C. Semenza, C. H. Rubin, K. H. Falter, J. D. Selanikio, W. D. Flanders, H. L. Howe, J. L. Wilhelm. Heat-related deaths during the July 1995 heat wave in Chicago. New England Journal of Medicine. Vol. 335, pg. 84–90, 1996, https://doi.org/10.1056/NEJM199607113350203. [↩] [↩]
- F. Estrada, W. J. W. Botzen, R. S. J. Tol. A global economic assessment of city policies to reduce climate change impacts. Nature Climate Change. Vol. 7, pg. 403–406, 2017, https://doi.org/10.1038/nclimate3301. [↩] [↩] [↩]
- S. L. Harlan, A. J. Brazel, L. Prashad, W. L. Stefanov, L. Larsen. Neighborhood microclimates and vulnerability to heat stress. Social Science & Medicine. Vol. 63, pg. 2847–2863, 2006, https://doi.org/10.1016/j.socscimed.2006.07.030. [↩] [↩] [↩]
- B. C. Mitchell, J. Chakraborty. Urban heat and climate justice: A landscape of thermal inequity in Pinellas County, Florida. Geographical Review. Vol. 104, pg. 459–480, 2014, https://doi.org/10.1111/j.1931-0846.2014.12039.x. [↩] [↩] [↩]
- A. Nardone, K. E. Rudolph, R. Morello-Frosch, J. A. Casey. Redlines and greenspace: The relationship between historical redlining and 2010 greenspace across the United States. Environmental Health Perspectives. Vol. 129, pg. 017006, 2021, https://doi.org/10.1289/EHP7495. [↩] [↩] [↩] [↩]
- D. H. Locke, B. Hall, J. M. Grove, S. T. A. Pickett, L. A. Ogden, C. Aoki, C. G. Boone, J. P. M. O’Neil-Dunne. Residential housing segregation and urban tree canopy in 37 US cities. npj Urban Sustainability. Vol. 1, pg. 15, 2021, https://doi.org/10.1038/s42949-021-00022-0. [↩] [↩] [↩] [↩]
- A. Hsu, G. Sheriff, T. Chakraborty, D. Manya. Disproportionate exposure to urban heat island intensity across major US cities. Nature Communications. Vol. 12, pg. 2721, 2021, https://doi.org/10.1038/s41467-021-22799-5. [↩] [↩] [↩]
- A. Shreevastava, G. Hulley, S. Prasanth, T. Chakraborty, D. Ramos Aguilera, K. T. Sanders, Y. Yin. Contemporary income inequality outweighs historic redlining in shaping intra-urban heat disparities in Los Angeles. Nature Communications. Vol. 16, pg. 4950, 2025, https://doi.org/10.1038/s41467-025-59912-x. [↩] [↩]
- D. P. Johnson. Population-based disparities in U.S. urban heat exposure from 2003 to 2018. International Journal of Environmental Research and Public Health. Vol. 19, pg. 12314, 2022, https://doi.org/10.3390/ijerph191912314. [↩] [↩] [↩]
- D. P. Johnson, J. S. Wilson, G. C. Luber. Socioeconomic indicators of heat-related health risk supplemented with remotely sensed data. International Journal of Health Geographics. Vol. 8, pg. 57, 2009, https://doi.org/10.1186/1476-072X-8-57. [↩]
- C. K. Uejio, O. V. Wilhelmi, J. S. Golden, D. M. Mills, S. P. Gulino, J. P. Singleton. Intra-urban societal vulnerability to extreme heat: The role of heat exposure and the built environment, socioeconomics, and neighborhood stability. Health & Place. Vol. 17, pg. 498–507, 2011, https://doi.org/10.1016/j.healthplace.2010.12.005. [↩]
- O. V. Wilhelmi, M. H. Hayden. Connecting people and place: A new framework for reducing urban vulnerability to extreme heat. Environmental Health Perspectives. Vol. 118, pg. 1627–1630, 2010, https://doi.org/10.1289/ehp.1002194. [↩]
- T. Iungman, M. Cirach, F. Marando, E. Pereira Barboza, S. Khomenko, P. Masselot, M. Quijal-Zamorano, N. Mueller, A. Gasparrini, J. Urquiza, M. Heris, M. Thondoo, M. Nieuwenhuijsen. Cooling cities through urban green infrastructure: A health impact assessment of European cities. The Lancet. Vol. 401, pg. 577–589, 2023, https://doi.org/10.1016/S0140-6736(22)02585-5. [↩]
- A. M. McIntyre, M. K. Scammell, M. P. Botana Martinez, L. Heidari, A. Negassa, R. Bongiovanni, M. P. Fabian. Facilitators and barriers for keeping cool in an urban heat island: Perspectives from residents of an environmental justice community. Environmental Justice. Vol. 16, pg. 410–417, 2023, https://doi.org/10.1089/env.2022.0019. [↩]
- N. R. Sampson, C. J. Gronlund, M. A. Buxton, L. Catalano, J. L. White-Newsome, K. C. Conlon, M. S. O’Neill. Staying cool in a changing climate: Reaching vulnerable populations during heat events. Global Health Action. Vol. 6, pg. 21122, 2013, https://doi.org/10.3402/gha.v6i0.21122. [↩]
- B. Stone, J. Vargo, P. Liu, D. Habeeb, A. DeLucia, M. Trail, A. Russell. Avoided heat-related mortality through climate adaptation strategies in three US cities. PLOS ONE. Vol. 9, pg. e100852, 2014, https://doi.org/10.1371/journal.pone.0100852. [↩]
- Q. H. Adams, E. M. G. Chan, K. R. Spangler, K. R. Weinberger, K. J. Lane, N. A. Errett, J. J. Hess, Y. Sun, G. A. Wellenius, A. Nori-Sarma. Examining the optimal placement of cooling centers to serve populations at high risk of extreme heat exposure in 81 US cities. Public Health Reports. Vol. 138, pg. 955–962, 2023, https://doi.org/10.1177/00333549221148174. [↩]