
Abstract
Alzheimer’s disease (AD) is a progressive neurodegenerative disorder, for which there are few effective therapies. In this work, we computationally identified potential drug candidates for AD from publicly available gene expression datasets. First, we analyzed the RNA sequencing dataset GSE261050 to identify the differentially expressed genes (DEGs) between AD and control samples. Then we performed pathway enrichment analysis and found that many of the changed genes were related to neurodegeneration, MAPK signaling and cellular stress responses. Next, we performed a drug repurposing approach using the L1000CDS2 database to identify compounds that could reverse the AD gene expression signature. Several candidate drugs were identified such as transcriptional regulators like histone deacetylase (HDAC) and cyclin dependent kinase (CDK) inhibitors. We validated our results in an independent data set (GSE33000), pathway enrichment and predicted drug candidate comparisons. Both datasets predicted drugs that are HDAC inhibitors, but statistical testing did not indicate that HDAC inhibitors are significantly enriched, indicating a weaker but consistent signal. Together, our results demonstrate that AD is associated with consistent changes in important biological pathways and that transcriptomic analysis can be used to identify possible therapeutic interventions. These results indicate that transcriptional regulation may be worth further studying, and suggest that multiple transcriptomic signals are reproducible between independent datasets. All predictions are in silico and need experimental validation for therapeutic relevance.
Keywords: Alzheimer’s disease, Transcriptomic analysis, Differential gene expression, Drug repurposing, Pathway enrichment
Introduction
Alzheimer’s disease (AD) is a progressive neurodegenerative disorder that primarily impairs memory, thinking and behavior. It is the leading cause of dementia and affects millions of people worldwide today. With an aging world population, the number of people living with Alzheimer’s disease is expected to rise substantially, constituting an increasing public health challenge1. Despite decades of research, there are no effective treatments that can slow or stop disease progression.
Biologically, Alzheimer’s disease is characterized by a number of key features, including the accumulation of amyloid-beta plaques, tau protein tangles and widespread neuronal damage. But recent studies suggest that these factors alone do not tell the whole story of the complexity of the disease. Alzheimer’s disease is characterized by changes in several biological pathways, including inflammation, oxidative stress and disruption of cellular signaling2,3. Recent large-scale transcriptomic studies have shown that Alzheimer’s disease is associated with coordinated alterations of neuronal, immune and metabolic pathways across multiple brain regions. Transcriptomic approaches have previously been shown to reveal disease-associated molecular networks not detectable by single gene analysis, as exemplified in projects such as the Accelerating Medicines Partnership–Alzheimer’s Disease (AMP-AD) consortium and analysis of the Religious Orders Study and Memory and Aging Project (ROSMAP) cohorts. These studies suggest that Alzheimer’s disease is a result of complex interactions between multiple biological systems, rather than a disruption of a single molecular target4,5,6,7,8. This complexity makes it hard to identify effective treatments using traditional one-target-at-a-time approaches.
One of the important challenges in transcriptomic studies is whether disease signatures obtained in one study can be reproduced in independent datasets and experimental platforms. Changes in sample composition, sequencing platforms and analysis methods can affect gene expression results. Hence, validation in independent cohorts is critical in differentiating robust biological signals from dataset-specific observations. Evaluating reproducibility may also bolster confidence in computational drug-repurposing approaches that rely on transcriptomic signatures5,6,7,8.
Transcriptome analysis (genome-wide gene expression profiling) is a promising approach for studying complex diseases such as Alzheimer’s. Researchers compare gene expression of diseased versus healthy samples to identify genes and pathways that are altered in the diseased state9. It may give a more global picture of disease mechanisms and help identify novel therapeutic targets.
Moreover, drug repurposing has become a promising approach for identifying potential drugs. Instead of discovering new drugs from scratch, drug repurposing identifies existing compounds that can reverse the changes in gene expression associated with disease5. The technique could speed up and cut the cost of drug development dramatically.
This study aimed to assess the reproducibility of transcriptomic disease signatures and computational drug-repurposing predictions across independent Alzheimer’s disease datasets. Differential expression analysis, pathway enrichment, and computational drug-repurposing approaches were conducted on an RNA-seq dataset (GSE261050) and key findings were validated on an independent microarray dataset (GSE33000). In this study, we used the comparison of pathway-level and drug-level results across platforms to assess the stability of transcriptomic signals that may be relevant for future therapeutic investigation7,8,9,10.
Methods
Data Collection
Gene-expression datasets available in the public Gene Expression Omnibus (GEO) database were used. The primary dataset, GSE261050, includes postmortem bulk RNA sequencing data from two brain regions, the anterior cingulate cortex (BA32) and insula, from donors with a spectrum of Alzheimer’s disease neuropathology11. For the differential-expression analysis in the present study, only samples annotated as Alzheimer’s disease (AD) or control were used. The dataset consisted of 101 samples from 60 donors, including 76 AD samples and 25 control samples. Demographic and clinical characteristics are summarized in Table 1. The available metadata included age, sex, post-mortem interval (PMI), RNA integrity number (RIN), brain region, sequencing batch, and extraction batch. During the analysis workflow, information at the donor level and brain-region annotation was kept.
| Variable | AD | Control |
| Samples | 76 | 25 |
| Unique donors | 44 | 16 |
| Female | 42 | 7 |
| Male | 34 | 18 |
| Mean age (years) | 81.1 | 75.2 |
| Mean PMI (hours) | 16.5 | 21.5 |
| Mean RIN | 4.75 | 5.58 |
| Brain regions | BA32, Insula | BA32, Insula |
For validation, we used the GSE33000 dataset, which contains microarray expression profiles from AD, Huntington’s disease (HD), and control samples. Only AD and control samples were used for validation of Alzheimer’s disease findings12. HD samples were analyzed separately as an exploratory comparison and were not included in the primary validation analyses.
Differential Expression Analysis
Differential gene expression analysis of the primary dataset (GSE261050) was performed by DESeq2 package in R13. A DESeq2 design formula of ~ condition was used, indicating that disease status (AD vs control) was the main variable included in the model. Genes were considered as significantly differentially expressed when adjusted p-value was <0.05 and absolute log2 fold change >1. Results were presented as volcano plots. The analysis was conducted to detect broad transcriptomic differences between AD and control samples. Although there was metadata available for age, sex, brain region, PMI, RIN and batch information, these were not included in the main statistical model. Therefore, they are potential confounding sources.
Pathway Enrichment Analysis
We conducted pathway enrichment analysis based on the KEGG (Kyoto Encyclopedia of Genes and Genomes) database to investigate the biological significance of the differentially expressed genes. Enrichment analysis identifies biological pathways that are overrepresented in the gene list compared to what would be expected by chance14. We focused on the highest ranked pathways based on adjusted p-values.
Drug Repurposing Analysis
We used the L1000CDS2 platform to identify candidate drugs that may reverse the Alzheimer’s disease gene expression signature. This method compares the input gene list with a database of drug-induced gene expression profiles and identifies compounds that produce opposite expression patterns15,16. The top predicted drugs were ranked based on their similarity scores.
Validation Using Independent Dataset
We also conducted analysis of pathways and drug repurposing on the GSE33000 dataset to assess the reproducibility of our findings. Samples in GSE33000 represent several neurodegenerative disorders, and as such, validation analysis were restricted to AD and control samples. Huntington’s disease samples were analyzed separately as an exploratory comparison where we wanted to see if similar transcriptomic drug-repurposing signals could be seen in another neurodegenerative disorder. AD-specific findings were not confirmed in HD samples. The purpose of the validation analysis was to assess cross-platform reproducibility instead of replication of differential-expression results, since GSE261050 dataset is RNA-seq dataset and GSE33000 dataset is microarray dataset.
Statistical Analysis
Differential-expression significance was determined using Benjamini-Hochberg false-discovery-rate correction as implemented in DESeq2 and limma17. Pathway-enrichment analysis were ranked according to adjusted p-values. Enrichment analysis used multiple-testing-adjusted p-values provided by the enrichment platform outputs. Candidate compounds identified through L1000CDS2 were ranked according to similarity scores generated by the platform. Fisher’s exact test was used to assess whether classes of drugs like histone deacetylase (HDAC) inhibitors were overrepresented in the top-ranked compounds. Statistical significance was defined as p < 0.05.
Data and Code Availability
All datasets used in this study are publicly available from the Gene Expression Omnibus (GEO). The analysis scripts used for data processing, pathway enrichment, drug repurposing, and figure generation are available on GitHub at GitHub repository.
Results
Differential Gene Expression in Alzheimer’s Disease
We first examined gene expression changes in Alzheimer’s disease (AD) samples versus healthy controls using the GSE261050 dataset. The volcano plot (Figure 1) indicates many genes with significant changes in expression. In addition, a large number of genes were strongly upregulated/downregulated in AD indicating a general dysregulation of transcription. These results confirm that Alzheimer’s disease is linked to major changes in gene activity across the genome.
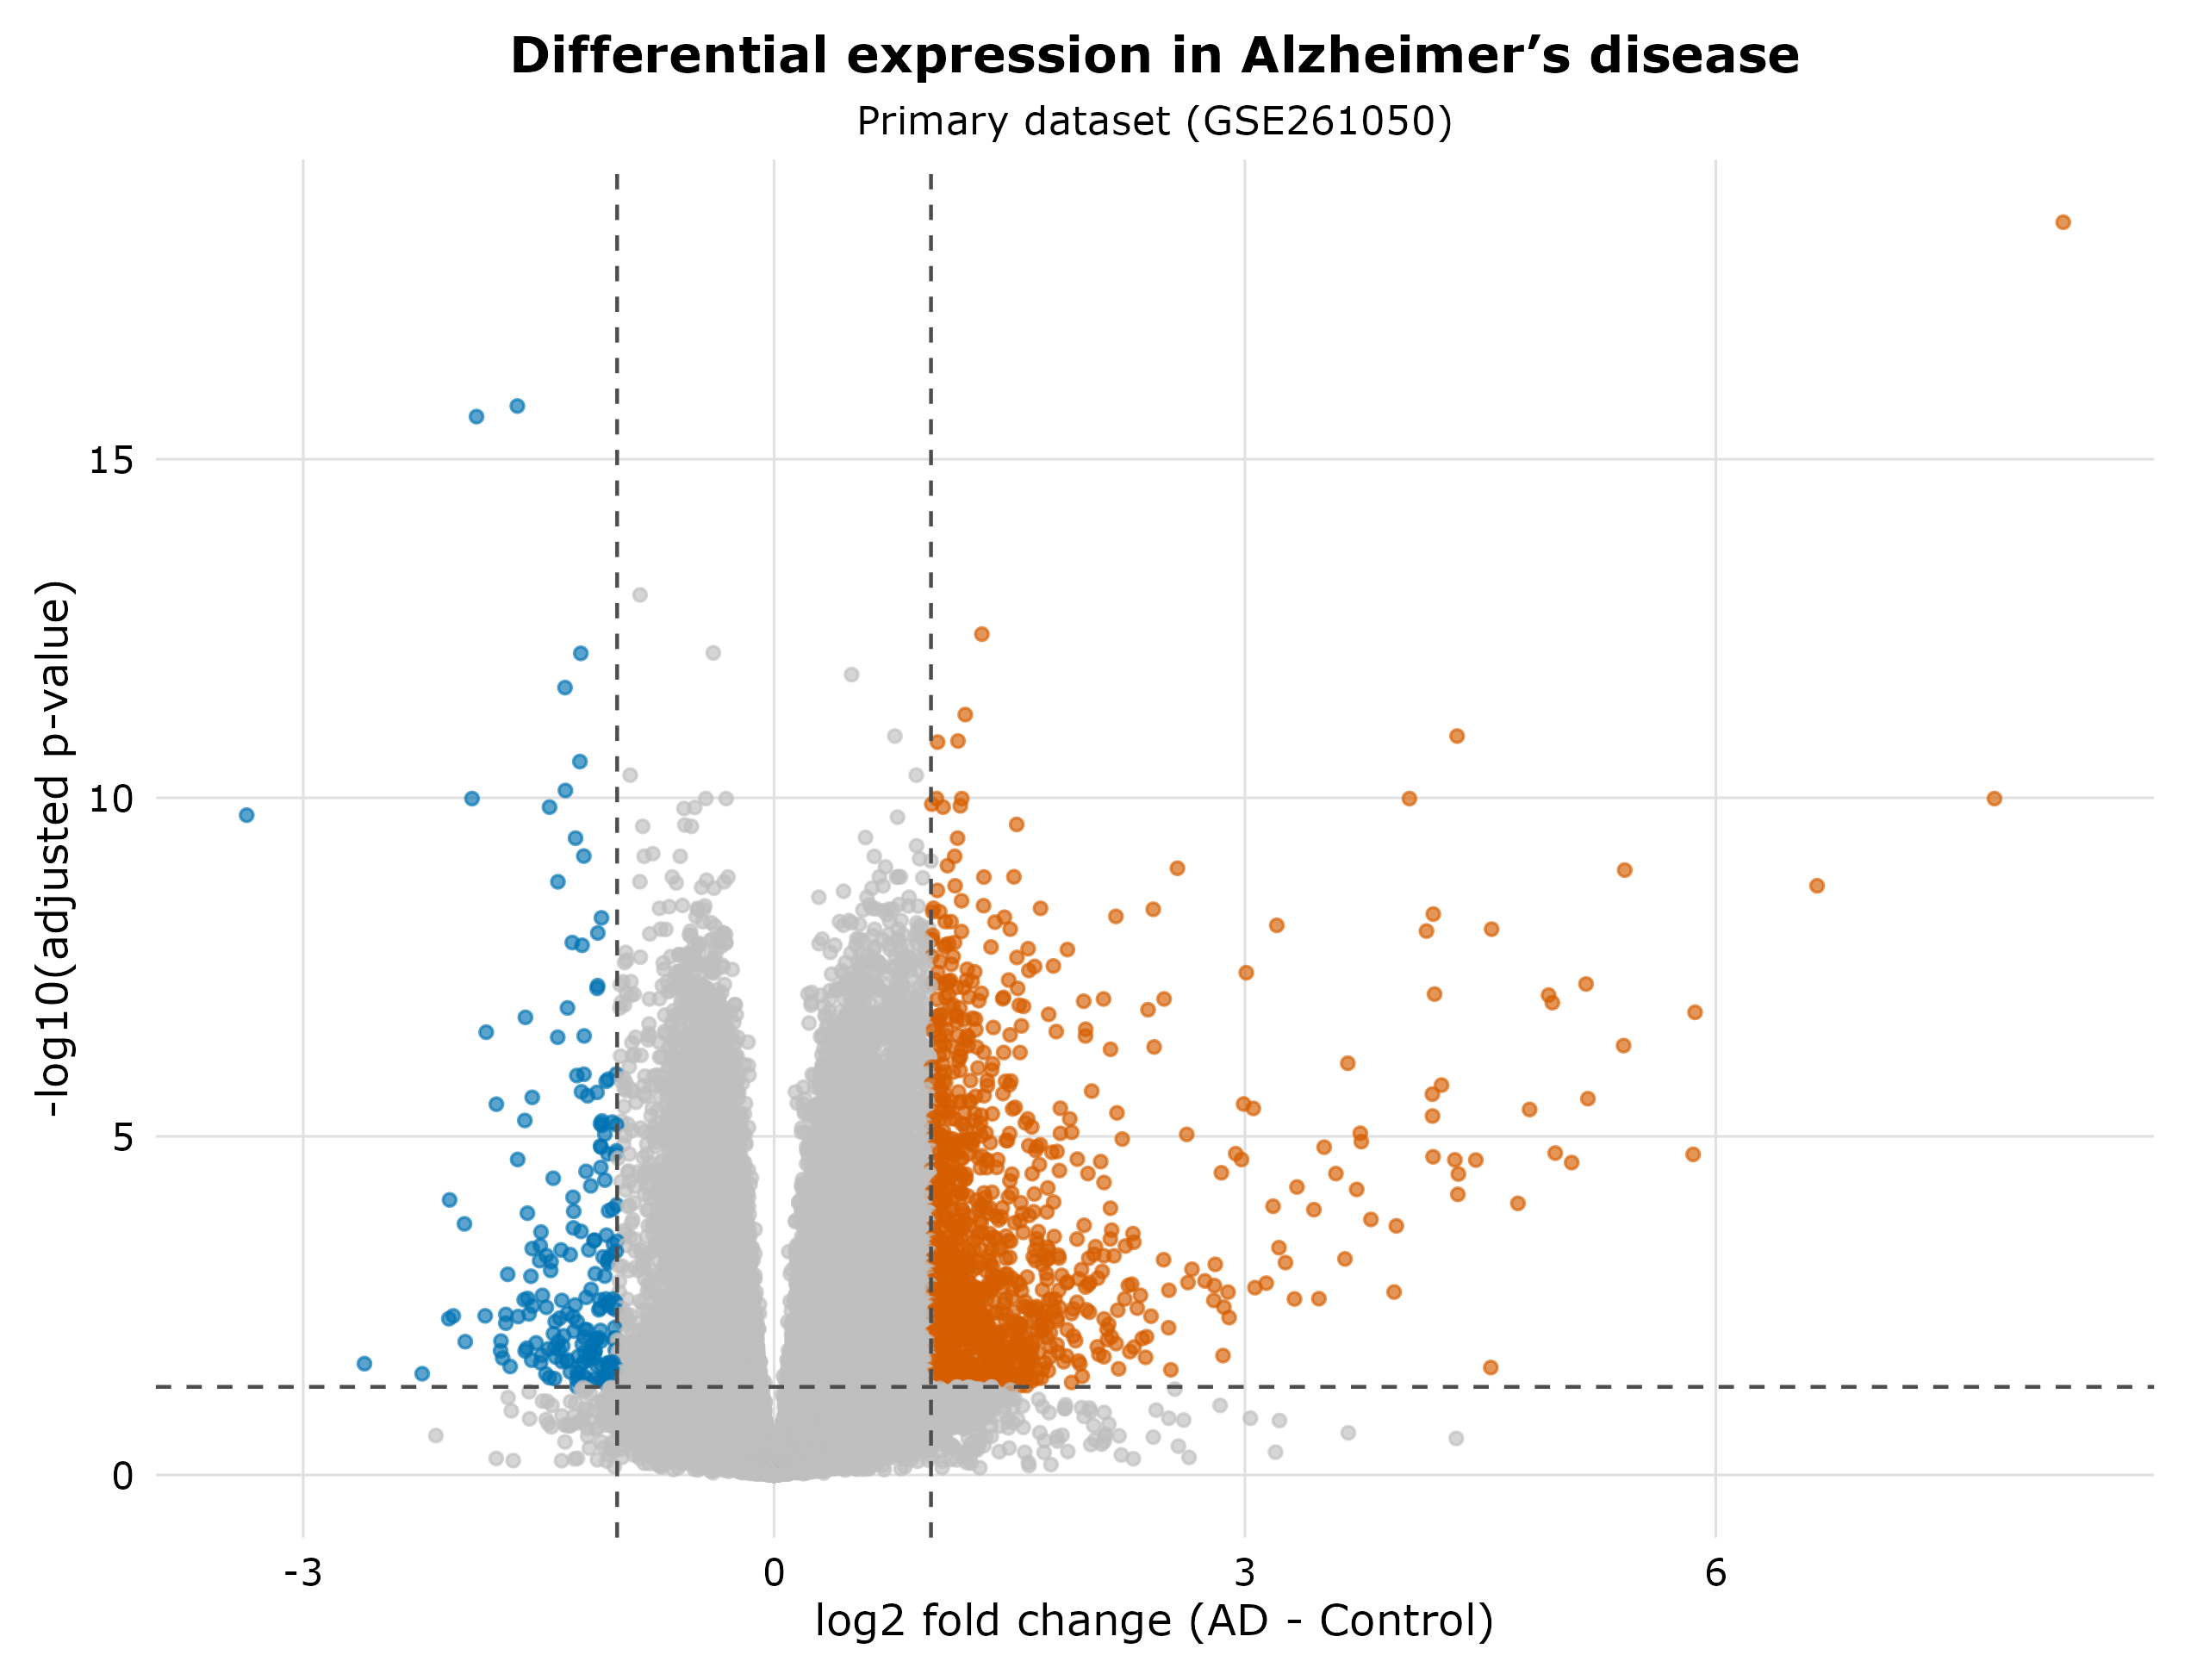
This volcano plot shows genes that are significantly up- or down-regulated in Alzheimer’s disease compared to control samples. Each dot is a gene, the x-axis is the log2 fold change, and the y-axis is the statistical significance (−log10 adjusted p-value). Red points represent upregulated genes, blue points represent downregulated genes, and gray points represent genes that are not significantly changed. Results show widespread gene expression changes in AD.
Pathways Enrichment
KEGG pathway enrichment analysis was performed to further investigate the biological function of the DEGs. The results (Figure 2) showed a significant enrichment of several pathways associated with neurodegeneration. These included pathways in Alzheimer’s disease, Parkinson’s disease, Huntington’s disease, MAPK signaling and cellular stress responses. These pathways suggest that the observed gene expression changes are biologically meaningful and generally consistent with known mechanisms of neurodegeneration. However, some enriched KEGG pathways share common mitochondrial, inflammatory and stress-response genes. Thus, co-occurrence of pathways should not be interpreted as independent biological validation, but rather as a hint for related molecular processes.
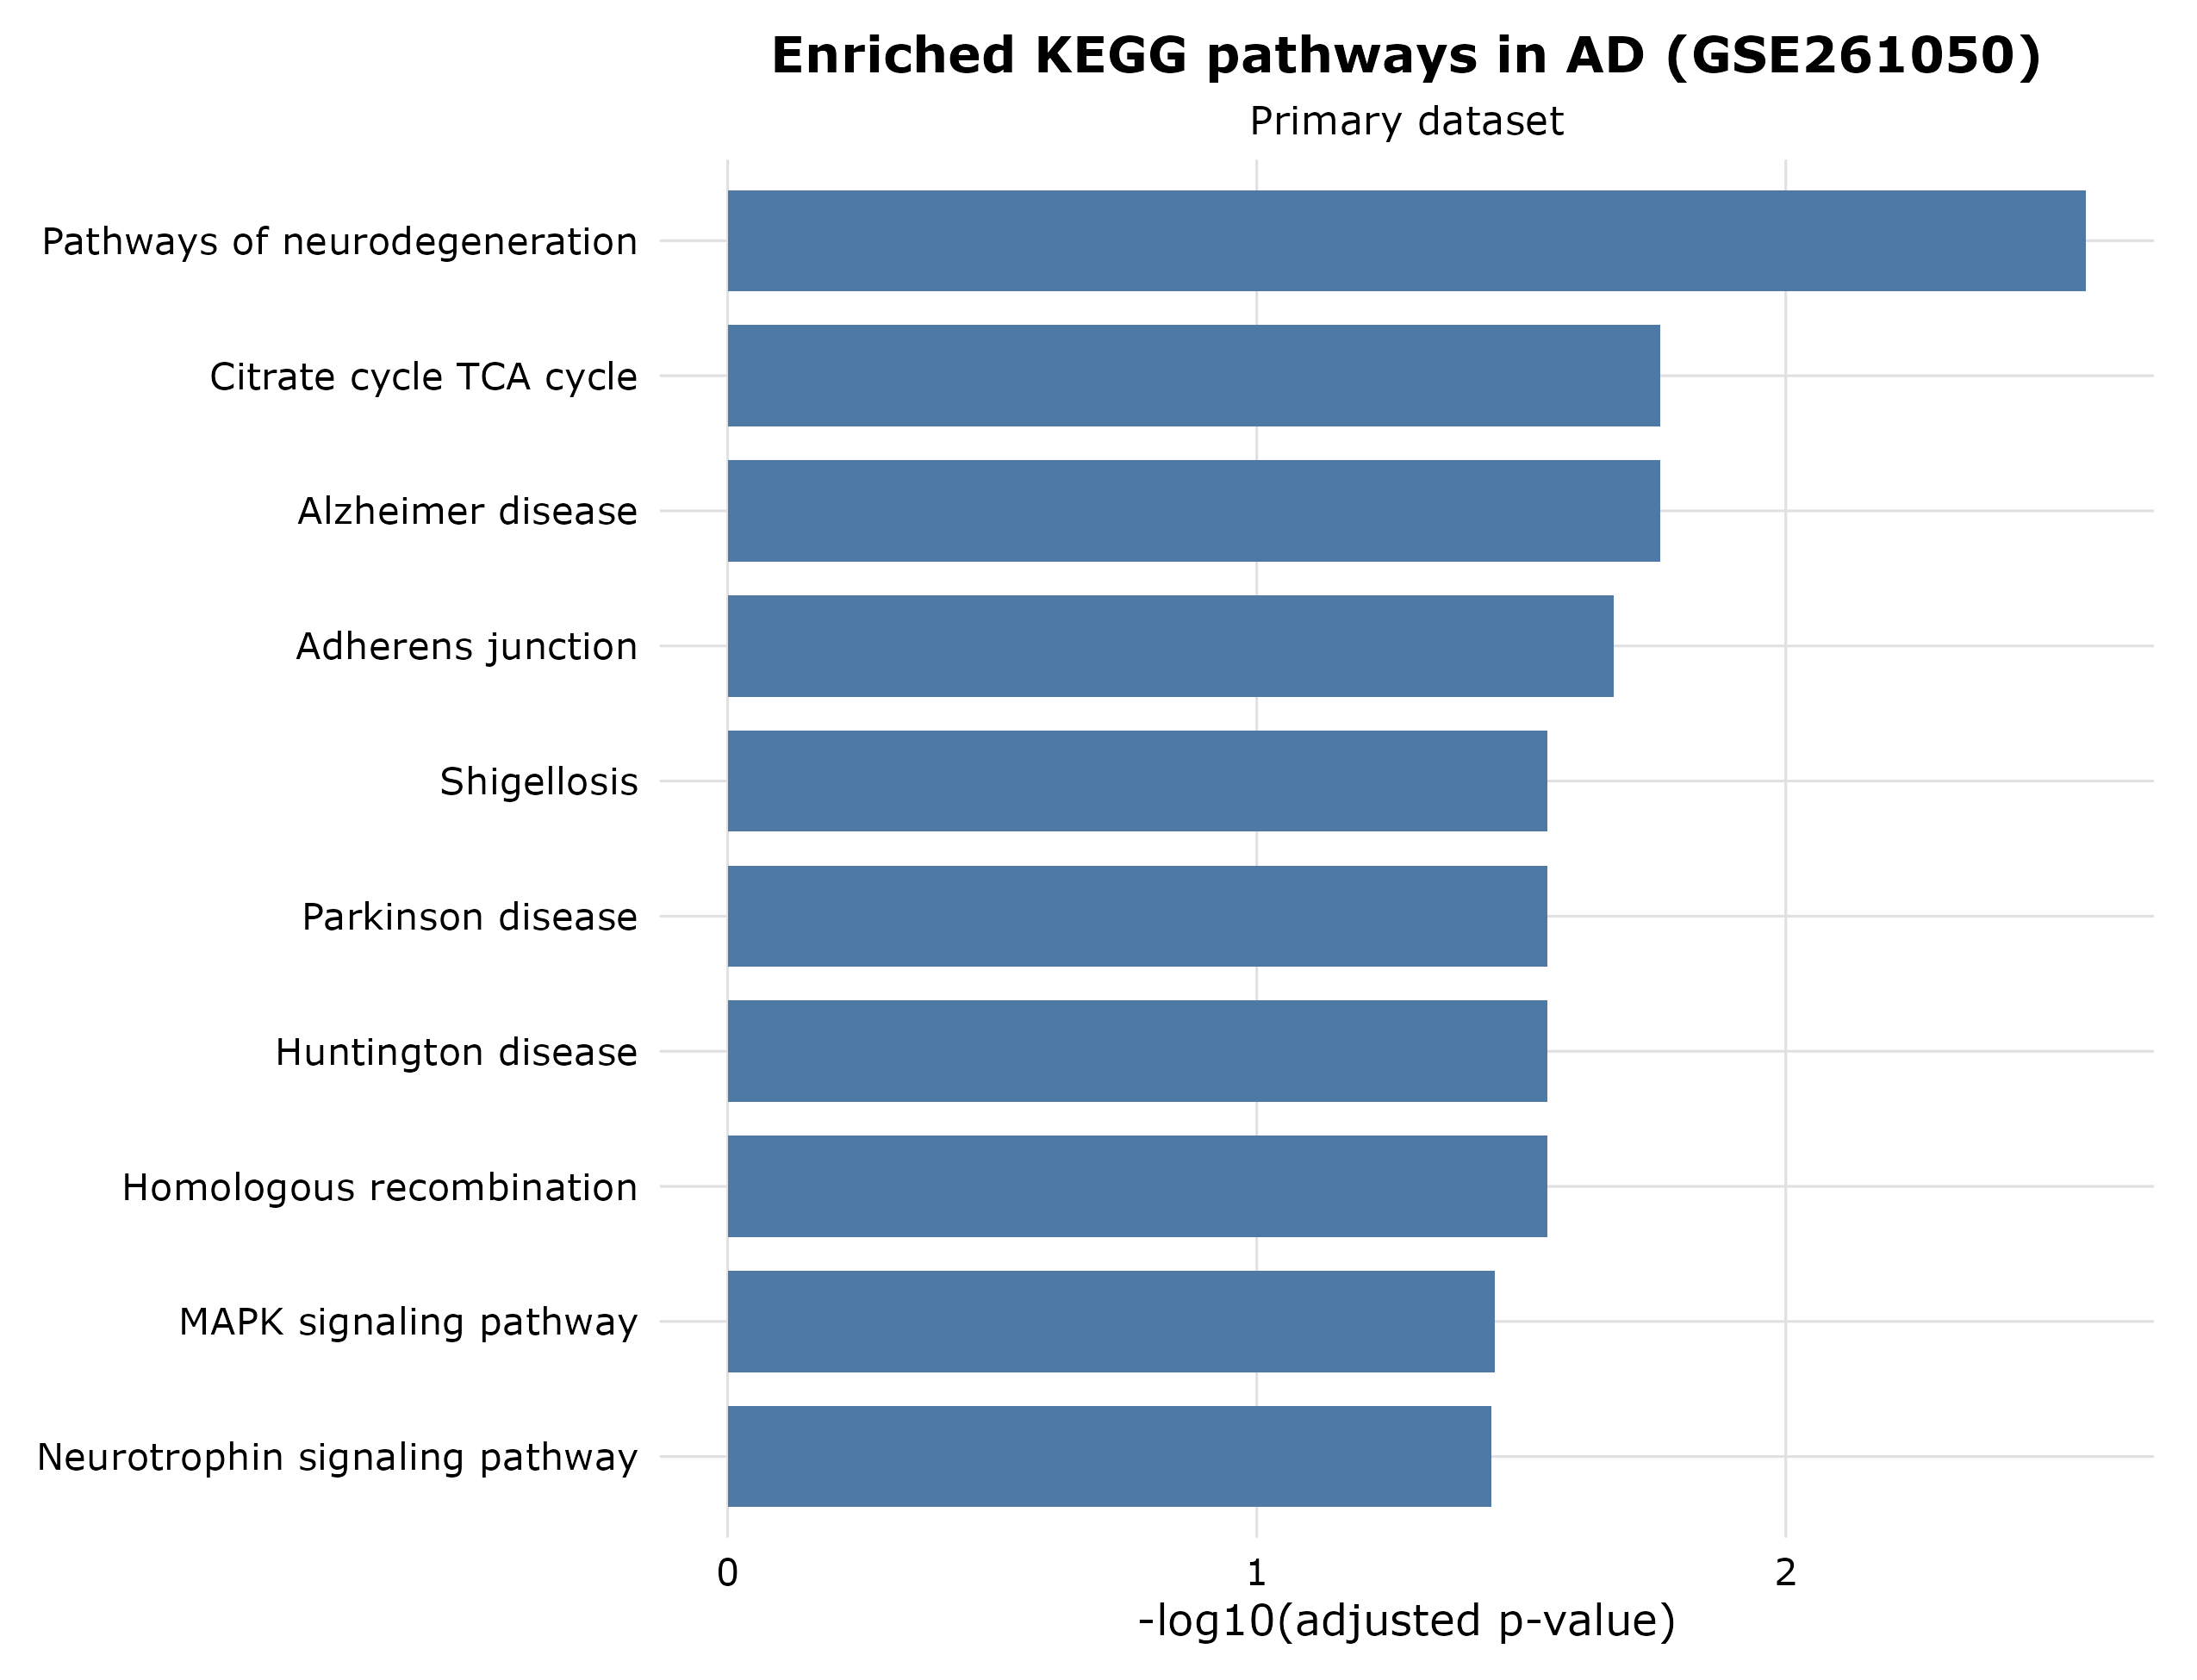
This figure shows the most enriched biological pathways of the differentially expressed genes in the primary dataset. The pathway names are displayed on the y-axis and the statistical significance (−log10 adjusted p-value) on the x-axis. Multiple enriched pathways are associated with neurodegeneration, signalling, and cellular stress responses, reinforcing the biological relevance for the gene expression alterations observed in AD.
Identification of drug candidates
We then used a drug repurposing approach to find compounds that could reverse the AD gene expression signature. Figure 3 shows the top predicted drugs. A number of compounds were identified including transcriptional regulators such as histone deacetylase (HDAC) inhibitors and cyclin-dependent kinase (CDK) inhibitors. These drugs are known to modulate gene expression and cellular signaling, which make them good candidates for further computational prediction.
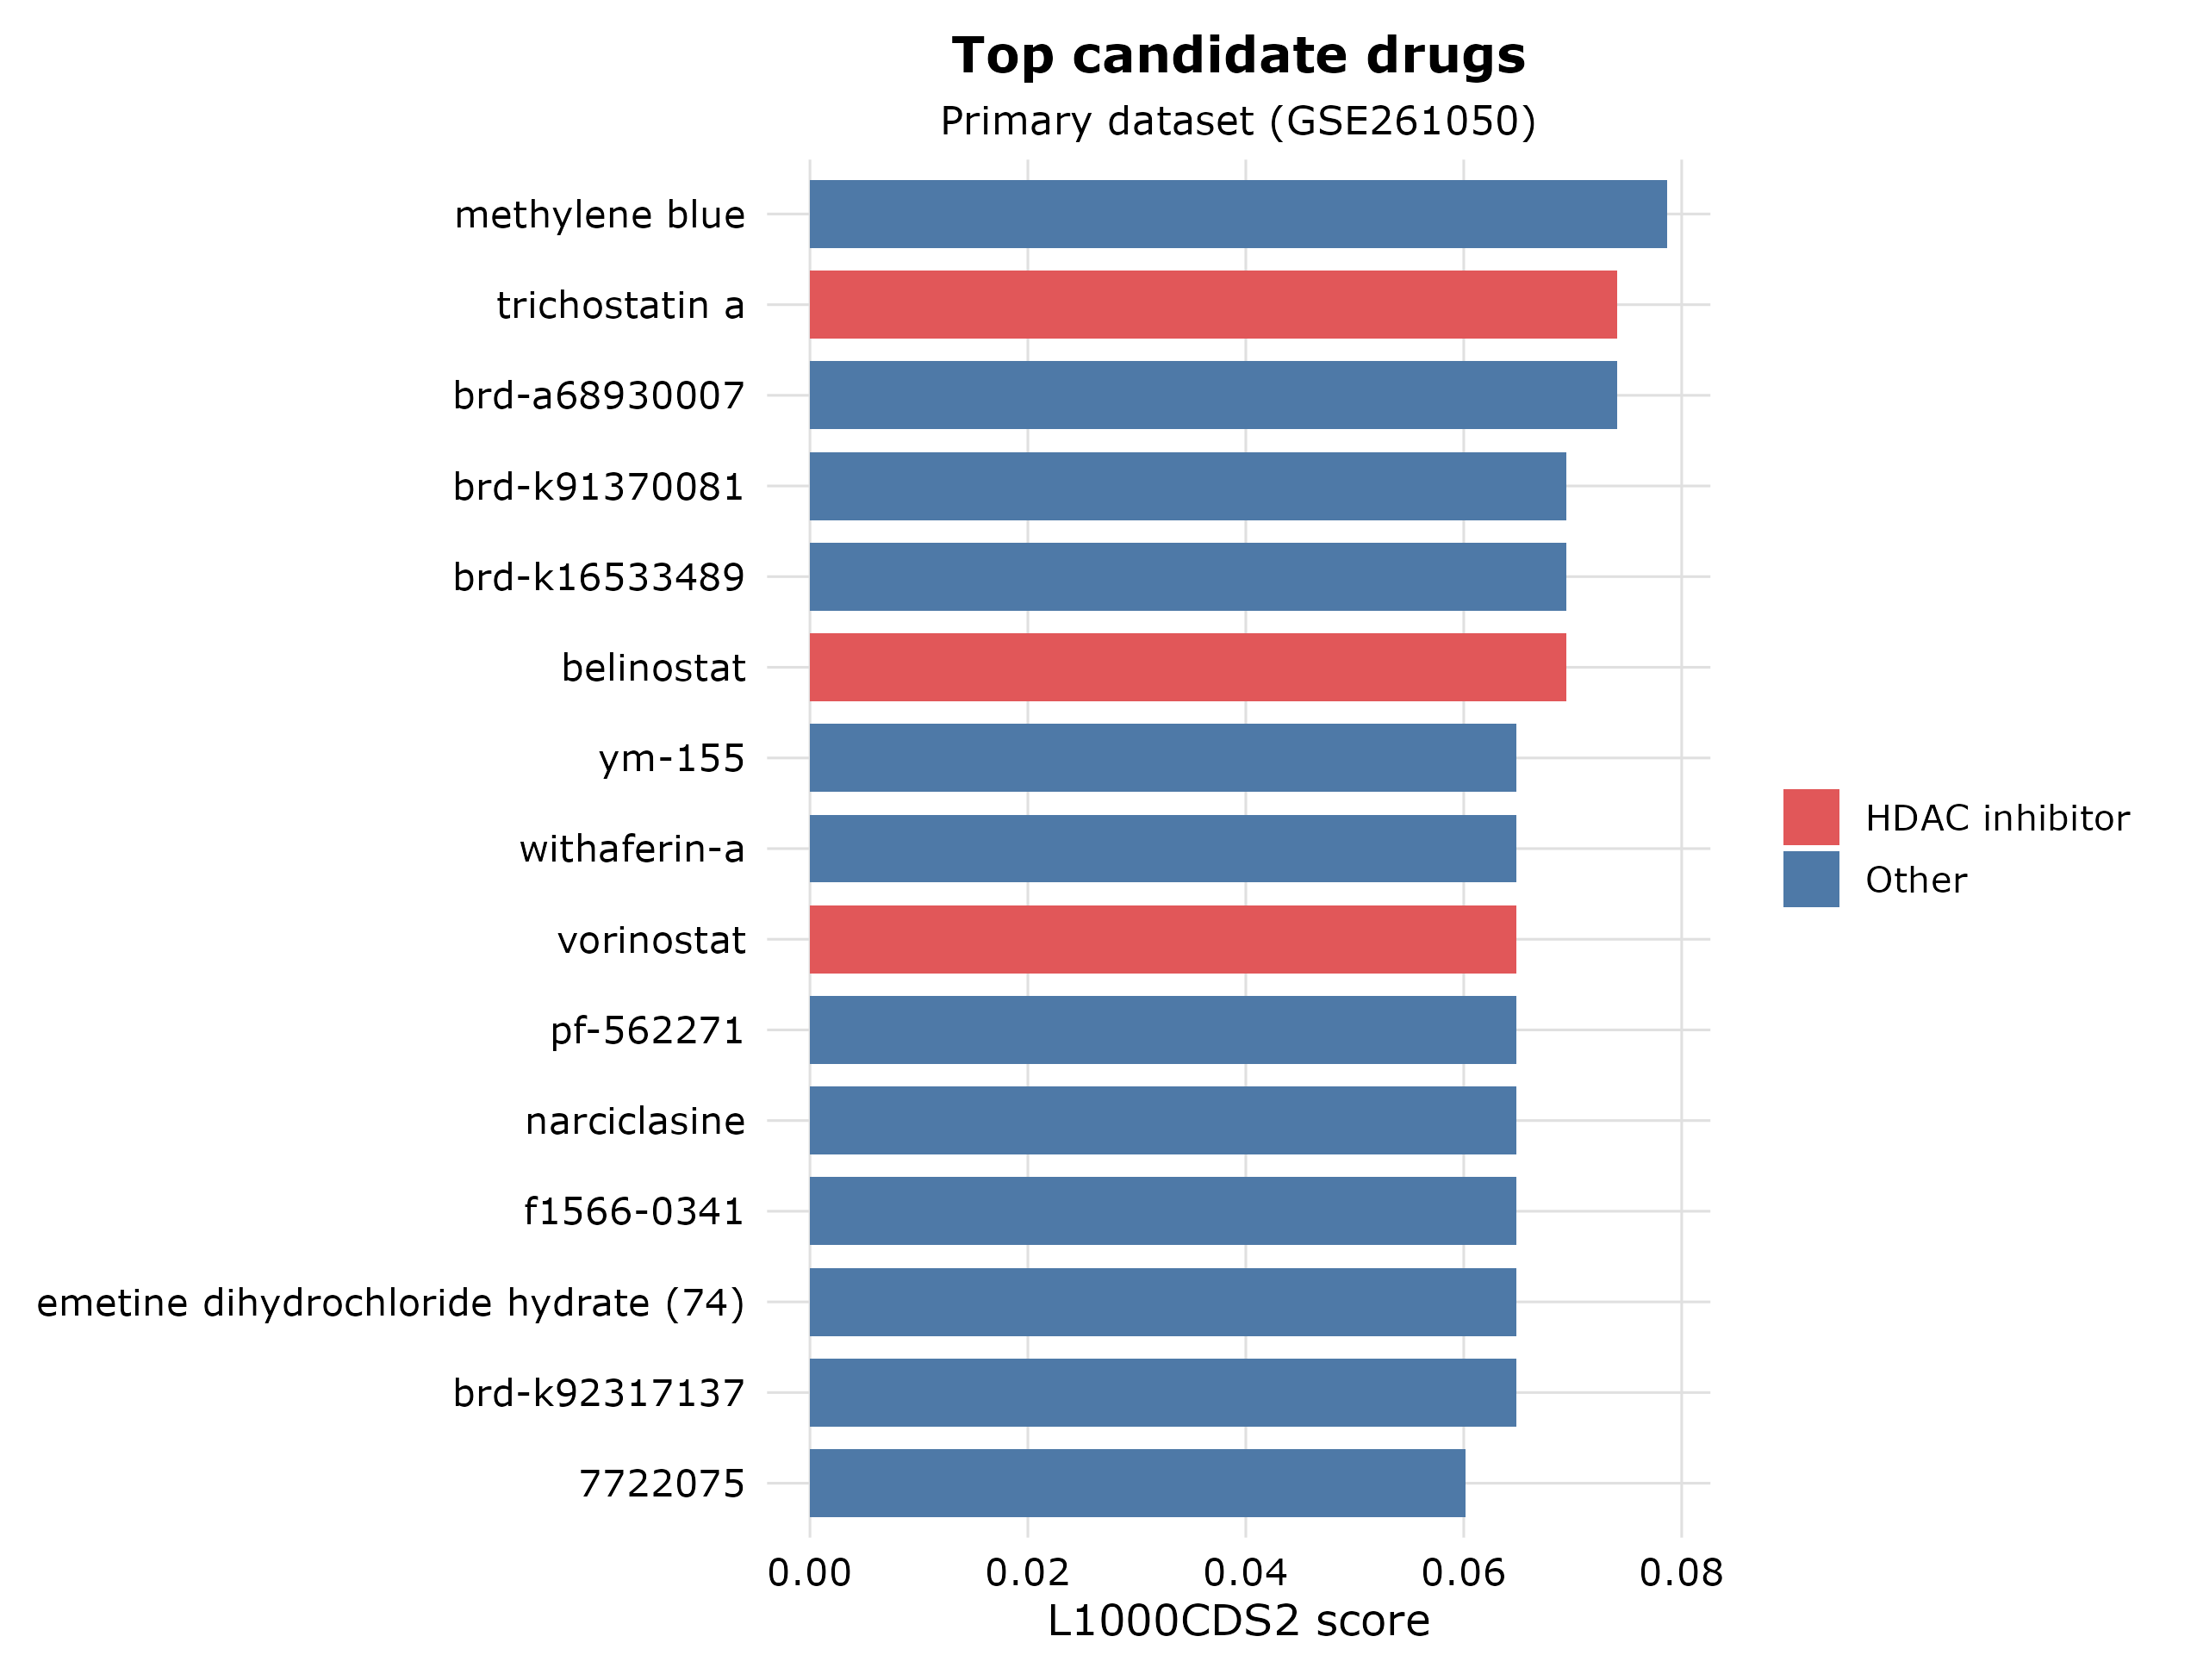
This bar plot shows the top-ranked drugs identified using the L1000CDS2 drug repurposing analysis. The x-axis represents individual drugs, and the y-axis represents the prediction score, which reflects how strongly each drug is predicted to reverse the Alzheimer’s disease gene expression pattern. HDAC inhibitors are highlighted in a different color. Several transcriptional regulators, including HDAC and CDK inhibitors, appear among the top candidates.
Pathways Cross-Dataset Validation
To validate our results, we compared the enriched pathways obtained from the primary dataset (GSE261050) with those obtained from an independent dataset (GSE33000). As shown in Figure 4, there was overlap of key KEGG pathways between the two datasets. Pathways such as MAPK signaling and infection-related pathways (e.g., shigellosis) were found in both analysis. As with shigellosis, pathways should not be taken as evidence of involvement of infectious disease. Instead, the pathway annotations include signaling, inflammatory and stress-response genes that overlap considerably with pathways implicated in neurodegeneration. In the top ranked results, three KEGG pathways were shared in all three datasets, suggesting partial reproducibility of pathway-level biological signals across datasets.
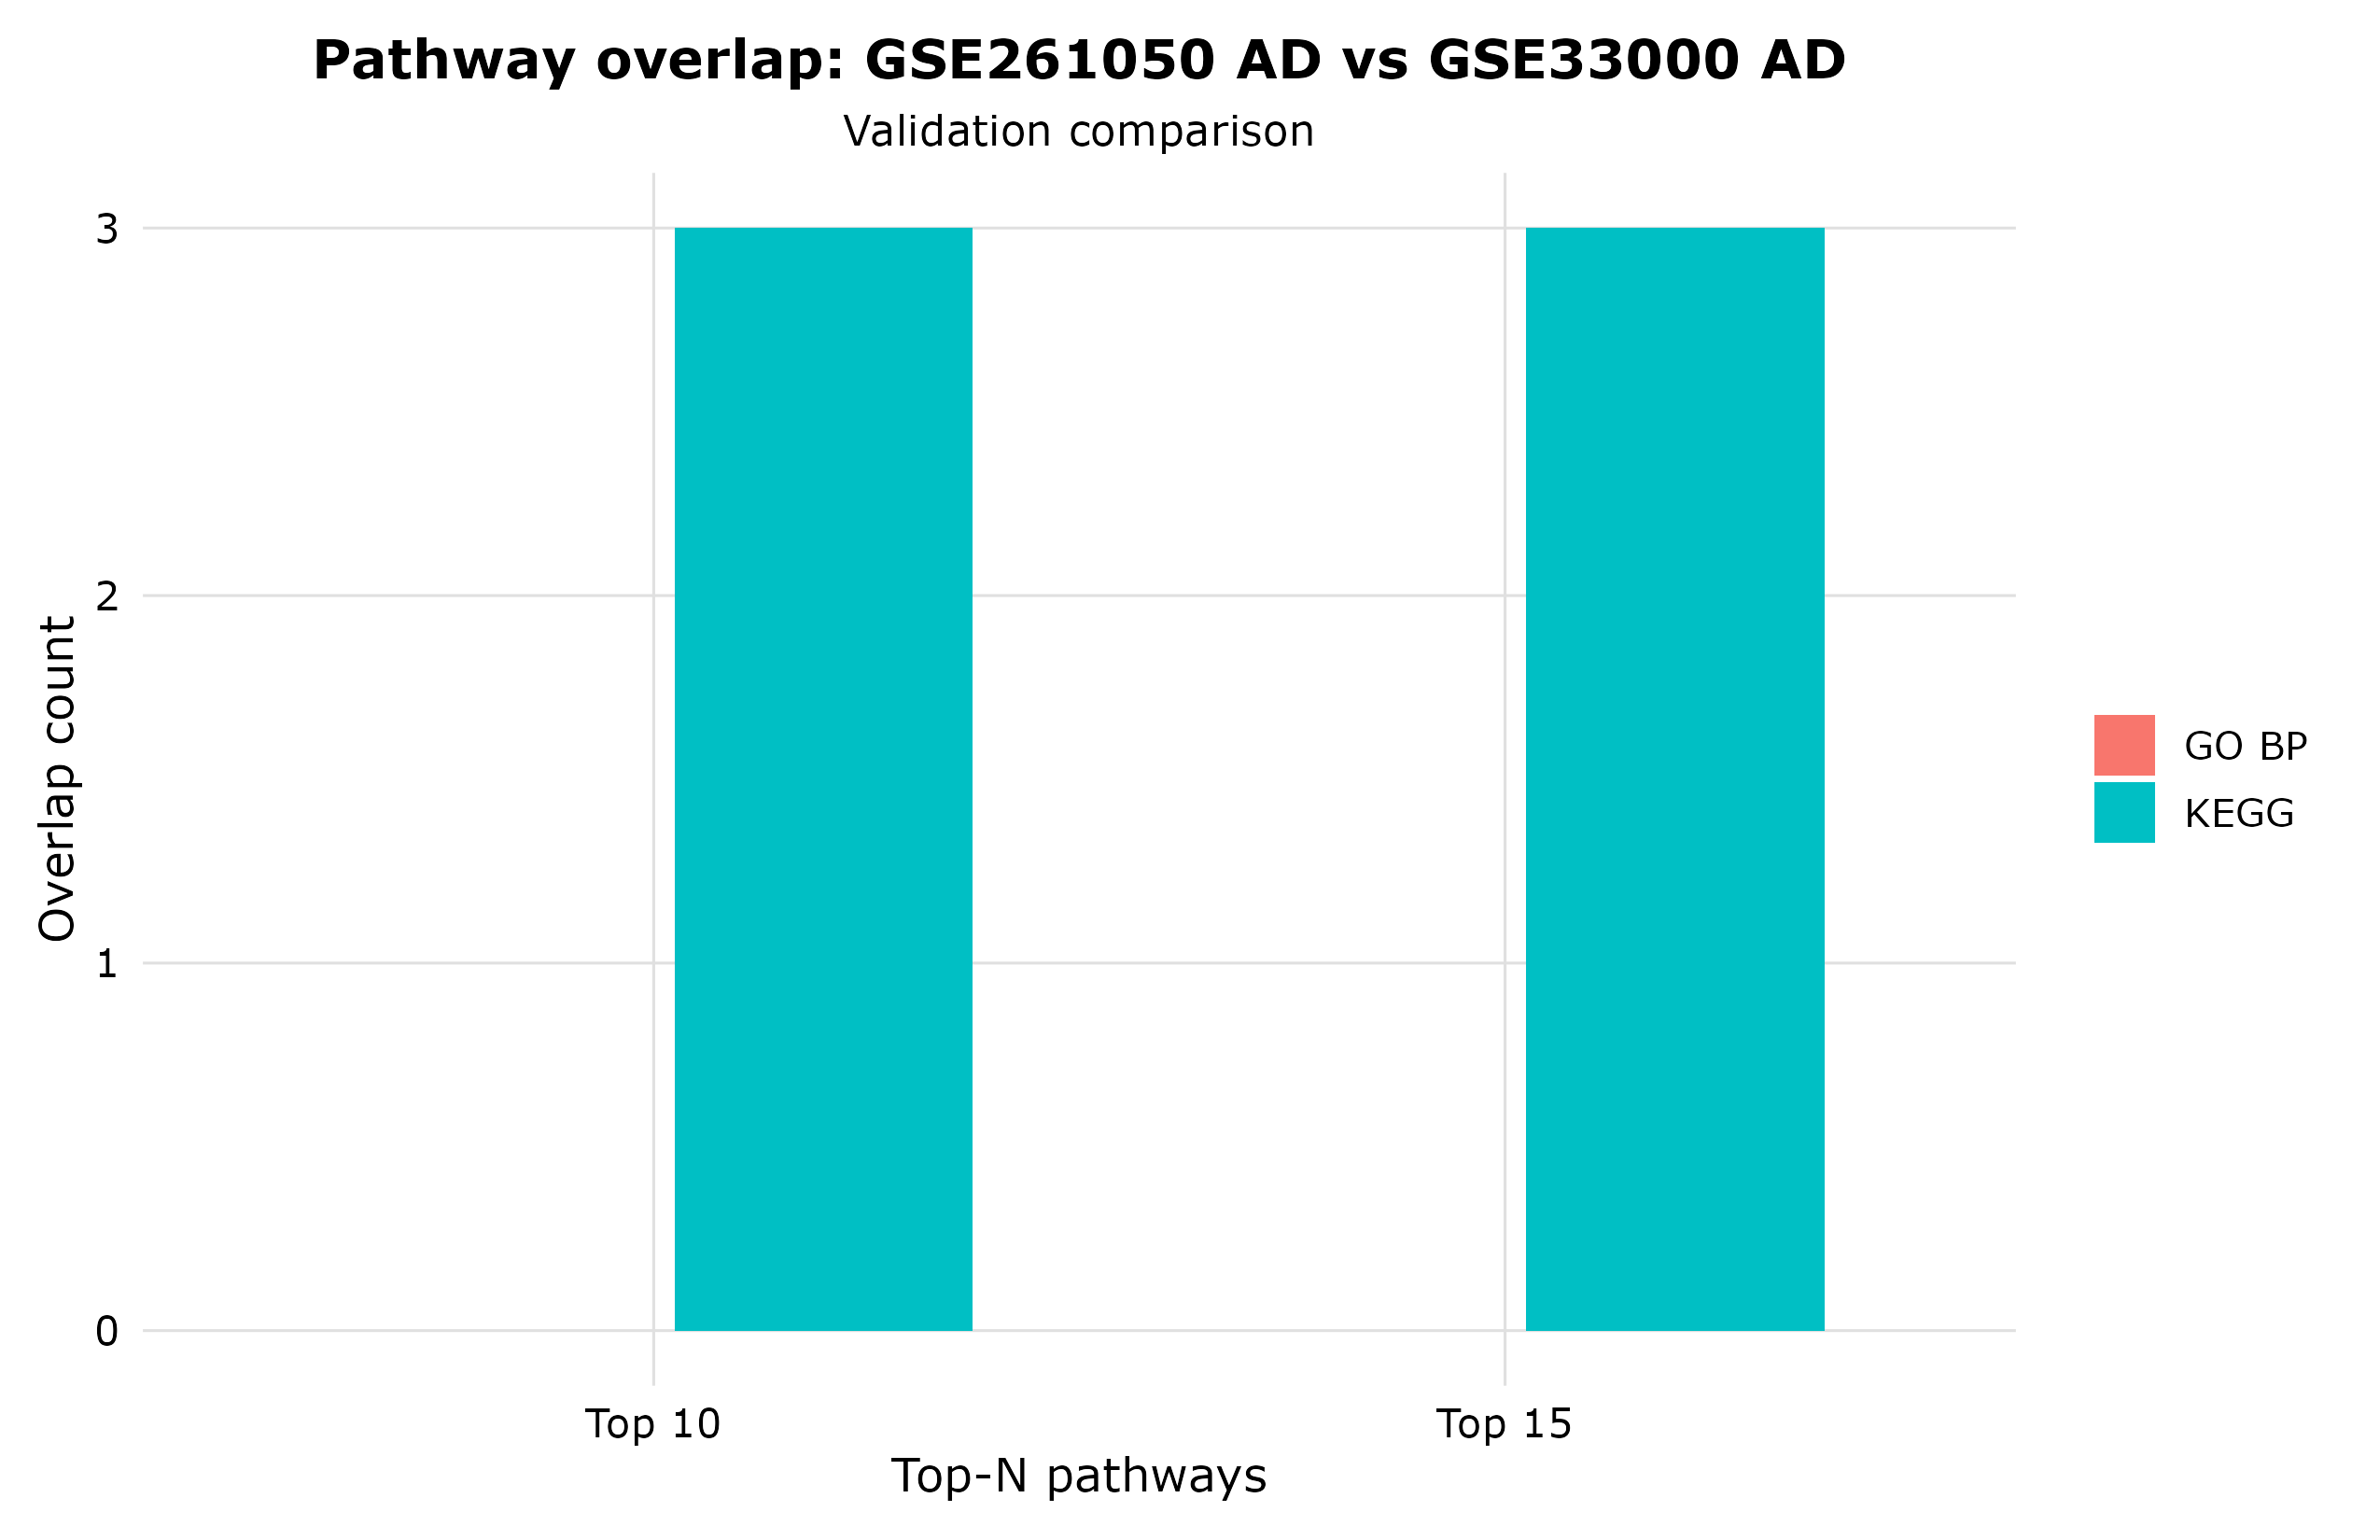
The plot compares enriched KEGG pathway between the primary dataset (GSE261050) and validation dataset (GSE33000). The x-axis indicates the number of top pathways included in the comparison (Top 10 or Top 15), “Top N” means the N most significant pathways ranked by adjusted p-value. The y-axis shows the number of pathways overlapping between the two datasets. There are three KEGG pathways overlapping among the datasets, suggesting that biological signals are partially reproducible. In contrast, there was little to no overlap between the GO pathways, indicating that KEGG pathways are more consistent across the datasets.
Comparison Among Datasets of Predicted Drug Class
We also compared the predicted drug candidates between two datasets, especially transcriptional regulators like HDAC inhibitors. As shown in Figure 5, HDAC-related drugs were identified in both datasets but with different frequency. In the primary data set (GSE261050), HDAC-related drugs comprised about 20% of the top 15 candidates, while in the validation data set (GSE33000) they comprised about 6–7%.
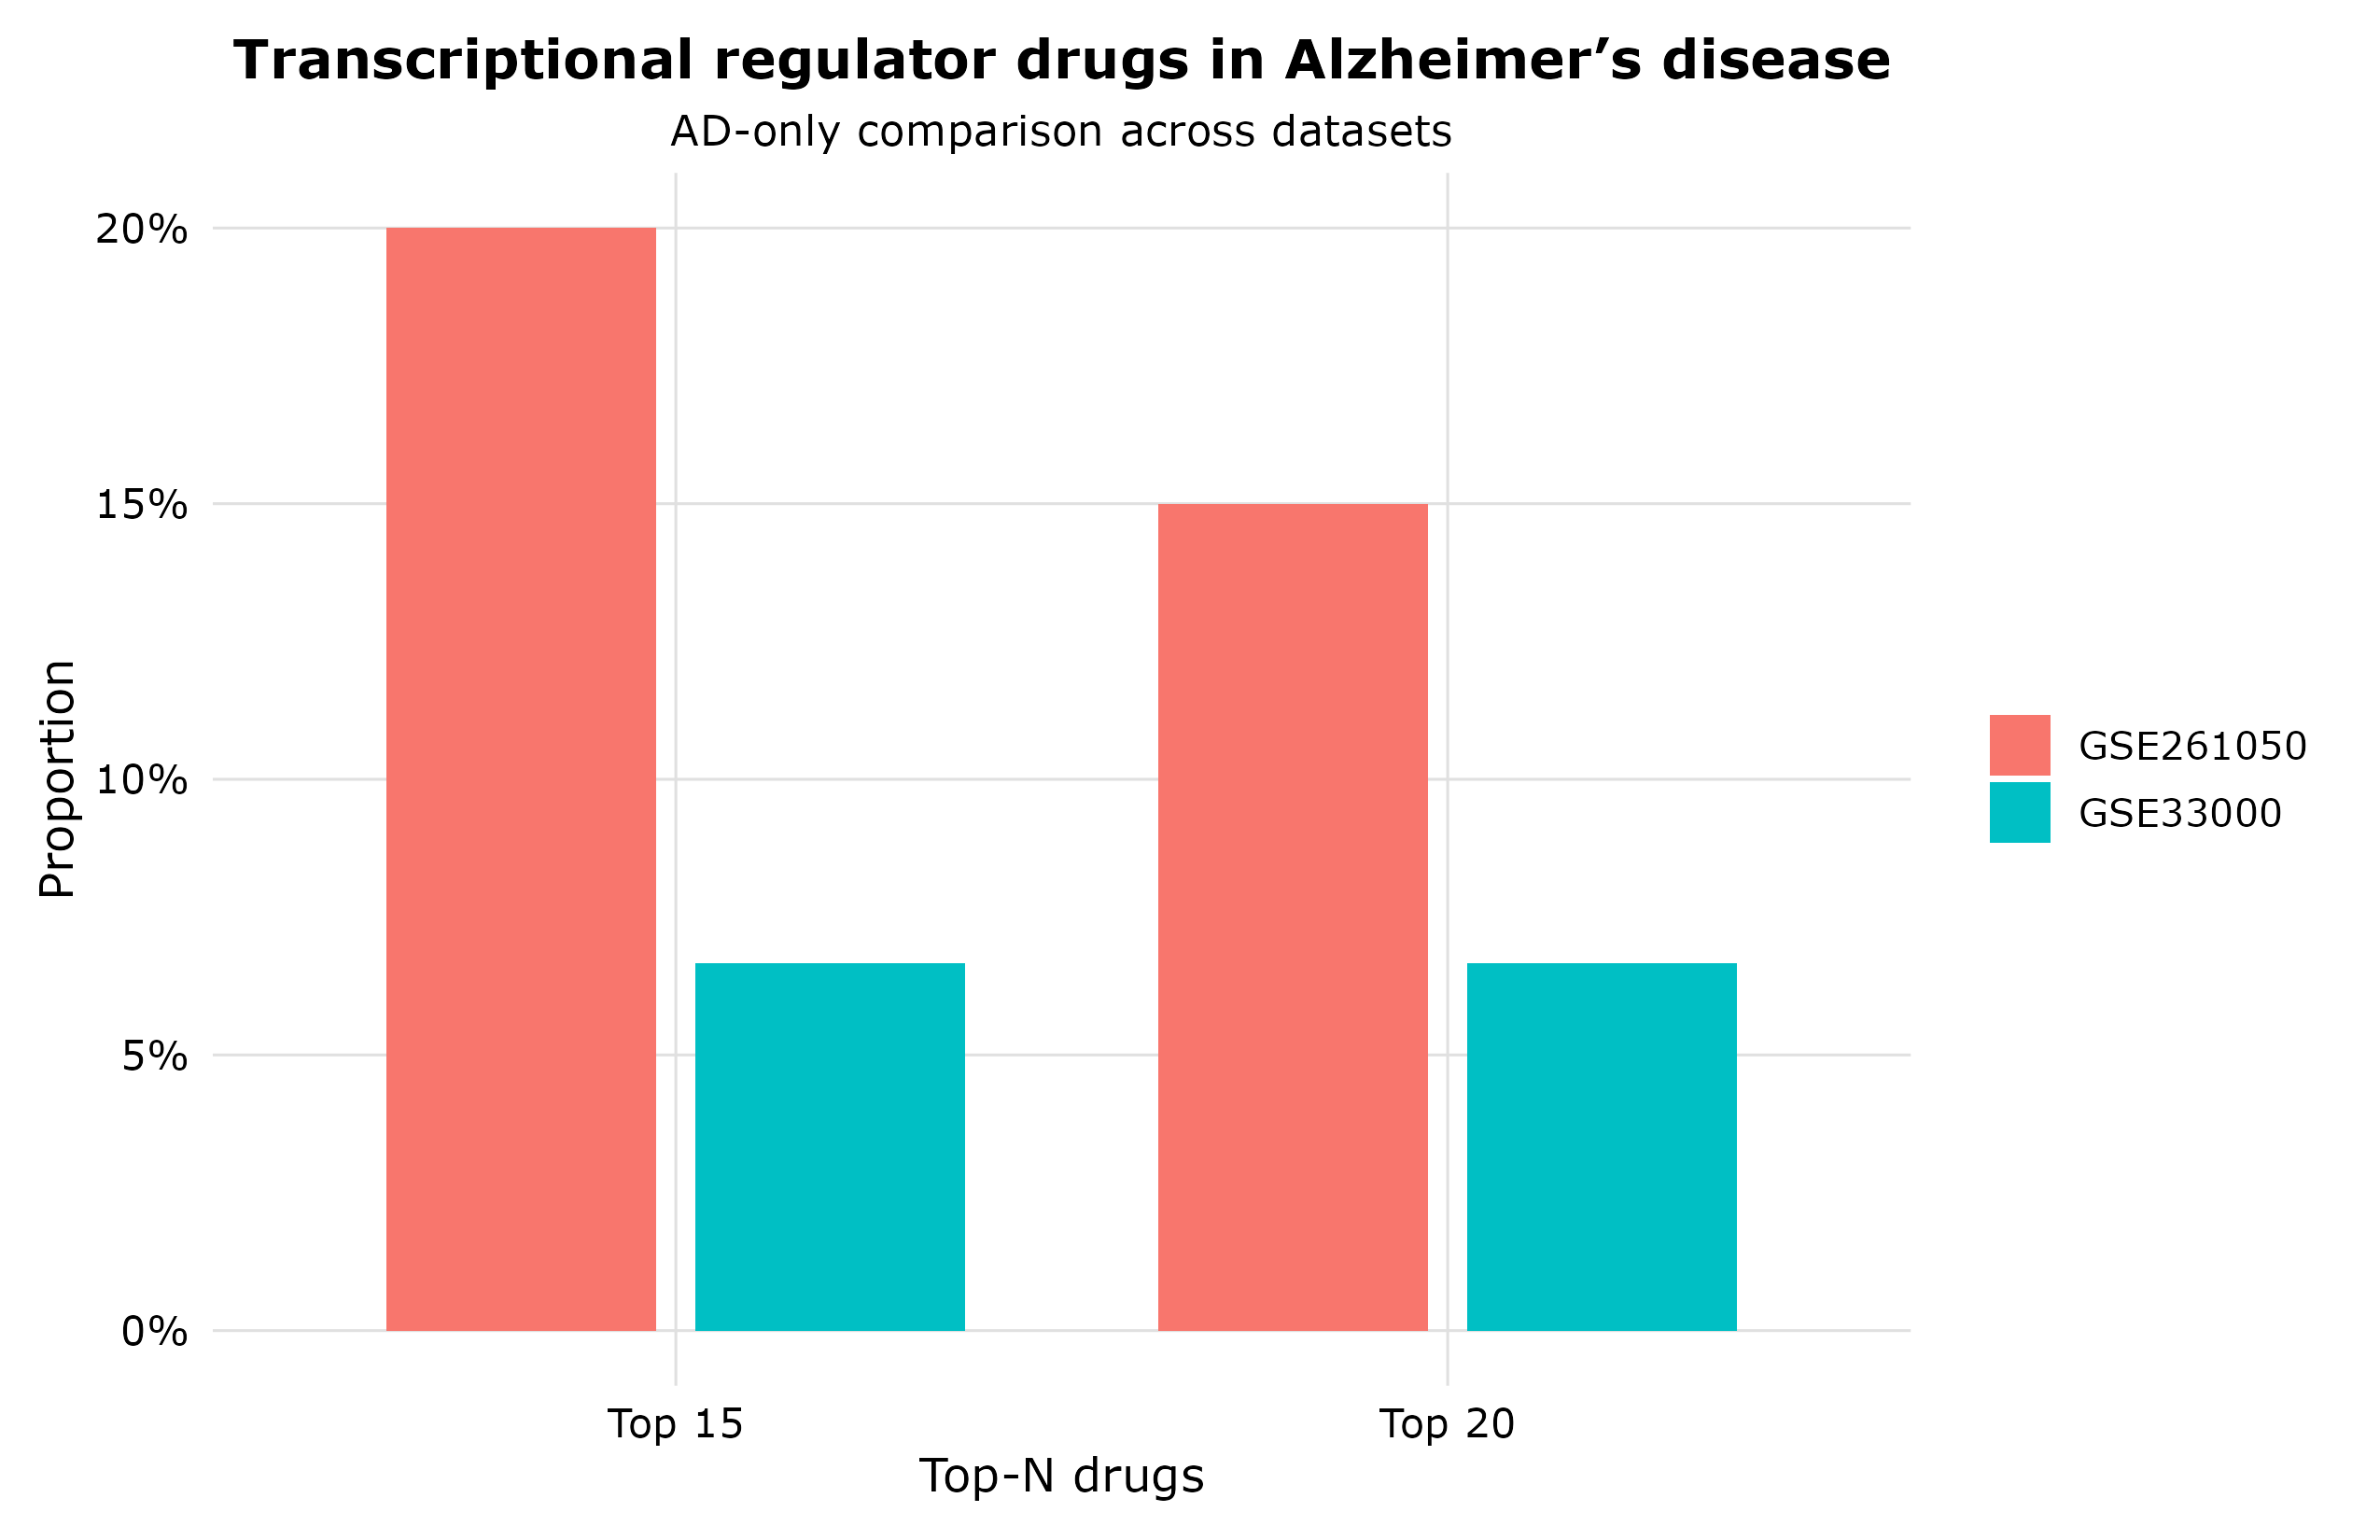
These results indicate that, although HDAC-related compounds were among the top predictions in both datasets, there was no statistical enrichment. Thus, these results should be interpreted as a reproducible, but modest, computational signal, rather than evidence in support of HDAC inhibitors as validated therapeutic candidates. Together these findings suggest that transcriptional regulation may be involved in molecular changes associated with AD.
Discussion
Here we applied transcriptomic analysis and computational drug-repurposing approaches to assess the reproducibility of disease-associated molecular signals across independent Alzheimer’s disease datasets. Many of the pathways identified in this study have been reported before, but our goal was not to identify completely novel molecular mechanisms of Alzheimer’s disease. Instead, we tested the detectability of pathway-enrichment results and computational drug-prediction signals across independent transcriptomic platforms18.
One of the most consistent findings from our analysis was an enrichment of pathways associated with neurodegeneration and signaling, particularly MAPK signaling. The MAPK pathway is involved in neuronal survival, apoptosis and stress responses, and dysregulation of the pathway has been linked to Alzheimer’s disease progression19,20. Even if the pathway analysis are not always perfectly consistent, the overlap of KEGG pathways across independent datasets is a strong message about the robustness of these biological signals. However, the small overlap between datasets additionally emphasizes the challenges of transcriptomic reproducibility. Variations in pathway-enrichment results may arise from differences in cohort composition, tissue sampling, experimental platform and analytical methods. Furthermore, several enriched pathways share common mitochondrial, inflammatory and stress response genes. Thus, overlap of pathway annotations should not be interpreted as independent biological validation, but as support for related molecular processes.
Our drug-repurposing analysis led to the generation of several computationally predicted compounds including transcriptional regulators such as HDAC inhibitors and CDK inhibitors. These classes of compounds have been previously studied in neurodegenerative disease due to their potential effects on gene regulation and cellular signalling21,22. However, statistical testing did not show significant enrichment of HDAC inhibitors in the list of top ranked candidates. Thus, the data should be interpreted as a reproducible but weak signal and not as proof that HDAC inhibitors are validated therapeutic candidates. The present study was designed to identify transcriptomic reversal signatures and not to test the feasibility of drug development. Thus, blood-brain barrier penetration, toxicity, pharmacokinetics, pharmacodynamics and previous clinical evidence in Alzheimer’s disease were not systematically assessed. Future studies should consider these when prioritizing candidate compounds for experimental validation23.
The results should be interpreted with some limitations. The analysis was based on publicly available datasets, which vary in sample composition, experimental design and transcriptomic platform. The main data set was generated by RNA sequencing and the validating data set was generated by microarray technology. These platforms differ widely in transcript coverage, dynamic range and normalization procedures. Second, the differential-expression analysis employed a simplified design formula (~condition) and failed to explicitly account for age, sex, brain region, post-mortem interval (PMI), RNA integrity number (RIN), donor-level correlation, or batch variables. Therefore, some differences observed in the expression could be related to these factors and not the disease status. Third, some donors provided samples from multiple brain regions and donor-level correlations were not explicitly modeled. Finally, all drug predictions are made by computational approaches and not validated in the laboratory. Thus, results are considered hypothesis-generating rather than conclusive.
In the future, these results can continue to be studied by adding more transcriptomic data sets. For this purpose, we would use statistical models that adjust for demographic and clinical covariates, evaluate pathway reproducibility in larger cohorts, and experimentally validate candidate compounds in cellular or animal models. These studies will be required to determine the biological or therapeutic significance of the computationally predicted drug candidates found.
Conclusion
In this study, we used transcriptomic analysis and computational drug-repurposing approaches to evaluate disease-associated molecular signals across independent Alzheimer’s disease datasets. Our results show that AD is associated with widespread changes in gene expression and enrichment of pathways related to neurodegeneration and MAPK signaling. These findings support the idea that Alzheimer’s disease involves complex and interconnected biological processes.
Using a computational drug-repurposing method, we identified several compounds whose transcriptional signatures oppose disease-associated expression patterns. Among these, transcriptional regulators, including HDAC inhibitors and CDK inhibitors appeared among top-ranked predictions in multiple analysis. However, HDAC-related compounds were not significantly enriched, indicating that these observations should be interpreted as a modest and reproducible computational signal rather than evidence of therapeutic efficacy.
Importantly, validation in an independent dataset showed only partial overlap of pathway-level findings, suggesting modest reproducibility across transcriptomic platforms. To summarize, transcriptomic analysis can be useful to identify disease-associated molecular patterns and generate hypotheses for future therapeutic investigation. All candidate compounds were identified by in silico approaches, and experimental validation will be necessary to assess their biological and therapeutic relevance. Further studies with larger cohorts, more transcriptomic datasets and experimental validation will be needed to better assess the robustness and translational potential of these findings.
References
- Alzheimer’s Association. Alzheimer’s disease facts and figures 2024. Alzheimer’s & Dementia. Vol. 20, pg. 3708–3821, 2024 https://doi.org/10.1002/alz.13809 [↩]
- M. A. DeTure, D. W. Dickson. The neuropathological diagnosis of alzheimer’s disease. Molecular Neurodegeneration. Vol. 14, pg. 32, 2019 https://doi.org/10.1186/s13024-019-0333-5 [↩]
- F. Leng, P. Edison. Neuroinflammation and microglial activation in alzheimer disease: where do we go from here? Nature Reviews Neurology. Vol. 17, pg. 157–172, 2021 https://doi.org/10.1038/s41582-020-00435-y [↩]
- P. L. De Jager, Y. Ma, C. McCabe. A multi-omic atlas of the human frontal cortex for aging and alzheimer’s disease research. Scientific Data. Vol. 5, pg. 180142, 2018 https://doi.org/10.1038/sdata.2018.142 [↩]
- Y. W. Wan, R. Al-Ouran, C. G. Mangleburg. Meta-analysis of the alzheimer’s disease human brain transcriptome and functional dissection in mouse models. Cell Reports. Vol. 32, pg. 107908, 2020 https://doi.org/10.1016/j.celrep.2020.107908 [↩] [↩] [↩]
- M. Allen, M. M. Carrasquillo, C. Funk. Human whole genome genotype and transcriptome data for alzheimer’s and other neurodegenerative diseases. Scientific Data. Vol. 3, pg. 160089, 2016 https://doi.org/10.1038/sdata.2016.89 [↩] [↩]
- H. Mathys, J. Davila-Velderrain, Z. Peng. Single-cell transcriptomic analysis of alzheimer’s disease. Nature. Vol. 570, pg. 332–337, 2019 https://doi.org/10.1038/s41586-019-1195-2 [↩] [↩] [↩]
- M. Wang, P. Roussos, A. McKenzie. Integrative network analysis of nineteen brain regions identifies molecular signatures and networks underlying selective regional vulnerability to alzheimer’s disease. Genome Medicine. Vol. 8, pg. 104, 2016 https://doi.org/10.1186/s13073-016-0355-3 [↩] [↩] [↩]
- M. Wang, N. D. Beckmann, P. Roussos. The mount sinai cohort of large-scale genomic, transcriptomic and proteomic data in alzheimer’s disease. Scientific Data. Vol. 5, pg. 180185, 2018 https://doi.org/10.1038/sdata.2018.185 [↩] [↩]
- S. Pushpakom, F. Iorio, P. A. Eyers. Drug repurposing: progress, challenges and recommendations. Nature Reviews Drug Discovery. Vol. 18, pg. 41–58, 2019 https://doi.org/10.1038/nrd.2018.168 [↩]
- W. Jiang, J. Vogelgsang, S. Dan, P. Durning, T. H. McCoy, S. Berretta, T. Klengel. Association of rdoc dimensions with post mortem brain transcriptional profiles in alzheimer’s disease. Alzheimer’s & Dementia (Amsterdam). Vol. 17, pg. e70103, 2025 https://doi.org/10.1002/dad2.70103 [↩]
- M. Narayanan, J. L. Huynh, K. Wang, X. Yang, S. Yoo, J. McElwee, B. Zhang, C. Zhang, J. R. Lamb, T. Xie, C. Suver, C. Molony, S. Melquist, A. D. Johnson, G. Fan, D. J. Stone, E. E. Schadt, P. Casaccia, V. Emilsson, J. Zhu. Common dysregulation network in the human prefrontal cortex underlies two neurodegenerative diseases. Molecular Systems Biology. Vol. 10, pg. MSB145304, 2014 https://doi.org/10.15252/msb.20145304 [↩]
- M. I. Love, W. Huber, S. Anders. Moderated estimation of fold change and dispersion for rna-seq data with deseq2. Genome Biology. Vol. 15, pg. 550, 2014 https://doi.org/10.1186/s13059-014-0550-8 [↩]
- M. Kanehisa, S. Goto. KEGG: kyoto encyclopedia of genes and genomes. Nucleic Acids Research. Vol. 28, pg. 27–30, 2000 https://doi.org/10.1093/nar/28.1.27 [↩]
- Q. Duan, C. Flynn, M. Niepel. L1000CDS2: lincs l1000 characteristic direction signatures search engine. Npj Systems Biology and Applications. Vol. 2, pg. 16015, 2016 https://doi.org/10.1038/npjsba.2016.15 [↩]
- A. Subramanian, R. Narayan, S. M. Corsello. A next generation connectivity map: l1000 platform and the first 1,000,000 profiles. Cell. Vol. 171, pg. 1437-1452.e17, 2017 https://doi.org/10.1016/j.cell.2017.10.049 [↩]
- M. E. Ritchie, B. Phipson, D. Wu. Limma powers differential expression analyses for rna-sequencing and microarray studies. Nucleic Acids Research. Vol. 43, pg. e47, 2015 https://doi.org/10.1093/nar/gkv007 [↩]
- J. M. Long, D. M. Holtzman. Alzheimer disease: an update on pathobiology and treatment strategies. Cell. Vol. 179, pg. 312–339, 2019 https://doi.org/10.1016/j.cell.2019.09.001 [↩]
- E. K. Kim, E. J. Choi. Pathological roles of mapk signaling pathways in human diseases. Biochimica et Biophysica Acta. Vol. 1802, pg. 396–405, 2010 https://doi.org/10.1016/j.bbadis.2009.12.009 [↩]
- A. Sun, M. Liu, X. V. Nguyen, G. Bing. P38 map kinase is activated at early stages in alzheimer’s disease brain. Experimental Neurology. Vol. 183, pg. 394–405, 2003 https://doi.org/10.1016/S0014-4886(03)00180-8 [↩]
- J. Gräff, L.-H. Tsai. Histone acetylation: molecular mnemonics on the chromatin. Nature Reviews Neuroscience. Vol. 14, pg. 97–111, 2013 https://doi.org/10.1038/nrn3427 [↩]
- A. Fischer, F. Sananbenesi, X. Wang. Recovery of learning and memory is associated with chromatin remodelling. Nature. Vol. 447, pg. 178–182, 2007 https://doi.org/10.1038/nature05772 [↩]
- J. Bauzon, G. Lee, J. Cummings. Repurposed agents in the alzheimer’s disease drug development pipeline. Alzheimer’s Research & Therapy. Vol. 12, pg. 98, 2020 https://doi.org/10.1186/s13195-020-00662-x [↩]