Abstract
Cardiovascular disease (CVD) is the leading cause of death globally. Early intervention is critical in preventing end-stage cardiovascular symptoms. Previous research has shown that risk factors interact synergistically to increase overall CVD risk. However, invasive procedures, inconvenience, time-consuming visits, and subtle symptoms discourage people from going to the hospital for a diagnosis, disallowing early intervention. Thus, this study has developed a comprehensive monitoring and early intervention system for cardiovascular chronic diseases based on artificial intelligence and non-invasive hardware devices. In this study, eleven prediction models were trained on the UCI Cleveland database and then evaluated through AUC, recall, accuracy, precision, and F-1 score. CatBoost was ultimately chosen as the most optimal model, achieving an AUC score of 0.94.
Keywords: Cardiovascular Disease, Artificial Intelligence, Machine Learning, Early Intervention, Risk Assessment
Introduction
Hazards of cardiovascular disease (CVD)
Cardiovascular diseases (CVD) are diseases affecting the heart or blood vessels, typically associated with fat deposition within arteries (atherosclerosis) and thrombosis (Table 1.1). These diseases can not only impede blood flow to the heart and brain, but also cause severe damage to important organs such as the eyes and kidneys1.
| Type of cardiovascular disease | Leading feature | Possible health problems |
| Coronary heart disease (coronary artery disease) | The coronary arteries are narrowed by fat deposits or thrombosis, and the heart does not get enough blood | Angina, heart failure, myocardial infarction |
| Stroke | Restricted or blocked blood flow to the brain may be caused by a blockage or rupture in a blood vessel | Neurological damage, hemiplegia, speech difficulties |
| Peripheral arterial disease | Limited blood flow to the limbs is usually caused by atherosclerosis | Poor circulation, slow healing wounds, pain in limbs |
| Disease of the aorta | Abnormalities in the aorta, including aneurysms (dilation) or dissections (dissection of the inner lining) | Pain in the limbs, ulcers, tissue necrosis |
CVD is currently the leading cause of death globally, causing approximately 19.8 million deaths annually and accounting for 32% of all global deaths. Among these, 85% of deaths are due to heart disease or stroke2. In Asia, cardiovascular disease mortality has risen from 5.6 million in 1990 to 10.8 million in 2019, with nearly 39% of premature deaths occurring in individuals under 70 years old3.
The cardiovascular disease mortality rate in rural areas was 364.16 cases per 100,000 people in 20214. Over the past 20 years, the cardiovascular disease mortality rate in China has gradually increased, and it is higher in rural areas than in urban areas.
Complexity of CVD and risk assessment
The occurrence of CVD is typically caused by the combined effects of multiple risk factors such as hypertension, high cholesterol, diabetes, smoking, etc., rather than a single factor acting directly. Studies have found that over 70% of the global population has at least one risk factor for CVD, and only 2-7% has no risk factors at all5. The complex interactions among these risk factors, such as the synergistic interaction between hypertension and diabetes that exacerbates atherosclerosis, further amplify the probability of disease occurrence and the importance of improved risk assessment.
Since there is no minimum disease threshold that would trigger CVD, most events occur not in individuals with a single extreme CVD risk factor, but in people with several moderately elevated ones. Thus, global risk assessment can better identify high-risk individuals compared to single-indicator methods in CVD as it uses multivariate risk prediction methods6. Previous studies have also shown that comprehensive multi-factor interventions are more effective in reducing the incidence of CVD than controlling single risk factors, as it reduces the clustering of risk factors that compounds overall CVD risk7. Early intervention is considered the best strategy to prevent CVD, but there are many bottlenecks in the existing medical system illustrating the necessity of early identification and intervention.
AI in Cardiovascular Disease Risk Detection and Prediction
Artificial Intelligence (AI), especially machine learning, is emerging as a transformative tool in healthcare. By recognizing relationships in complex datasets and using them to predict future trends, machine learning becomes an effective tool for helping doctors efficiently analyze large amounts of patient data. Integrating AI into healthcare offers promising solutions for early detection, risk assessment, and intervention.
Overview of AI in Risk Prediction
There is great potential of AI in CVD risk prediction. However, it is still in its early stages of development, as external validation of the algorithms is still needed8. AI also improves personalized medicine in CVD by analyzing a wide range of datasets, including laboratory tests, genetic information, health records, and lifestyle data. AI combines and interprets these data to make more precise predictions. Moreover, AI can identify hidden and complex relations between multiple factors and analyze them simultaneously. This may help with early diagnosis as AI can identify subtle warning signs before they become clear symptoms9. This potential is supported by recent studies comparing ML models with conventional CVD risk scores. In a systematic review of studies from 2010 to 2024, ML models trained on electronic health records demonstrated superior performance compared with traditional risk assessment tools such as QRISK3 and ASCVD. Random forest and deep learning models achieved AUCs of 0.865 and 0.847, respectively, compared with 0.765 for conventional risk scores. However, the study also notes there’s high heterogeneity and potential publication bias, thus showing the need for stronger standardization and transparency in methodology before real-life deployment of AI in CVD risk assessment10.
AI-ECG and Early Detection Potential
Wu and Guo’s systematic review of 198 studies supports great research potential in AI combined with ECG in cardiovascular disease diagnosis and management11. One of the great potentials of AI in CVD risk prediction is its ability to identify subtle ECG signals and patterns that are undetectable to human interpreters, such as asymptomatic atrial fibrillation. This can turn ECG into a powerful, non-invasive biomarker for CVD, supporting earlier detection of hidden CVD risks12. Moreover, it also improves the identification of early-stage heart disease and efficiency in interpreting ECG signals, reducing rates of misdiagnosis.13. Furthermore, beyond disease detection, these algorithms show potential for post-cardiac surgery mortality prediction. A study shows that an AI-ECG predicted long-term mortality in cardiac surgery patients even when their LVEF was above 35%, showing AI-ECG’s potential to capture hidden cardiac risk beyond conventional ejection fraction measurements14. Furthermore, AI-ECG has the potential to predict future cardiovascular disease risk and mortality from ECG data. Sau et al. developed and validated an AIRE AI-ECG model that can predict 10-year mortality risk, as well as future cardiovascular outcomes, including heart failure, arrhythmias, heart attacks, and non-cardiovascular death15. Although a systematic review by Velandia et al. that examines over 100 studies on ECG analysis for CVD detection from 2019 to 2025 supports AI-ECG as a promising tool for early detection of CVD, outperforming traditional methods in subclinical detection and wearable monitoring, it also highlights major limitations, including false positives, transparency issues, bias, and a lack of external validation16.
AI in Diagnosis, Imaging, and Monitoring in CVD Detection
In CVD imaging, AI’s potential is also increasingly promising. Echocardiography-based models are able to support automated cardiac function measurements, image classification, and disease detection17. Moreover, AI is being integrated into various cardiac imaging methods, including echocardiography, cardiac CT, cardiac MRI, and nuclear technology. AI improves cardiovascular care through better image analysis, disease detection, and risk prediction18,19. For instance, Poterucha et al. developed a deep learning ECG model trained on over 1 million ECG-echocardiogram pairs to detect structural heart disease. It achieved an AUROC of 85.2%, and was externally validated across multiple institutes, with AUROC performance at around 78-80%20. This supports the potential scalable use of AI in CVD imaging and detection. Moreover, AI in CVD is expanding beyond its clinical setting through wearable devices. AI-integrated wearables enable real-time remote monitoring, early detection, and personalized management of cardiovascular disease through collecting physiological signals such as ECG, heart rate, blood pressure, and activity data21.
Overview of Current Research in Machine Learning and CVD Risk Evaluation
A systematic review by Ahsan and Siddique shows that the most commonly used ML/DL models in machine-learning-based heart disease risk evaluations are CNN, SVM, KNN, ANN/DNNs, decision trees, random forests, GANs, and ensemble methods.22. Banerjee et al. find that many researchers use ensemble models such as Random Forest, Gradient Boosting, XGBoost, and LightGBM because they improve predictive performance through combining multiple learners. The most common approach to training the algorithm is supervised learning, as it trains the algorithm on labeled clinic data to determine whether the patient has cardiovascular disease23. Kumar et al. show that machine learning is capable of supporting early CVD detection through analyzing complex patterns between risk factors, thus improving CVD risk prediction. Despite machine learning’s potential for early heart disease detection, challenges such as an imbalanced dataset, poor transparency, privacy issues, and limited clinical trust remain as barriers for real-world deployment. 24.
Technical bottlenecks and opportunities in research
While AI has shown great potential in enhancing CVD diagnoses, the studies also revealed the algorithm’s limitations. First, due to the limited size of the datasets, many models suffer from overfitting, leading to poor performance on larger or more complex datasets. Moreover, certain algorithms are highly dependent on data quality, such as requiring high-quality and balanced classification data, which can affect the model’s generalization capability. Especially in scenarios involving complex nonlinear relationships, some linear models (like logistic regression) struggle to adequately capture the interactions between variables25.
Research significance and value
The purpose of this study is to evaluate the potential of different machine learning algorithms in CVD risk evaluation. The novel contribution of this study is the reliable comparison of eleven machine learning and deep learning models using 10 clinical predictors. The study jointly considers test discrimination, training-test performance stability, and statistical uncertainty when selecting the optimal model. Moreover, a systematic study of 152 clinical machine learning prediction models found that many lacked proper assessment of overfitting26. This study addresses this problem by assessing the risk of overfitting by comparing the model’s AUC-ROC on the training and test sets, a practice considered when selecting the final model. Lastly, through our selection of 10 clinical predictors that are more accessible in common electronic health records, we improve our model’s practicality in real life, as it may be usable in a wide range of medical settings. As mentioned in the literature review section, AI models have great potential in assisting diagnosis and early intervention of cardiovascular disease due to their ability to analyze complex data and identify subtle CVD risks. Through this study we aim to help provide a foundation for the development of a practical CVD risk intervention and evaluation tool.
Methodology
Artificial intelligence
Data processing
The data used in this study were obtained from the UCI Machine Learning Repository, compiled by David Aha, and included participants ranging from age 29 to 7927. The UCI Heart Disease Dataset is compiled from four distinct databases from various global medical institutions, including Cleveland, Hungary, Switzerland, and Long Beach. The dataset used in this research is the Cleveland dataset, gathered from the Cleveland Clinic Foundation. The Cleveland database is the most used by researchers to date28. The dataset contains 303 patient heart assessment instances covering 14 attributes, including age, gender, type of chest pain, cholesterol levels, and resting ECG results (Table 2.1). After excluding 6 records with missing values, a final dataset of 297 complete entries was left.
The dataset is roughly balanced, with 53.87% of patients having a positive evaluation and the remaining 46.13% having a negative evaluation. Although oldpeak, CA, and thal were previously identified as influential predictors of heart disease, these attributes require specialized diagnostic procedures to obtain. Oldpeak is derived from exercise-induced ST-segment depression, ca shows the number of major vessels identified through fluoroscopy, and thal tests the result of a nuclear stress test27. Due to the specialized testing, these attributes may not be routinely available in patients’ electronic health records or primary-care settings, thus including them may limit the model’s practicality in real-life deployment. Therefore, to evaluate whether strong algorithmic performance can still be maintained with only the accessible feature set, the scope was narrowed to 10 attributes. However, it is important to acknowledge that previous research has shown that these three variables are statistically significant to the model’s output29. Although excluding these variables may limit the influence of these highly predictive features on the model’s predictions, it makes the model more broadly applicable across medical settings due to increased feasibility. The final selected attributes include age, sex, type of chest pain, cholesterol levels, resting ECG, maximum heart rate, exercise-induced angina, slope, fasting blood glucose, and resting blood pressure.
| Characteristics/attributes | Definition | Scope |
| cp | Type of chest pain: [1-typical type 1 angina pectoris 2-atypical angina pectoris 3- non-anginal pain 4-asymptomatic] | 1,2,3,4 |
| sex | Gender of the personnel | 1,0 |
| chol | Serum cholesterol in mg/dl | 126 to 564 |
| fbs | Fasting blood glucose mg/dl | 0,1 |
| restecg | resting electrocardiogram | 0,1,2 |
| thalach | maximal heart rate | 71 to 202 |
| exang | Exercise-induced angina | 0,1 |
| slope | ST segment slope | 1,2,3 |
| age | Age of personnel, years | 29 to 79 years old |
| trestbps | Resting blood pressure, mm Hg | 94 to 200 |
Feature processing was only applied to some models that benefit from it, such as linear models and some tree-based models. Categorical data are encoded using OneHot to enable the model to identify differences in discrete features; numerical data are standardized using StandardScaler to set each feature’s mean to 0 and its standard deviation to 1. This method optimizes the weight balance of numerical features in the model, which helps to enhance the convergence speed and prediction accuracy of the model (Equation 1).
(1) 
Where  is the original value of the feature,
  is the mean of the feature values, and
  is the standard deviation of the feature values.
Model development and evaluation
To evaluate the performance of different machine learning algorithms, 11 classification models were selected. These includes Logistic regression, SVM, KNN, DNN, Random Forest, Decision Tree, XGBoost, Catboost, Light GBM, Gradient Boosting, and AdaBoost. These models were chosen for their diverse algorithmic principles, including linear, non-linear, distance-based, and ensemble learning approaches. All models were trained on the same dataset and evaluated using the same metrics to ensure fairness and comparability. The analysis was conducted using Python 3.12.2, scikit-learn 1.4.2, pandas 2.2.2, NumPy 1.26.4, PyTorch 2.4.1, CatBoost 1.2.3, XGBoost 2.1.2, and LightGBM 4.5.0.
The final 10 selected clinical predictors were used to train the algorithm: age, sex, chest pain type, resting blood pressure, cholesterol, fasting blood glucose, resting electrocardiographic results, maximum heart rate achieved, exercise-induced angina, and ST-segment slope. The outcome variable was the binary classification of cardiovascular disease status. The dataset was divided into training and test sets using an 80/20 split.
The study used two preprocessing strategies. For Logistic Regression, SVM, KNN, and DNN, standardization was used for continuous features, and one-hot encoding was used for categorical features. For tree-based models, such as Random Forest, Decision Tree, XGBoost, CatBoost, LightGBM, Gradient Boosting, and AdaBoost, standardization and one-hot encoding were not used for the features. The held-out test set was not used to fit the preprocessing objects.
Tuning Hyperparameters
To tune hyperparameters, GridSearchCV was used with 10-fold cross-validation and ROC-AUC as the scoring metric, applied only on the 80% training dataset. The selected hyperparameters were evaluated in the test set. The models did not use class weighting, oversampling, undersampling, or early stopping. The final selected model, CatBoost, used a Logloss objective, 100 boosting iterations, a tree depth of 6, a learning rate of 0.01, L2 leaf regularization of 1, MVS bootstrap with a subsample of 0.8, CPU training, and a random seed of 0. Hyperparameters for other machine learning models are shown in Table 2.2.
The DNN was designed as a fully connected feed-forward neural network. The final DNN algorithm used three hidden layers with 32 neurons per hidden layer, ReLU activation, a dropout rate of 0.3, a learning rate of 0.001, a batch size of 32, and 20 training epochs. Sigmoid activation was used for the output layer for binary classification. The model was trained through binary cross-entropy loss and the Adam optimizer, without applying early stopping.
| Model | Selected hyperparameters |
| Logistic Regression | C = 0.1 |
| SVM | C = 0.1; gamma = scale; kernel = linear |
| KNN | metric = Manhattan; n_neighbors = 9; weights = uniform |
| DNN | batch size = 32; dropout rate = 0.3; epochs = 20; hidden size = 32; learning rate = 0.001; number of layers = 3 |
| Random Forest | maximum depth = 5; minimum samples per leaf = 2; minimum samples to split = 10; estimators = 300 |
| Decision Tree | maximum depth = 3; minimum samples per leaf = 5; minimum samples to split = 5 |
| XGBoost | column subsample = 0.8; learning rate = 0.05; maximum depth = 5; estimators = 200; L1 regularization = 1; L2 regularization = 10; subsample = 0.8 |
| CatBoost | depth = 6; iterations = 100; L2 leaf regularization = 1; learning rate = 0.01 |
| LightGBM | learning rate = 0.01; maximum depth = −1; estimators = 100; number of leaves = 20; subsample = 0.8 |
| Gradient Boosting | learning rate = 0.01; maximum depth = 3; minimum samples per leaf = 2; minimum samples to split = 5; estimators = 200; subsample = 0.6 |
| AdaBoost | algorithm = SAMME.R; learning rate = 0.1; estimators = 100 |
Addressing Overfitting
The risk of overfitting was evaluated by comparing the models’ AUCs on the training and test datasets. If the performance gap between the training set and the testing set is too large, it may indicate that the model has “overfit,” meaning it has learned the details of the training data to such an extent that it negatively impacts its performance on new, unfamiliar data. The model with the lowest risk of overfitting would be selected as optimal.
Statistical Uncertainty
Lastly, to address statistical uncertainty, 95% confidence intervals were added for AUC, accuracy, precision, F1-score, and recall. The confidence intervals were calculated through 2000 nonparametric bootstrap resamples of test-set predictions.
Prediction models performance
To evaluate the performance of different machine learning models for CVD risk prediction, this study systematically compared 11 algorithms using AUC, precision, accuracy, recall, and F-1 score. The study prioritized AUC b
ecause it assesses the model’s ability to consistently rank patients with CVD as at higher risk than those without, regardless of the disease threshold. This is important because different hospitals may use different definitions of operating thresholds, depending on the acceptable balance between sensitivity and specificity. Thus, the AUC of a model can still reflect its performance comprehensively even when the disease threshold is changed.
Results
Algorithm Performance
From the results, it can be seen that AUC-ROC (AUC) value of CatBoost is the highest, at 0.936 (Figure 3.1.1). The AUC values for Logistic regression, SVM, KNN, DNN, Random Forest, Decision Tree, XGBoost, CatBoost, LightGBM, Gradient Boosting, and AdaBoost are 0.917, 0.904, 0.896, 0.902, 0.897, 0.848, 0.885, 0.936, 0.874, 0.888, and 0.907 respectively (Table 3.2). Overall, the CatBoost model’s performance was the most optimal, with the AUC score’s difference between training and testing being only 0.002, indicating that the model has strong generalization capability. This means that the model can effectively handle unseen data thereby reducing the risk of overfitting. Moreover, CatBoost performance is relatively high in other metrics as well, having a score of 0.818, 0.750, 0.783, and 83.33% in precision, recall, F1, and test accuracy (Table 3.2).
| Model | Training AUC | Test AUC | Precision | Recall | F1-score | Test accuracy |
| logistic regression | 0.878 | 0.917 | 0.824 | 0.583 | 0.683 | 78.33% |
| support vector machine | 0.876 | 0.904 | 0.778 | 0.583 | 0.667 | 75.00% |
| K Nearest neighbour | 0.872 | 0.896 | 0.778 | 0.667 | 0.667 | 76.67% |
| deep neural network | 0.893 | 0.902 | 0.800 | 0.667 | 0.727 | 80.00% |
| random forest | 0.973 | 0.897 | 0.810 | 0.708 | 0.756 | 81.67% |
| decision tree | 0.874 | 0.848 | 0.667 | 0.667 | 0.667 | 73.33% |
| XGBoost | 0.969 | 0.885 | 0.870 | 0.833 | 0.851 | 88.33% |
| CatBoost | 0.934 | 0.936 | 0.818 | 0.750 | 0.783 | 83.33% |
| LightGBM | 0.912 | 0.874 | 0.750 | 0.625 | 0.682 | 76.67% |
| gradient boosting | 0.961 | 0.888 | 0.826 | 0.792 | 0.809 | 85.00% |
| Ada Boost | 0.918 | 0.907 | 0.810 | 0.708 | 0.756 | 81.67% |
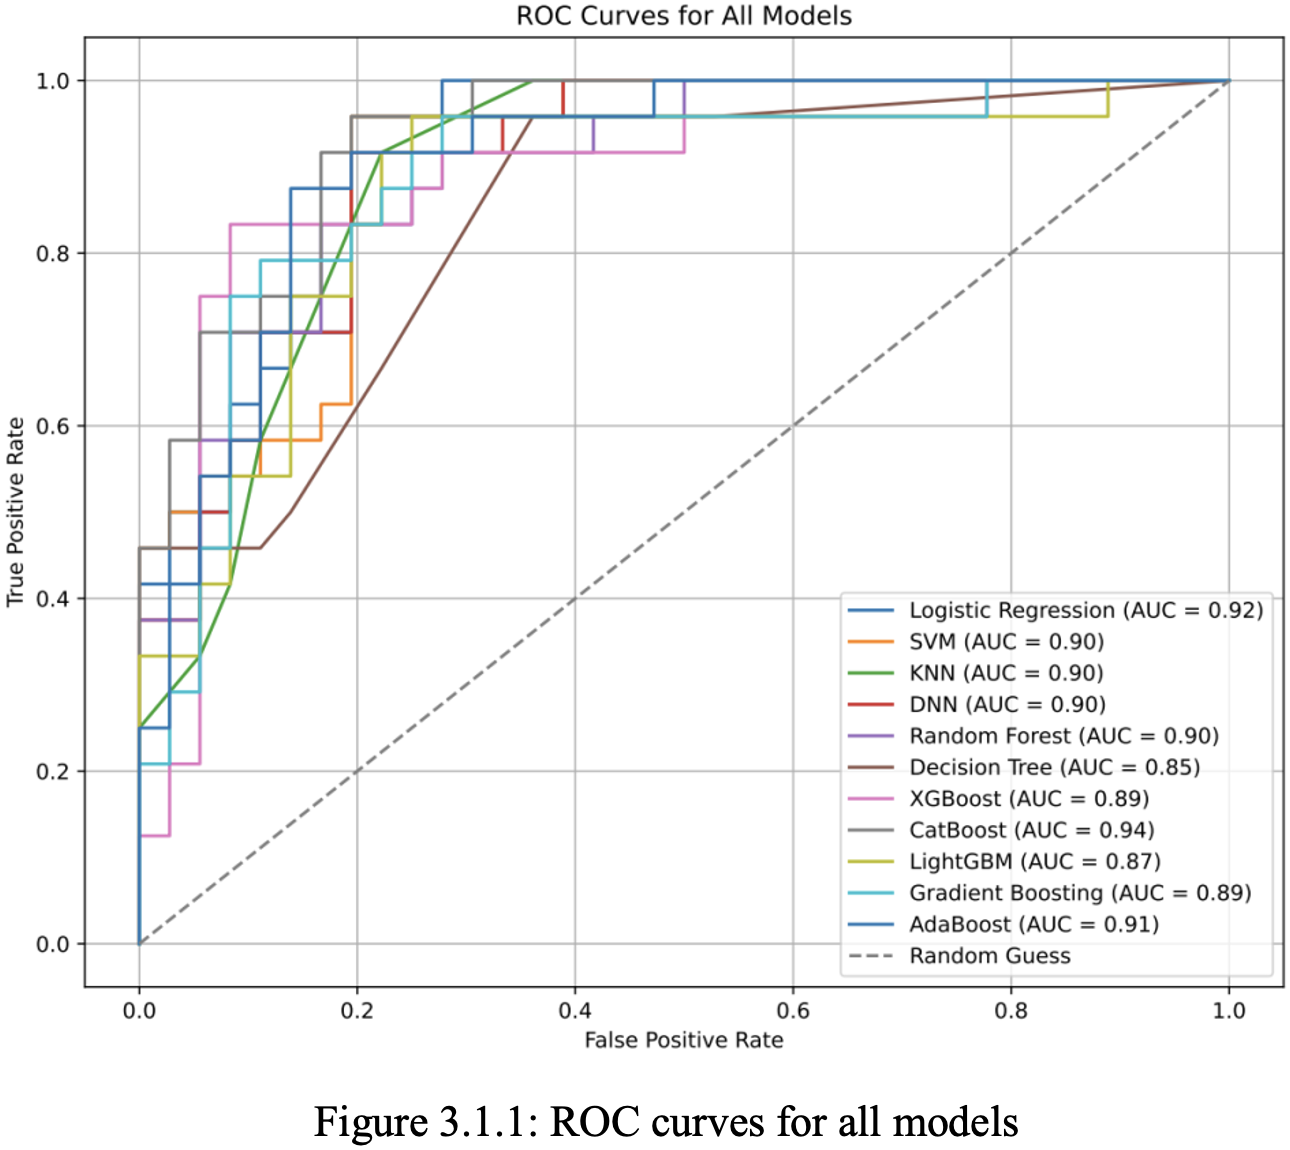
At the same time, the CatBoost model also performs well in terms of accuracy, recall rate, and F1 score, effectively balancing the costs of false positives and false negatives. Additionally, XGBoost and gradient-boosting models perform well, are suitable for handling nonlinear data and complex features, and are widely used.
The significant difference between the training set AUC and the test set AUC indicates that the model is suffering from overfitting. This means that the model is overly reliant on noise and details in the dataset, which can negatively impact its performance when dealing with unseen data. This is particularly evident in random forest, where although the training set exhibits an extremely high AUC value (0.973), the AUC on the test set drops significantly (0.897), indicating a certain degree of overfitting. Logistic regression and SVM models excel in simple linear classification tasks but perform relatively poorly in high-dimensional complex data. This suggests that the patterns identified by random forest perform poorly on new, unseen data. Based on the above analysis, CatBoost model was selected as the core prediction algorithm due to its efficient classification performance and robustness.
| Model | AUC | Accuracy | Precision | Recall | F1 |
| Logistic Regression | 0.917 [0.838, 0.972] | 0.783 [0.683, 0.883] | 0.824 [0.625, 1.000] | 0.583 [0.381, 0.783] | 0.683 [0.488, 0.824] |
| SVM | 0.904 [0.818, 0.965] | 0.750 [0.650, 0.867] | 0.778 [0.538, 0.944] | 0.583 [0.333, 0.739] | 0.667 [0.438, 0.789] |
| KNN | 0.896 [0.807, 0.961] | 0.767 [0.650, 0.867] | 0.778 [0.571, 0.947] | 0.667 [0.375, 0.781] | 0.667 [0.471, 0.815] |
| DNN | 0.902 [0.810, 0.962] | 0.800 [0.650, 0.867] | 0.800 [0.545, 0.923] | 0.667 [0.417, 0.810] | 0.727 [0.500, 0.818] |
| Random Forest | 0.897 [0.807, 0.963] | 0.817 [0.733, 0.917] | 0.810 [0.682, 1.000] | 0.708 [0.520, 0.880] | 0.756 [0.615, 0.894] |
| Decision Tree | 0.848 [0.737, 0.933] | 0.733 [0.617, 0.850] | 0.667 [0.480, 0.852] | 0.667 [0.471, 0.846] | 0.667 [0.500, 0.800] |
| XGBoost | 0.885 [0.784, 0.962] | 0.833 [0.733, 0.917] | 0.870 [0.611, 0.950] | 0.833 [0.609, 0.950] | 0.851 [0.649, 0.898] |
| CatBoost | 0.936 [0.872, 0.980] | 0.833 [0.733, 0.917] | 0.818 [0.640, 0.957] | 0.750 [0.565, 0.913] | 0.783 [0.632, 0.893] |
| LightGBM | 0.874 [0.770, 0.954] | 0.767 [0.667, 0.867] | 0.750 [0.545, 0.923] | 0.625 [0.435, 0.815] | 0.682 [0.500, 0.826] |
| Gradient Boosting | 0.888 [0.799, 0.965] | 0.850 [0.750, 0.933] | 0.826 [0.652, 0.958] | 0.792 [0.619, 0.947] | 0.809 [0.667, 0.912] |
| AdaBoost | 0.907 [0.824, 0.966] | 0.817 [0.717, 0.900] | 0.810 [0.619, 0.955] | 0.708 [0.519, 0.885] | 0.756 [0.588, 0.875] |
Interpretation
CatBoost achieved the highest test AUC, at 0.936, with a 95% CI of [0.872, 0.980]. This shows strong discrimination between CVD-positive and CVD-negative cases. Logistic Regression and AdaBoost also showed high AUC values, with AUCs of 0.917 and 0.907, respectively. XGBoost achieved the highest accuracy and F1-score, with an accuracy of 0.850 [0.750, 0.933] and an F1-score of 0.809 [0.667, 0.912].
Although CatBoost had the strongest AUC point estimate, several models had overlapping confidence intervals. Therefore, the results support CatBoost as a strong-performing model, but they do not support the interpretation that CatBoost is statistically significantly superior to every other model without additional paired model-comparison testing.
Discussion
Summary of research
The purpose of this study is to compare machine learning models and their performance for CVD risk prediction using selected clinical predictors from the UCI Cleveland Heart Disease dataset. Overall, Catboost was selected as the best-performing model, with the highest AUC and strong performance across all metrics. AUC was prioritized because it measures how well a model can discriminate between positive and negative CVD cases across all possible thresholds. This is important because the most appropriate threshold for CVD risk assessment may vary depending on the clinical purpose.
CVD is multifactorial, meaning that the risk often increases through the clustering and interactions of multiple risk factors. Thus, Catboost may have achieved the best performance, as it is a tree-based ensemble model, which can better capture nonlinear patterns and risk factor interactions than simpler models. Logistic regression may not fully capture the complex interactions between CVD risk factors due to the model’s simplistic structure. A single decision tree is at risk of overfitting due to the small dataset and the fact that splits may be strongly influenced by a few observations. KNN is also limited by the small dataset, as it relies on distance calculations that may not accurately represent clinical similarity when the dataset includes both categorical and continuous variables. Additionally, because of the limited dataset, DNN may not have enough training data to learn stable patterns comprehensively.
As mentioned above, the small dataset was a common concern among models as overfitting may occur. Overfitting is when the model performs well on the training dataset but worse on the testing dataset. To evaluate the model’s risk of overfitting, we compared the training AUC and test AUC performance of each model. Catboost had the smallest AUC difference of only 0.00193, showing a low risk of overfitting. This suggests stable internal performance; however, it does not prove the model generalizes clinically.
Moreover, to avoid evaluating a model’s performance from only point estimates, 95% confidence intervals were calculated for AUC, accuracy, precision, recall, and F-1 score. Confidence intervals show the range of plausible model performance. Wider intervals indicate greater uncertainty, while narrower intervals suggest greater certainty. For Catboost, the AUC is 0.936 [0.872, 0.980], indicating strong discrimination, with the interval reflecting uncertainty at that value. Other models, such as logistic regression, have an AUC of 0.917 [0.838, 0.972], and Adaboost has an AUC of 0.907 [0.824, 0.966]. Since several confidence intervals overlap, this suggests that Catboost is the best-performing model based on the point estimate; however, it is not necessarily statistically superior to other models. The uncertainty may be due to a small test set, as it has only around 60 cases from the 80/20 split. This means metrics such as recall and precision can change if a few patients are identified differently.
Study Limitations
Major limitations in this study include a small dataset, which could undermine the training for some algorithms that may outperform Catboost in larger datasets. With an 80/20 split, the test set is smaller, thus some metrics may be unstable. Moreover, the study only utilized internal evaluation without external validation. This was mainly due to constraints on the available resources and time to conduct this external validation. This could undermine the evaluation of whether the algorithm could be realistically deployed in a real-life medical setting. Lastly, the model can only identify statistical associations, and not causal relationships. It is important to note that the model can only be described as assisting in CVD risk prediction, not as a diagnosis.
Research outlook
To further improve our algorithm, we can focus on expanding the training dataset of the algorithm to ensure it can adapt to larger datasets. By increasing the dataset, we can enhance the accuracy and generalization of the model, enabling it to better identify and understand the potential relationships between risk factors. This also helps the model to more accurately identify CVD risks when encountering changes not included in the original dataset.
A next step to this research may be external validation. Though the model CatBoost shows strong performance in internal testing, the algorithm has not been deployed in proper clinical testing, whether its performance can be maintained in real life is still questionable. External validation allows us to assess the model’s performance on a separate dataset collected from a different clinical source. Thus, the study would be able to determine whether the model exhibits strong generalization rather than merely adapting to specific patterns in the UCI Cleveland dataset.
Through the increasing research of machine learning and its use in CVD risk evaluation, the potential for it to assist doctors in diagnosis and early intervention in CVD is slowly realized. However, a bridge of trust still needs to be established between doctors and algorithms for the technology to be deployed in healthcare.
References
- E. O. Lopez, B. D. Ballard, A. Jan. “Cardiovascular Disease.” StatPearls – NCBI Bookshelf, 22 Aug. 2023. https://www.ncbi.nlm.nih.gov/books/NBK535419/. [↩] [↩]
- World Health Organization. Cardiovascular Diseases (CVDs). 31 July 2025, www.who.int/news-room/fact-sheets/detail/cardiovascular-diseases-(cvds). [↩]
- Zhao, Dong. “Epidemiological Features of Cardiovascular Disease in Asia.” JACC Asia, vol. 1, no. 1, June 2021, pp. 1–13. https://doi.org/10.1016/j.jacasi.2021.04.007. [↩]
- Su, Shuyao, and Fangchao Liu. “Cardiovascular Health and Disease Report in China: Two Decades of Progress.” Biomedical and Environmental Sciences, Aug. 2025. https://doi.org/10.3967/bes2025.098. [↩]
- Dahlöf, Björn. “Cardiovascular Disease Risk Factors: Epidemiology and Risk Assessment.” The American Journal of Cardiology, vol. 105, no. 1, Dec. 2009, pp. 3A–9A. https://doi.org/10.1016/j.amjcard.2009.10.007. [↩]
- Karmali, Kunal N., and Donald M. Lloyd-Jones. “Global Risk Assessment to Guide Blood Pressure Management in Cardiovascular Disease Prevention.” Hypertension, vol. 69, no. 3, Jan. 2017, pp. e2–9. https://doi.org/10.1161/hypertensionaha.116.08249. [↩]
- Levine, Jon H. “Managing Multiple Cardiovascular Risk Factors: State of the Science.” Journal of Clinical Hypertension, vol. 8, no. s10, Oct. 2006, pp. 12–24. https://doi.org/10.1111/j.1524-6175.2006.05924.x. [↩]
- Cai, Yue, et al. “Artificial Intelligence in the Risk Prediction Models of Cardiovascular Disease and Development of an Independent Validation Screening Tool: A Systematic Review.” BMC Medicine, vol. 22, no. 1, Feb. 2024, p. 56. https://doi.org/10.1186/s12916-024-03273-7. [↩]
- Singh, Manasvi, et al. “Artificial Intelligence for Cardiovascular Disease Risk Assessment in Personalised Framework: A Scoping Review.” EClinicalMedicine, vol. 73, May 2024, p. 102660. https://doi.org/10.1016/j.eclinm.2024.102660. [↩]
- Liu, Tianyi, et al. “Machine Learning Based Prediction Models for Cardiovascular Disease Risk Using Electronic Health Records Data: Systematic Review and Meta-analysis.” European Heart Journal – Digital Health, vol. 6, no. 1, Oct. 2024, pp. 7–22. https://doi.org/10.1093/ehjdh/ztae080. [↩]
- Wu, Zhenyan, and Caixia Guo. “Deep Learning and Electrocardiography: Systematic Review of Current Techniques in Cardiovascular Disease Diagnosis and Management.” BioMedical Engineering OnLine, vol. 24, no. 1, Feb. 2025, p. 23. https://doi.org/10.1186/s12938-025-01349-w. [↩]
- Siontis, Konstantinos C., et al. “Artificial Intelligence-enhanced Electrocardiography in Cardiovascular Disease Management.” Nature Reviews Cardiology, vol. 18, no. 7, Feb. 2021, pp. 465–78. https://doi.org/10.1038/s41569-020-00503-2. [↩]
- Fernández-Ruiz, Irene. “Artificial Intelligence to Improve the Diagnosis of Cardiovascular Diseases.” Nature Reviews Cardiology, vol. 16, no. 3, Jan. 2019, p. 133. https://doi.org/10.1038/s41569-019-0158-5. [↩]
- Mahayni, Abdulah A., et al. “Electrocardiography-Based Artificial Intelligence Algorithm Aids in Prediction of Long-term Mortality After Cardiac Surgery.” Mayo Clinic Proceedings, vol. 96, no. 12, Dec. 2021, pp. 3062–70. https://doi.org/10.1016/j.mayocp.2021.06.024. [↩]
- Sau, Arunashis, et al. “Artificial Intelligence-enabled Electrocardiogram for Mortality and Cardiovascular Risk Estimation: A Model Development and Validation Study.” The Lancet Digital Health, vol. 6, no. 11, Oct. 2024, pp. e791–802. https://doi.org/10.1016/s2589-7500(24)00172-9. [↩]
- Velandia, Hernando, et al. “Systematic Review of Artificial Intelligence and Electrocardiography for Cardiovascular Disease Diagnosis.” Bioengineering, vol. 12, no. 11, Nov. 2025, p. 1248. https://doi.org/10.3390/bioengineering12111248. [↩]
- Edpuganti, Sudeep, et al. “Artificial Intelligence in Cardiovascular Imaging: Current Landscape, Clinical Impact, and Future Directions.” Discoveries, vol. 13, no. 2, June 2025, p. e211. https://doi.org/10.15190/d.2025.10. [↩]
- Boadla, Marlon E. Rivera, et al. “Multimodal Cardiac Imaging Revisited by Artificial Intelligence: An Innovative Way of Assessment or Just an Aid?” Cureus, vol. 16, no. 7, July 2024, p. e64272. https://doi.org/10.7759/cureus.64272. [↩]
- Barison, Andrea, et al. “Cardiovascular Imaging in 2024: Review of Current Research and Innovations.” European Heart Journal – Imaging Methods and Practice, vol. 3, no. 1, Jan. 2025, p. qyaf066. https://doi.org/10.1093/ehjimp/qyaf066. [↩]
- Poterucha, Timothy J., et al. “Detecting Structural Heart Disease From Electrocardiograms Using AI.” Nature, vol. 644, no. 8075, July 2025, pp. 221–30. https://doi.org/10.1038/s41586-025-09227-0. [↩]
- Gaoudam, N., et al. “Wearable Devices and AI-Driven Remote Monitoring in Cardiovascular Medicine: A Narrative Review.” Cureus, vol. 17, no. 8, Aug. 2025, p. e90208. https://doi.org/10.7759/cureus.90208. [↩]
- Ahsan, Md Manjurul, and Zahed Siddique. Machine Learning-Based Heart Disease Diagnosis: A Systematic Literature Review. arXiv, 14 Dec. 2021, https://doi.org/10.48550/arXiv.2112.06459 [↩]
- Banerjee, Tathagat, and İshak Paçal. “A Systematic Review of Machine Learning in Heart Disease Prediction.” TURKISH JOURNAL OF BIOLOGY, vol. 49, no. 5, Oct. 2025, pp. 600–34. https://doi.org/10.55730/1300-0152.2766. [↩]
- Kumar, Raman, et al. “A Comprehensive Review of Machine Learning for Heart Disease Prediction: Challenges, Trends, Ethical Considerations, and Future Directions.” Frontiers in Artificial Intelligence, vol. 8, May 2025, p. 1583459. https://doi.org/10.3389/frai.2025.1583459. [↩]
- Y. Q. Cai, D. X. Gong, L. Y. Tang, Y. Cai, H. J. Li, T. C. Jing, M. Gong, W. Hu, Z. W. Zhang, X. Zhang, G. W. Zhang. “Pitfalls in Developing Machine Learning Models for Predicting Cardiovascular Diseases: Challenge and Solutions.” Journal of Medical Internet Research, vol. 26, June 2024, p. e47645. https://doi.org/10.2196/47645. [↩]
- Navarro, Constanza L. Andaur, et al. “Risk of Bias in Studies on Prediction Models Developed Using Supervised Machine Learning Techniques: Systematic Review.” BMJ, vol. 375, Oct. 2021, p. n2281. https://doi.org/10.1136/bmj.n2281. [↩]
- Latha, C. Beulah Christalin, and S. Carolin Jeeva. “Improving the Accuracy of Prediction of Heart Disease Risk Based on Ensemble Classification Techniques.” Informatics in Medicine Unlocked, vol. 16, 2019, p. 100203. https://doi.org/10.1016/j.imu.2019.100203. [↩] [↩] [↩]
- Teja, M. Darshan, and G. Mokesh Rayalu. “Optimizing Heart Disease Diagnosis With Advanced Machine Learning Models: A Comparison of Predictive Performance.” BMC Cardiovascular Disorders, vol. 25, no. 1, Mar. 2025, p. 212. https://doi.org/10.1186/s12872-025-04627-6. [↩]
- Talin, Iffat Ara, et al. “Finding the Influential Clinical Traits That Impact on the Diagnosis of Heart Disease Using Statistical and Machine-learning Techniques.” Scientific Reports, vol. 12, no. 1, Nov. 2022, p. 20199. https://doi.org/10.1038/s41598-022-24633-4. [↩]