
Abstract
Network neuroscience suggests that aspects of neurodegenerative disease progression can be explained by changes in how brain regions communicate, rather than solely by local neuronal damage. Traditional molecular models focused on amyloid and tau pathology have limited ability to explain variability in symptom timing, rate of cognitive decline, and cognitive reserve. The goal of this narrative review is to evaluate whether dynamic functional connectivity (DFC), as evidenced by resting-state fMRI, may serve as a candidate biomarker feature for mild cognitive impairment (MCI) and Alzheimer’s disease (AD). A peer-reviewed literature search was performed using PubMed, Google Scholar, Web of Science, and ScienceDirect with keywords including time-varying connectivity, dynamic functional connectivity, resting-state fMRI, MCI, AD, default mode network, graph-theoretical methods of connectivity assessment, and machine-learning algorithms used for classification of neuroimaging data. Studies were selected based on assessment of dynamic brain connectivity, disease stage, degree of cognitive decline, and/or comparison with static connectivity, structural MRI, or molecular biomarkers. Although this review focuses mainly on studies involving MCI and AD, broader claims about neurodegenerative disease are treated cautiously. Across the studies examined within this review, network flexibility, time-dependent variability, and global efficiency of brain networks were frequently reported as reduced in individuals diagnosed with MCI or AD. The existing research base is insufficient to support dynamic functional connectivity as a validated biomarker that can be reliably used clinically. Before DFC-derived measures can be employed clinically, longitudinal validation, methodological standardization, independent replication in external samples, and comparisons with well-established biomarkers will be needed.
Keywords: Dynamic functional connectivity, Resting-state fMRI, Alzheimer’s disease, Mild cognitive impairment, Default mode network, Connectomics, Graph theory, Machine learning neuroimaging
Introduction
Neurodegenerative conditions are being viewed increasingly as a network disorder of large scale communication among neurons; thus not solely as local damage to one area of the brain1,2. The classical pathological framework has focused upon various molecular hallmarks of disease, including amyloid-β deposition and neurofibrillary tangle formation with tau3,4. Molecular pathology alone does not account for the variation in how quickly patients decline cognitively, how variable symptoms can be, and how different each patient’s rate of disease progression is5. Recent neuroimaging studies support the viewpoint that neurodegenerative conditions disrupt progressively distributed cortical networks involved in integrating information from multiple sensory inputs6.
It is proposed in current studies of modern connectomes that many neurodegenerative disorders selectively disrupt hub areas where communication across variously dispersed networks is coordinated7. The structural complexity and metabolically demanding role of hub regions may make them especially vulnerable within network-level disease models. These vulnerabilities may interact with cellular and molecular disruptions associated with neurodegenerative disease, including oxidative stress, mitochondrial dysfunction, and abnormal protein accumulation8. Rather than indicating that hub regions are always the first or primary sites of brain damage, this interpretation suggests that their high connectivity and metabolic burden may make them more vulnerable within the broader process of disease progression. Several large-scale neuroimaging collaborations have shown that those brain regions that have a high degree of “centrality” or importance in terms of their role in the connectome tend to experience the earliest signs of disease-related pathology9. This supports the hypothesis that some neurodegenerative disease processes may progress along the organizational structure of the brain’s connectome10.
Hub vulnerability and white matter damage are related because highly connected hub regions require long-distance structural connections to coordinate communication with other brain regions. Structural network studies suggest that anatomical connectivity patterns provide important context for understanding later functional disorganization in neurodegenerative disease11,12. Because these tracts support communication between high-interaction cortical regions, anatomical disconnection may contribute to later functional disorganization by reducing the efficiency of signal transmission across cortical networks12.
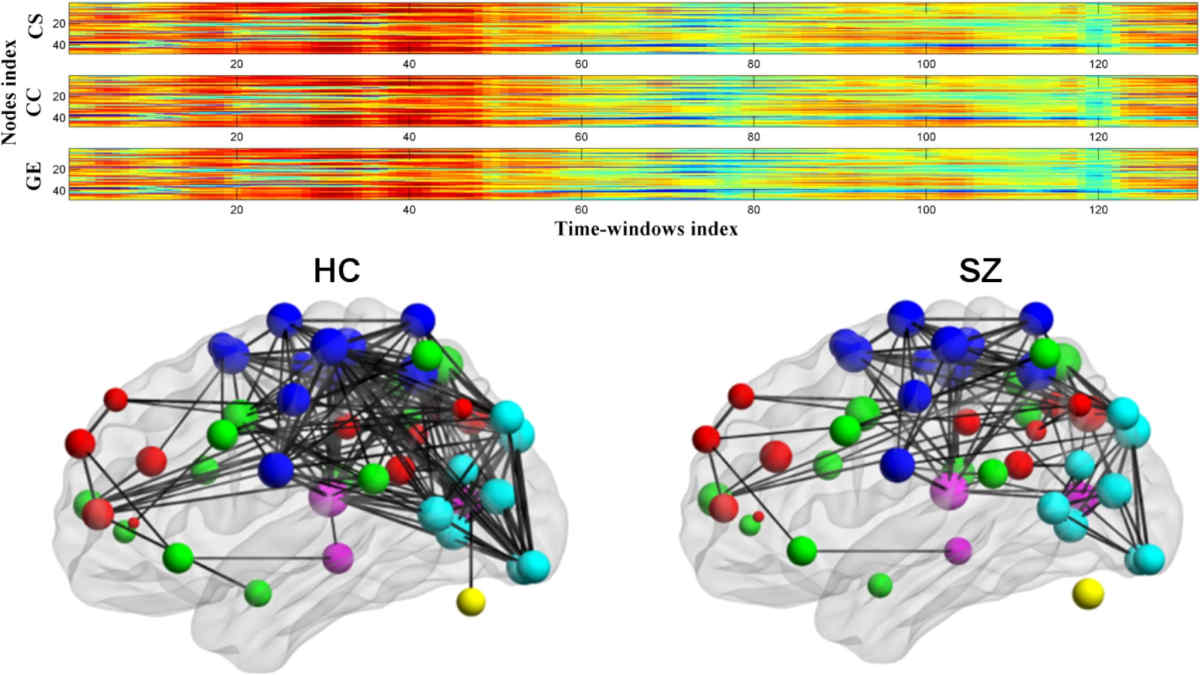
Functional Magnetic Resonance Imaging (fMRI), when done while resting (rs-fMRI), can measure fluctuations in the BOLD signal that occur at rest13. The BOLD signals are used to identify intrinsic connectivity networks; this is an example of functional connectivity where synchronized activity exists in functionally different areas of the brain and represents one way researchers study how large-scale organizations exist within the brain14. Dynamic functional connectivity captures changes in network organization over time, as summarized in Figure 1.
Resting state imaging, in particular, has the advantage of examining neurodegenerative diseases without requiring the subject to complete a task (performance). Instead, resting-state fMRI examines the “spontaneous” oscillations of neural activity as they occur naturally during rest18.
In addition, Independent Component Analysis (ICA) is commonly employed to identify and isolate resting-state networks such as the Default Mode Network, the Salience Network and the Executive Control Network19,20.
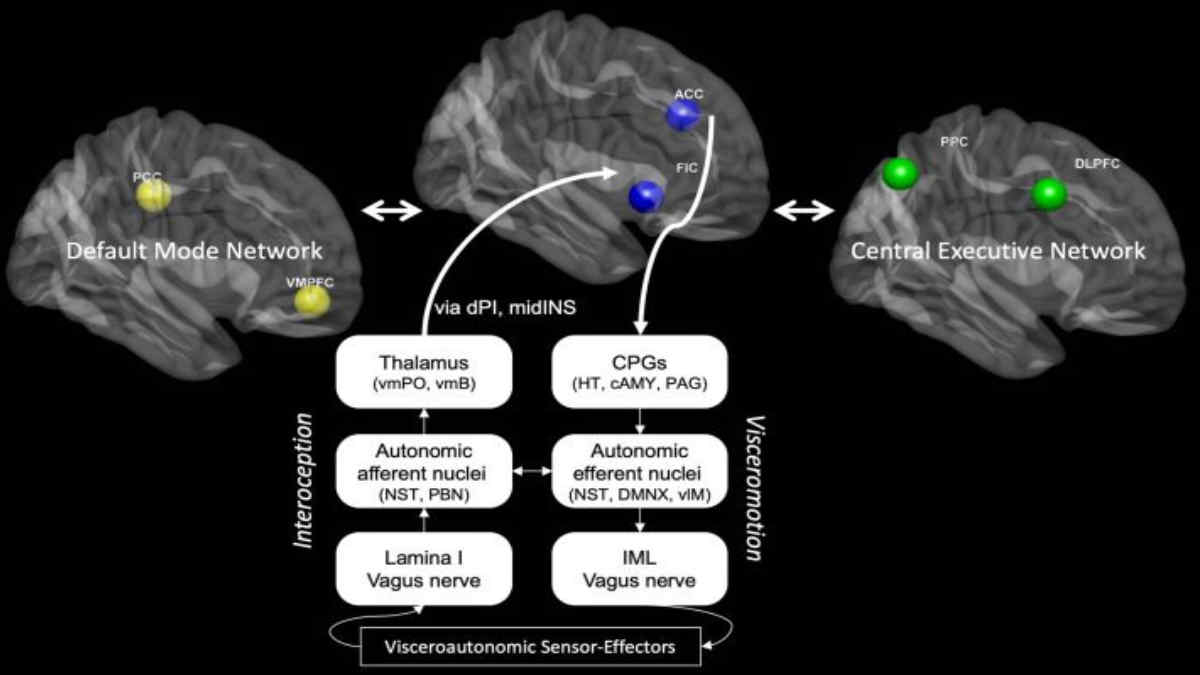
Among all of the intrinsic brain systems, one of the most vulnerable to early pathological processes is the default mode system21. Alterations within the default mode network have been reported in normal aging, individuals at risk for Alzheimer’s disease, mild cognitive impairment, and Alzheimer’s disease22,23,24,25. These findings suggest that neurodegeneration may be best understood as a progressive connectome-level disorder characterized by breakdown of communication efficiency across distributed neural circuits26. The large-scale systems most relevant to this review are shown in Figure 2.
Although DFC methods remain methodologically debated, apparent time-varying connectivity may be influenced by factors such as sliding-window length, motion artifacts, physiological noise, parcellation choice, global signal regression, and assumptions about whether connectivity is truly changing over time27,28. Therefore, caution is needed when interpreting DFC findings as evidence for biomarker use.
This review focuses on dynamic functional connectivity (DFC), a resting-state functional magnetic resonance imaging (rs-fMRI) approach that examines how functional relationships among brain regions vary over time rather than relying on a single static connectivity estimate across the entire scan. The purpose is not to suggest that DFC has already been established as a clinical biomarker, but to examine whether DFC-derived measures may serve as candidate research features for detecting or monitoring network-level changes in individuals with mild cognitive impairment and early Alzheimer’s disease.
Methods
A narrative literature review with a structured search strategy was conducted to evaluate whether dynamic functional connectivity has been studied as a candidate research feature associated with mild cognitive impairment and Alzheimer’s disease progression. Searches were conducted in 2025 for peer-reviewed studies published between 2004 and 2020. A literature search was conducted across PubMed, Google Scholar, Web of Science, and ScienceDirect. The search strategy used the following Boolean logic: (“dynamic functional connectivity” OR “time-varying functional connectivity”) AND (“mild cognitive impairment” OR “Alzheimer’s disease” OR “neurodegeneration”); (“resting-state fMRI” OR “functional connectivity”) AND (“default mode network” OR “salience network” OR “executive control network”) AND (“Alzheimer’s disease” OR “mild cognitive impairment”); and (“graph theory” OR “machine learning”) AND (“neuroimaging” OR “functional connectivity”) AND (“Alzheimer’s disease” OR “mild cognitive impairment”). Reference lists of relevant review articles and included studies were also screened to identify additional eligible sources.
Because the central focus of this review is dynamic functional connectivity in mild cognitive impairment and Alzheimer’s disease, structural imaging studies were included only when they provided background information about network-level vulnerability, white matter disruption, or comparisons with functional connectivity findings. Structural MRI, diffusion tensor imaging (DTI), and tractography studies were not treated as primary evidence for validating DFC as a clinical biomarker unless they were directly connected to functional connectivity, disease staging, or multimodal neuroimaging comparisons.
Studies were excluded if they were not peer reviewed, were not published in English, did not involve human neuroimaging or directly relevant dynamic functional connectivity methodology, focused only on non-neurodegenerative conditions without methodological relevance to DFC, or did not address functional connectivity, structural connectivity, disease stage, cognitive decline, or neuroimaging-based classification. Structural-only studies were excluded unless they provided relevant background on network vulnerability, white matter disruption, or multimodal imaging comparisons with functional connectivity findings.
Time-varying changes in functional connectivity were selected for review because they directly addressed the central focus of this review: whether measures derived from DFC are associated with network-level changes in mild cognitive impairment and Alzheimer’s disease, and whether these measures provide useful research-level information about disease stage, cognitive decline, or progression. Graph-theoretical studies were included when they provided network-level context for functional connectivity changes, but they were not given formal weighting over DFC-focused studies.
Studies were not treated as having equal evidentiary strength. Greater interpretive emphasis was placed on studies that specifically evaluated mild cognitive impairment or Alzheimer’s disease, clearly identified disease stage, used human neuroimaging data, explained their connectivity methods, and included quantitative comparisons, longitudinal information, diagnostic performance metrics, or prognostic performance metrics. Methodological reviews and structural imaging studies were generally used for background, comparison, or interpretation rather than as primary evidence for establishing DFC as a validated clinical biomarker.
For each included study, extracted information included participant demographics, sample size, disease group, disease stage, neuroimaging modality, functional connectivity method, brain regions or networks examined, statistical approach, and main connectivity findings. When available, information was also recorded on diagnostic biomarker performance, prognostic prediction of cognitive decline, longitudinal analysis, and comparisons with structural imaging or molecular biomarkers.
Because the reviewed studies differed in disease stage, imaging modality, DFC method, network metric, and reported outcome measures, a quantitative meta-analysis was not conducted. Instead, the findings were integrated using a qualitative narrative thematic synthesis. Studies were categorized by disease focus, neuroimaging method, connectivity metric, and whether they provided direct evidence from mild cognitive impairment or Alzheimer’s disease, methodological support, or broader comparative context. Each study was also grouped by methodology, including sliding-window correlation, independent component analysis, seed-based connectivity analysis, graph-theoretical modeling, and machine-learning classification, to compare how different methods identified connectivity abnormalities.
Results
The results are organized to distinguish evidence directly involving mild cognitive impairment and Alzheimer’s disease from broader methodological or analogous DFC evidence drawn from non-neurodegenerative conditions. The studies identified in the literature review covered mild cognitive impairment (MCI), Alzheimer’s disease (AD), functional connectivity disruption, graph-theoretical network changes, and neuroimaging-based classification. Findings varied across studies based on disease stage, imaging modality, connectivity metric, and whether the study design was cross-sectional, longitudinal, or classification-based. Therefore, this Results section summarizes common patterns reported in the literature, including disease-related alterations in connectivity, commonly affected networks, graph-theoretical findings, and limitations in the reporting of diagnostic or prognostic performance metrics.
AD and MCI Evidence
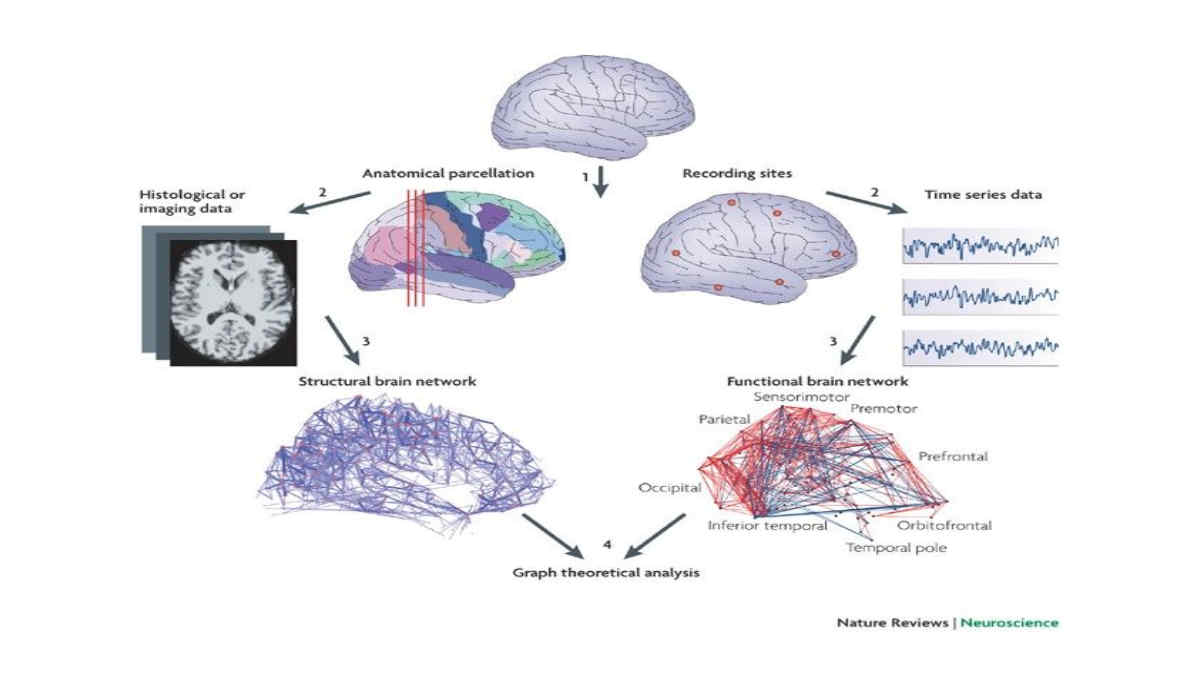
Several studies report altered patterns of connectivity across mild cognitive impairment (MCI) and Alzheimer’s disease populations29. Connectivity within the default mode network (DMN) was identified as a common area of altered connectivity among MCI and AD patients21,22. Reduced connectivity and synchronization between the posterior cingulate cortex and hippocampal regions have been linked to memory-related dysfunction and cognitive decline in mild cognitive impairment and Alzheimer’s disease30,31,32,33,34,35. Numerous research studies have documented reduced coherence between the medial temporal lobe (MTL) structures and posterior cortical regions indicating disrupted long-range communication34. Impaired coordination of the hippocampus and the posterior cingulate cortex has also been associated with poor episodic memory performance and lower efficacy for integrating new information into an individual’s knowledge base36,35. Functional connectivity analyses have reported altered dynamic functional connectivity in mild cognitive impairment and Alzheimer’s disease, although the direction, magnitude, and diagnostic significance of these findings vary across methods and cohorts17. These graph-theoretical measures are illustrated in Figure 3. Together, these measures provide a simplified way to describe network-level disruption, but they should be interpreted as supportive network-context evidence rather than direct proof that DFC is a validated clinical biomarker.
Dynamic Connectivity and Network-State Findings
In this context, metastability refers to the brain’s ability to shift flexibly among multiple connectivity patterns rather than remaining fixed in a single state. Dwell time refers to the amount of time a network remains in one connectivity configuration before transitioning to another. Small-world organization describes a network structure that balances local specialization with efficient long-distance communication, while modularity refers to the extent to which a network is divided into distinct but interacting modules2,39. Time-resolved analyses have also been used to track whole-brain connectivity patterns, identify recurring resting-state network configurations, and classify dynamic connectivity states40,41,42.
Functional connectivity networks can transition quickly through different connectivity states in healthy individuals, whereas MCI subjects demonstrate longer periods of time spent in a single state15. Temporal variability in connectivity is generally reduced in those that are less cognitively flexible16. Healthy individuals usually display a pattern of metastable connectivity which is indicative of constant transitions among different network configurations43. Reduced metastability has been interpreted in the literature as reflecting less flexible coordination of neural resources across changing cognitive demands43,16.
Several graph-theoretical studies suggest that individuals experiencing early cognitive decline may show lower global efficiency and altered small-world organization compared with cognitively healthy adults37,44,38. Hub regions such as the hippocampus and posterior cingulate cortex have been discussed in the literature as important regions for efficient information transfer across interconnected brain networks9.
Across the studies examined in this review, the most frequently reported direction of change involved reduced or altered connectivity within memory-related and large-scale association networks, including the default mode network and hippocampal-cortical circuitry, as well as graph-theoretical measures such as global efficiency and small-world organization. However, the reviewed literature did not consistently report comparable effect sizes, diagnostic thresholds, or standardized performance metrics across MCI and Alzheimer’s disease studies. Therefore, findings were summarized primarily by direction of network change, disease stage, imaging method, and whether the evidence came from MCI/Alzheimer’s disease cohorts or broader methodological studies.
Discussion
Numerous large-scale studies of brain connectivity demonstrate that the way in which neurodegenerative injury develops can reflect the topological characteristics of existing brain networks as opposed to being distributed at random throughout disparate areas of the brain1,2,5. Brain “hubs” are typically characterized by a very high level of interconnectivity; such hubs frequently serve cross-cortical communication functions and also have higher levels of energy expenditure than other parts of the brain7,8. The network approach offers an explanation for how early stages of neurodegenerative diseases can initially manifest through impairments in several different cognitive domains, including memory, attention, and executive functioning, while still recognizing that molecular and structural pathophysiology remains central to disease progression6,26.
Emerging disease-progression models suggest that anatomical pathways and structural connections may influence how pathological proteins spread across neural systems4. In theory, regions with higher resting energy consumption may be affected earlier because they may be more vulnerable to oxidative stress, mitochondrial dysfunction, and related cellular stressors8. This supports the use of network-level approaches to examine patterns of structural and functional disruption alongside molecular and anatomical markers of disease10,45. These network-level patterns provide the background for considering whether time-varying functional connectivity measures can capture disease-related changes that may not be fully described by static connectivity alone. Dynamic functional connectivity (DFC), which refers to changes in connectivity between brain regions over time, has also been studied in relation to neurodegenerative disease assessment. Unlike static connectivity approaches, DFC allows researchers to examine how network relationships fluctuate across time rather than relying on one averaged connectivity estimate46. In mild cognitive impairment and Alzheimer’s disease, decreased temporal variability and increased time in less adaptive connectivity patterns have been investigated as possible indicators of reduced network adaptability17. The default mode network and hippocampal-cortical connections are especially relevant to early cognitive decline because they support memory encoding, retrieval, and integration21,30. However, it remains premature to treat DFC as a reliable diagnostic tool because methodological consistency and clinical utility have not yet been established across the reviewed studies.
Dynamic Functional Connectivity (DFC) is better viewed as a candidate biomarker feature than as an established clinical biomarker. To be a valid clinical biomarker, there must be strong, consistent evidence to support its use as either a diagnostic or prognostic marker, which can include metrics such as sensitivity, specificity, ROC-AUC, positive and negative predictive values, independent external validation and the incremental value provided over other existing methods such as structural MRI, amyloid/tau biomarkers, APOE genotype, cognitive testing and static functional connectivity47. Across the studies examined in this review, some DFC-derived measures were associated with mild cognitive impairment and Alzheimer’s disease. However, due to the heterogeneity of the methodologies used, variability in reported performance metrics, and lack of longitudinal validation across multiple studies, the reviewed evidence does not support DFC as ready for standard-of-care clinical diagnosis or prediction46,28. Before DFC-derived findings can be interpreted as clinically meaningful, it is necessary to consider the methodological limitations that affect how dynamic connectivity is measured and compared across studies.
Methodological Limitations of DFC
The dynamic functional connectivity (DFC) findings should be interpreted in light of several methodological constraints. Sliding-window analysis can be sensitive to window size, the number of estimated states, and assumptions about whether observed BOLD correlations reflect true neural transitions rather than statistical or physiological variability27. In addition to sliding-window parameters, motion artifacts, physiological noise, parcellation choice, temporal filtering, band-pass filtering, and global signal regression can all influence estimated connectivity patterns19,46. Leonardi et al. further caution that sliding-window correlation methods may yield spurious fluctuations if methodological constraints are not carefully controlled28. Because studies use different preprocessing pipelines and DFC metrics, direct comparison across cohorts remains difficult. These issues do not negate the potential utility of DFC, but they limit the strength of claims that DFC is ready for clinical biomarker use. More statistically structured approaches, such as hidden Markov models and carefully validated graph-theoretical metrics, may improve reliability; however, these approaches still require replication in larger longitudinal cohorts of individuals with neurodegenerative disease15,7. These methodological limitations are directly relevant to the question of whether DFC should be viewed as a validated biomarker or as a candidate research feature.
Status as Candidate Biomarker and Clinical Utility
| Study | Disorder / stage | DFC-related metric or method | Study design | Comparison with static / structural / molecular biomarkers | Diagnostic or prognostic performance reported? | Incremental value of DFC shown? | Basis for early-stage claim | Biomarker status |
|---|---|---|---|---|---|---|---|---|
| Fiorenzato et al. 2020 | Neurodegenerative disease cohort | Dynamic connectivity alterations | Cross-sectional / group comparison | Not consistently compared with molecular biomarkers or structural MRI as competing clinical biomarkers | Group-level DFC alterations reported; clinical validation metrics not sufficient to establish DFC as a clinical biomarker | Not established | Based mainly on disease stage at scan time; longitudinal temporal ordering not established | Candidate research feature only |
| Preti et al. 2017 | General DFC methodology | Time-varying functional connectivity methods | Review / methodological synthesis | Not a direct clinical biomarker comparison study | Diagnostic or prognostic performance metrics not established | Not established | Methodological review; not direct evidence of early neurodegenerative progression | Methodological foundation only |
| Leonardi et al. 2015 | General DFC methodology | Sliding-window correlation and spurious dynamic fluctuations | Methodological study | Not a clinical biomarker comparison study | Warns that apparent dynamic fluctuations can be artifactual if methodological constraints are insufficient | Not established | Methodological caution; not direct evidence of early neurodegenerative progression | Cautionary methodological evidence |
| Brier et al. 2012 | Alzheimer’s disease | Default mode network functional connectivity | Cross-sectional disease comparison | Static functional connectivity focus | Disease-related connectivity differences reported; DFC-specific diagnostic performance not established | Not assessed for DFC | Based on disease group/stage rather than DFC-specific longitudinal prediction | Static FC evidence, not validated DFC biomarker evidence |
| Sheline et al. 2010 | Alzheimer’s disease / amyloid burden | DMN connectivity and amyloid burden | Cross-sectional association study | Includes association with amyloid burden | Association between DMN connectivity and amyloid burden reported; DFC-specific diagnostic performance not established | Not assessed for DFC | Supports association with amyloid burden but not DFC-specific temporal ordering | Molecular/static FC association, not validated DFC biomarker evidence |
| Tijms et al. 2013 | Alzheimer’s disease | Network topology / graph-theoretical measures | Disease comparison study | Network topology rather than direct DFC clinical comparison | Altered network topology reported; DFC-specific clinical performance metrics not established | Not established for DFC | Supports network disruption in Alzheimer’s disease but not DFC-specific early prediction | Network-level disease evidence, not validated DFC biomarker evidence |
| Arbabshirani et al. 2017 | Brain disorders broadly | Single-subject prediction using neuroimaging features | Review / predictive-modeling synthesis | Discusses machine-learning prediction using neuroimaging features | Performance metrics vary across studies; DFC-specific clinical validity and independent incremental value are not consistently isolated | Not established for DFC | Predictive-modeling review; DFC-specific early-stage claim not established | Predictive-modeling support, not DFC clinical validation |
| Bron et al. 2020 | Alzheimer’s disease / MCI classification | Deep-learning classification | Review / classification-focused synthesis | Often includes structural or multimodal imaging features | Classification performance discussed, but DFC-specific clinical validity and incremental value are not established | Not established for DFC | Classification-focused review; DFC-specific early-stage claim not established | Research-level classification evidence |
Future work incorporating multimodal neuroimaging techniques could help elucidate how cortical thinning, structural disconnection, and functional brain abnormalities interact as disease progresses48,49,50. Using a combination of resting state functional connectivity, diffusion MRI, cortical thinning measures, and molecular imaging biomarkers may increase the ability to predict an individual’s likelihood of experiencing rapid cognitive decline47,51. Multi-modal assessments could also identify complementary aspects of both anatomical disconnections and abnormal neuronal signal processing (dynamics)52.
The standardization of preprocessing methodologies, including motion-correction algorithms, temporal-filter parameters, network definitions, and connectivity metrics, is critical to reduce variability and enhance study-to-study replicability19. The differences in motion correction algorithms, temporal filter parameterizations, and definitions of networks used in studies have been major contributors to variability in results reported across the literature. A consensus on pre-processing techniques may increase the direct comparability of data sets and support future evaluation of connectivity measures in translational research13.
Longitudinal data sets will be especially helpful in discovering if changes in connectivity can indicate with a degree of reliability that a person’s condition is likely to deteriorate in the near future53. Identifying similar patterns of instability across independent cohorts could help determine whether connectivity measures have reliable predictive value before they are considered for clinical diagnostic use54.
Further advancements in machine learning and computational neuroscience could allow for more personalized risk assessment based on an individual’s connectome47,55,54. These cited works support neuroimaging classification and prediction at the research level, but they do not establish either DFC or machine-learning-based connectomic models as standard-of-care biomarkers. Furthermore, there is insufficient clinical trial evidence demonstrating that early detection using DFC-based methods results in interventions that slow neurodegeneration. Therefore, additional evaluations should determine whether DFC-derived measures provide meaningful predictive value beyond current biomarkers before they are used as part of clinical decision-making.
Conclusion
Dynamic functional connectivity represents a useful research approach for studying time-varying alterations in brain networks associated with mild cognitive impairment and Alzheimer’s disease. Across the reviewed literature, DFC-related measures have been associated with altered temporal variability, reduced network adaptability, and disruptions in large-scale brain systems, including the default mode network and hippocampal-cortical circuitry. However, DFC is best understood as a candidate biomarker feature rather than a validated clinical biomarker. Future studies will need to provide longitudinal validation of DFC-derived measures, standardized preprocessing methods, independent replication across datasets, and direct comparisons with established structural, molecular, genetic, and cognitive biomarkers before DFC-derived features are considered for clinical use.
References
- Sporns O. The human connectome: a complex network. Annals of the New York Academy of Sciences. 2011 [↩] [↩]
- Bullmore E, Sporns O. Complex brain networks: graph theoretical analysis of structural and functional systems. Nature Reviews Neuroscience. 2009 [↩] [↩] [↩]
- Buckner RL et al. Molecular, structural, and functional characterization of Alzheimer’s disease. Journal of Neuroscience. 2005 [↩]
- Jagust W. Imaging the evolution and pathophysiology of Alzheimer disease. Nature Reviews Neuroscience. 2018 [↩] [↩]
- Bassett DS, Sporns O. Network neuroscience. Nature Neuroscience. 2017 [↩] [↩]
- Buckner RL, Andrews-Hanna JR, Schacter DL. The brain’s default network. Annals of the New York Academy of Sciences. 2008 [↩] [↩]
- Rubinov M, Sporns O. Complex network measures of brain connectivity: uses and interpretations. NeuroImage. 2010 [↩] [↩] [↩]
- Achard S, Bullmore E. Efficiency and cost of economical brain functional networks. PLoS Computational Biology. 2007 [↩] [↩] [↩]
- Sporns O, Betzel RF. Modular brain networks. Annual Review of Psychology. 2016 [↩] [↩]
- Bassett DS, Bullmore ET. Small-world brain networks. The Neuroscientist. 2006 [↩] [↩]
- He Y et al. Small-world anatomical networks. Cerebral Cortex. 2007 [↩]
- Chen X et al. Disrupted network efficiency in Alzheimer’s disease. Brain Connectivity. 2013 [↩] [↩]
- Friston KJ. Functional and effective connectivity: a review. Brain Connectivity. 2011 [↩] [↩]
- Raichle ME. The brain’s default mode network. Annual Review of Neuroscience. 2015 [↩]
- Vidaurre D et al. Discovering dynamic brain networks. PNAS. 2017 [↩] [↩] [↩]
- Calhoun VD et al. The chronnectome. Neuron. 2014 [↩] [↩] [↩]
- E. Fiorenzato et al., Dynamic functional connectivity changes associated with dementia in Parkinson’s disease. Brain. 2019;142(9):2860–2872. doi:10.1093/brain/awz192. [↩] [↩] [↩]
- Damoiseaux JS. Resting-state fMRI as a biomarker for Alzheimer’s disease. Alzheimer’s Research & Therapy. 2012 [↩]
- Smith SM et al. Network modelling methods for fMRI. NeuroImage. 2011 [↩] [↩] [↩]
- Andrews-Hanna JR et al. Functional-anatomic fractionation of the brain’s default network. Neuron. 2010 [↩]
- Greicius MD et al. Default-mode network activity distinguishes Alzheimer’s disease. PNAS. 2004 [↩] [↩] [↩]
- Sheline YI et al. Default mode network connectivity and amyloid burden. PNAS. 2010 [↩] [↩] [↩]
- Sorg C et al. Selective changes of resting-state networks in individuals at risk for Alzheimer’s disease. PNAS. 2007 [↩]
- Damoiseaux JS et al. Reduced resting-state brain activity in the default network in normal aging. PNAS. 2008 [↩]
- Brier MR et al. Loss of intranetwork connectivity in Alzheimer’s disease. Journal of Neuroscience. 2012 [↩]
- Pievani M et al. Functional network disruption in the degenerative dementias. Lancet Neurology. 2011 [↩] [↩]
- Hutchison RM et al. Dynamic functional connectivity. NeuroImage. 2013 [↩] [↩]
- Leonardi N et al. Spurious fluctuations in dynamic connectivity. NeuroImage. 2015 [↩] [↩] [↩]
- Hafkemeijer A et al. Imaging the default mode network in aging and dementia. Biochimica et Biophysica Acta. 2012 [↩]
- Wang L et al. Altered hippocampal connectivity in mild cognitive impairment. Human Brain Mapping. 2006 [↩] [↩]
- Li H et al. Abnormal hippocampal connectivity patterns. Brain Connectivity. 2012 [↩]
- Lee MH et al. Disrupted hippocampal functional connectivity. Neurobiology of Aging. 2014 [↩]
- Bai F et al. Abnormal hippocampal connectivity in MCI. Journal of Alzheimer’s Disease. 2015 [↩]
- Jones DT et al. Functional connectivity alterations in hippocampal circuits. NeuroImage Clinical. 2018 [↩] [↩]
- Sohn WS et al. Progressive hippocampal network changes. Brain Imaging and Behavior. 2020 [↩] [↩]
- Buckner RL. Memory and the hippocampus. Neuron. 2004 [↩]
- Tijms BM et al. Alzheimer’s disease network topology. Cerebral Cortex. 2013 [↩] [↩]
- Stam CJ et al. Graph theoretical analysis of dementia. NeuroImage. 2012 [↩] [↩]
- Wang J et al. Graph theoretical analysis of functional brain networks. PLoS ONE. 2010 [↩]
- Allen EA et al. Tracking whole-brain connectivity dynamics. Cerebral Cortex. 2014 [↩]
- Zalesky A et al. Time-resolved resting-state networks. PNAS. 2014 [↩]
- Rashid B et al. Dynamic connectivity states classification. Frontiers in Neuroscience. 2016 [↩]
- Shine JM et al. Dynamic network communication. Nature Neuroscience. 2016 [↩] [↩]
- Dai Z et al. Altered small-world network topology. Human Brain Mapping. 2015 [↩]
- Tijms BM et al. Pathological connectomics. NeuroImage Clinical. 2018 [↩]
- Preti MG et al. Dynamic functional connectivity: state-of-the-art. NeuroImage. 2017 [↩] [↩] [↩]
- Arbabshirani MR et al. Single subject prediction of brain disorders. NeuroImage. 2017 [↩] [↩] [↩]
- Dickerson BC et al. MRI derived cortical thinning in AD. Cerebral Cortex. 2009 [↩]
- Zhang D et al. Multimodal classification of Alzheimer’s disease. NeuroImage. 2011 [↩]
- Li H et al. Multimodal neuroimaging classification. Frontiers in Neuroscience. 2018 [↩]
- Vieira S et al. Using machine learning in neuroimaging. NeuroImage. 2017 [↩]
- Suk HI et al. Deep learning for neuroimaging biomarkers. NeuroImage. 2014 [↩]
- Wee CY et al. Identification of MCI individuals using connectivity patterns. NeuroImage. 2012 [↩]
- Bron EE et al. Deep learning classification accuracy in Alzheimer’s disease. Frontiers in Aging Neuroscience. 2020 [↩] [↩]
- Payan A et al. Predicting Alzheimer’s disease with deep learning. NeuroImage Clinical. 2015 [↩]