Abstract
This study examined whether youth shelter capacity was associated with adolescent depression among states in the U.S. by using a state-level quantitative framework with public federal data. Since prior research has focused more on homelessness itself than on state-level youth service capacity, whether specialized shelter inventory corresponds to broader adolescent mental-health patterns has been less known. Two types of datasets were used in the analysis: housing data from the U.S. Department of Housing and Urban Development Annual Homelessness Assessment Report, and mental-health data from the Substance Abuse and Mental Health Services Administration 2023-2024 National Survey on Drug use and Health state prevalence tables. In the analysis, a total of all 50 states and the District of Columbia were included. Youth shelter capacity was defined as the number of dedicated youth beds across all HUD programs, and adolescent depression was measured as the percentage of adolescents in the ages from 12 to 17 with an experience of having a major depressive episode in the past year. The association was assessed using state-level descriptive statistics, scatterplots, and regression analyses. The primary analysis used a normalized measure of dedicated youth beds across all HUD programs per 100,000 youth. Two secondary analyses used a narrower shelter-capacity definition and a raw-count shelter-capacity measure. Across the primary and secondary models, the point estimates were negative. However, the associations were weak and not statistically significant. Shelter capacity alone explained only a limited portion of the variation in adolescent depression across states. These estimates show that youth shelter capacity is a theoretically plausible variable for further study. However, this exploratory state-level analysis did not find statistically significant evidence of an association with adolescent depression. Overall, this study provides an exploratory analytic framework for future research on housing-related structural correlates of adolescent mental health.
Introduction
Adolescent depression is a major public health concern in the United States as mental health during adolescence influences teenagers with their relationships, academic performance, risk behavior, and long-term well-being. According to National federal data, major depressive episodes have been continuously reported to remain common among adolescent ages from 12 to 17. This makes adolescent depression a measurable and policy-relevant outcome rather than one particular clinical issue. Due to the nature of depressive symptoms during adolescence influencing later educational and health trajectories, it is important to identify structural conditions associated with adolescent depression for both prevention and public policy1.
In addition, youth homelessness and housing instability have continuously remained persistent social problems across the country. In this study, youth shelter capacity refers to the state-level number of dedicated youth beds across all HUD programs. According to Federal homelessness reporting through the Annual Homelessness Assessment Report, state-level estimates of homelessness and state-level housing inventory information show that both youth housing need and shelter resources can be systematically measured. Since housing instability may disrupt education, family support, safety, and access to services that together shape adolescent well-being, it is an important social problem2.
Prior research has consistently shown that homeless young people tend to struggle with substantial mental and physical health burdens. Homeless youth population experiences high rates of psychiatric and health-related challenges3. Similarly, young people experiencing homelessness face elevated levels of psychopathology, reinforcing the view that homelessness should be understood not as a housing issue but as a developmental and mental-health issue4.
A similar pattern is shown by large-scale adolescent surveillance, focusing specifically on homeless-service populations. The 2021 Youth Risk Behavior Survey found that high school students in unstable housing conditions struggled with higher risk for poor physical and mental health outcomes, including increased suicide risk. These findings suggest that unstable housing is an issue related to vulnerability for adolescents as it is closely related to emotional well-being5.
Longitudinal evidence further highlights this connection. Childhood housing insecurity is related to anxiety and depression symptoms in childhood as well as depression symptoms in adulthood6. In addition, prevention-oriented and youth-centered policy responses are sustained and justified by the prevalence of youth homelessness in the United States7.
However, the present study focuses both on the existence of youth homelessness and on the youth shelter capacity that is defined here as the state-level number of dedicated youth beds across all HUD programs. The predictor does not measure homelessness itself or service access for all adolescents in a state. Rather, it measures a specialized youth-service inventory that the outcome variable is statewide adolescent major depressive episode prevalence across the full adolescent population. In this perspective, the present study should not be interpreted as a direct estimate of service effects on the full adolescent population but as an exploratory ecological comparison between a specialized service-capacity measure and statewide mental-health prevalence estimate. This distinction matters since the presence of homelessness does not by itself indicate how well a state is equipped to respond to a housing issue. Effective responses have been often emphasized to require service access and practical housing resources. Furthermore, the importance of coordinated community responses tailored to youth experiencing homelessness has been highlighted by HUD’s evaluation of the Youth Homelessness Demonstration Program8,9.
A larger dedicated-youth-bed inventory may theoretically be associated with lower adolescent depression only indirectly if it indicates broader community capacity to identify housing crises, stabilize highly vulnerable youth, and connect them with supportive services. However, even so, since most adolescents represented in the statewide NSDUH estimate are not direct users of this specialized inventory, any such relationship would be expected to be indirect and modest.
This perspective indicates an important literature gap. Many prior studies focused on youth homelessness, unstable housing, or adolescent mental health separately, examining either individual-level risk or specific interventions. Prior studies have mainly examined individual-level homelessness, unstable housing, or intervention outcomes; whereas less is known about whether state-to-state variation in specialized youth service capacity is associated with state-level variation in the prevalence of adolescent depression. This missing knowledge matters since service inventory is a policy-relevant system measure even though it is not equivalent to the prevalence of homeless or direct service receipt. Furthermore, depression is multifactorial, and shelter capacity indicates only one possible structural correlate among many competing explanations, including healthcare access, poverty, urbanization, homelessness prevalence, education context, and broader social spending. In this study, state-level aggregates were used. Therefore, individual-level findings from the homelessness literature do not automatically imply that the same relationship may appear at the state level. Therefore, an ecological hypothesis is tested in the present analysis without supporting individual-level inference. The importance of addressing the interactions between social and mental-health needs among transition-age homeless youth has been noted10. In addition, broader socioeconomic conditions were shown to be tied to child and adolescent mental-health inequality11. This study specifically seeks to answer the research question about whether youth shelter capacity is associated with adolescent depression rates across states in the United States. This study tests the exploratory hypothesis that states with lower youth shelter capacity may show higher adolescent depression rates, while recognizing that any association is likely to be modest. Given the complexity of adolescent depression and mismatch between the specialized-capacity predictor and the statewide outcome, even a modest association may be notable.
Methods
In this study, a cross-sectional, state-level quantitative design was used to examine whether youth shelter capacity was associated with adolescent depression across states in the United States. One housing-related dataset and one mental-health dataset from official federal sources were combined in the analysis. The housing dataset was from the U.S. Department of Housing and Urban Development (HUD) Annual Homelessness Assessment Report (AHAR) data files, particularly the state-level Housing Inventory Count Information for the year 2024. The mental-health dataset came from the Substance Abuse and Mental Health Services Administration (SAMHSA) 2023-2024 National Survey on Drug Use and Health (NSDUH) State Prevalence Tables that state-level estimates for mental-health indicators were reported by age group12,13.
The initial merged dataset identified 51 jurisdictions, consisting of the 50 states and the District of Columbia. All 51 jurisdictions were retained in the final analytic sample. Since the variables used in the reported models were complete after merging the HUD and NSDUH state-level files, no states were excluded. Three related shelter-capacity measures were examined in this study. The primary analysis used a normalized measure of dedicated youth beds across all HUD programs per 100,000 youth. Two secondary sensitivity analyses used (1) the raw count of dedicated youth beds across all HUD programs and (2) the raw count of dedicated youth beds in emergency shelter, transitional housing, and safe haven programs only. These measures were used as practical indicators of state-level response capacity since they reflect dedicated inventory intended for youth-specific housing response. However, they include imperfect proxies and may also reflect state size, administrative structure, and service-delivery patterns rather than underlying need alone. The percentage of adolescent in the ages from 12 to 17 who had an experience of a major depressive episode in the past year was the outcome variable as reported in the NSDUH state prevalence tables. This mental-health variable was chosen as it was widely recognized as a policy-relevant indicator of emotional well-being for adolescents14.
To strengthen the analysis, multiple operational definitions of shelter capacity were compared in this study. The restricted-capacity measure included only dedicated youth beds in emergency shelter, transitional housing, and safe haven programs. In addition, expressed dedicated youth beds relative to state youth population size were measured by the normalized shelter-capacity and reported as dedicated youth beds per 100,000 youth. For the normalized model, the youth-population denominator was the 2024 state population in the age from 0 to 18. The normalized predictor was calculated as dedicated youth beds across all HUD programs divided by state population in the age from 0 to 18 and multiplied by 100,000. The normalized specification was used as the primary model as raw bed counts are heavily influenced by differences in state size. These alternative measures were together included to improve construct clarity, while reducing the risk of treating one imperfect bed-count measure as the only indicator of state response capacity. At the same time, the use of dedicated youth bed inventory was consistent with the bed inventory guidance in HUD as well as the structure of HIC reporting15.
The datasets were merged by state name in Microsoft Excel after reviewing state names for consistent formatting. Each row in the merged dataset indicated one distinct state, and each column showed one analysis variable. No individual-level identifiers were used as both datasets were aggregated at the state level. This approach was consistent with public secondary-data studies that population-level associations were examined rather than individual clinical outcomes1.
The main mathematical model was generated as a simple linear regression as follows:
where y indicates the major depressive episode rate of the adolescent in a state, x represents youth shelter capacity, β0 is the intercept, β1 is the slope coefficient, and ε is the error term. In all reported models, β1 is the unstandardized slope coefficient. In the primary normalized model, x represented dedicated youth beds across all HUD programs per 100,000 youth rather than a raw bed count. A negative value of β1 indicated that greater youth shelter capacity was associated with lower adolescent depression rates16.
Linear regression diagnostics were assessed by examining scatterplots, residual patterns, leverage values, and Cook’s distance. Due to the nature of strongly right-skewed predictor distribution, additional sensitivity analyses were also performed using log-transformed bed counts and Spearman rank correlation.
Four steps were applied in the analysis. First, descriptive statistics were calculated for all main variables, including the mean, median, minimum, maximum, and standard deviation. Second, the direction and spread of the associations were visually inspected through the scatterplots. Third, the normalized shelter-capacity measure was used to estimate the primary regression model. Fourth, two sensitivity models were estimated: one using raw dedicated youth beds across all HUD programs and one using the restricted shelter-capacity definition based on emergency shelter, transitional housing, and safe haven programs. The slope, Pearson correlation coefficient, coefficient of determination (R2), p-value, and confidence interval for the slope were examined for each model. Pearson correlation was used as the main question was about the direction and magnitude of an approximately linear bivariate association. However, Spearman correlation was also examined in sensitivity analysis due to the nature of highly skewed predictor distribution. These statistics were calculated as they were appropriate and interpretable for state-level public data17.
One limitation of the methodology in this study is that aggregated state-level data were used in the analysis, meaning that it may identify only relationships between state characteristics instead of individual-level effects. Since the study did not adjust for major state-level confounders such as poverty, healthcare access, urbanization, homelessness prevalence, and mental-health provider availability, the reported models should not be interpreted as estimates of an independent shelter-capacity effect but as exploratory bivariate analyses. Instead, this design should be interpreted as an exploratory bivariate framework that was used to assess whether a consistent descriptive association was shown across multiple operational definitions of shelter capacity11.
Results
In the final analytic dataset, there were 51 observations that represented the 50 U.S. states and the District of Columbia. For each observation, a state-level estimate of adolescent major depressive episode prevalence among adolescents in the ages from 12 to 17 and a state-level measure of youth shelter capacity were included. In the primary model, youth shelter capacity was measured as dedicated youth beds across all HUD programs per 100,000 youth. Two sensitivity analyses were also conducted using raw dedicated youth bed counts across all HUD programs and restricted dedicated youth beds in emergency shelter, transitional housing, and safe haven programs only. This analytic structure allowed comparison of the association across alternative operational definitions of shelter capacity. With this analytic structure, it was possible to test whether the overall pattern remained consistent across alternative definitions of shelter capacity12,13.
A substantial variation was shown across states in adolescent depression prevalence in the descriptive statistics. The mean adolescent major depressive episode rate reported was 17.26%, with a median of 17.25% and a standard deviation of 1.59 percentage points. The lowest observed value reported was 13.91% in the District of Columbia, while the highest was 20.32% in West Virginia. Other relatively high values were observed in Maine, Iowa, New Hampshire, and Oregon. Relatively low values were observed in Hawaii, South Carolina, Georgia, and New York. These values show that adolescent depression was common in every state but varied across the country to support the comparison across states (Table 1)1.
| Variable | Mean | Median | SD | Minimum | Maximum | N |
| Adolescent MDE rate (%) | 17.26 | 17.25 | 1.59 | 13.91 | 20.32 | 51 |
| Dedicated youth beds (all programs) | 663.24 | 306.00 | 1077.20 | 9.00 | 7033.00 | 51 |
| Dedicated youth beds (ES, TH, SH) | 342.73 | 166.00 | 545.47 | 9.00 | 3620.00 | 51 |
| Panel B. Regression Summary | ||||||
| Model | Slope | Intercept | Pearson r | R2 | N | |
| Primary: Normalized youth beds per 100,000 youth | -0.001994 | 17.4078 | -0.2611 | 0.0682 | 51 | |
| Secondary: Raw all-program youth beds | -0.000326 | 17.4766 | -0.2209 | 0.0488 | 51 | |
| Secondary: ES/TH/SH youth beds | -0.000586 | 17.4609 | -0.2008 | 0.0403 | 51 | |
| Panel C. States With Highest and Lowest Adolescent Depression Rates | ||||||
| Group | State | Adolescent_MDE | Youth_Beds_All | |||
| Highest adolescent depression | WV | 20.32 | 108 | |||
| Highest adolescent depression | ME | 20.31 | 206 | |||
| Highest adolescent depression | IA | 20.30 | 203 | |||
| Highest adolescent depression | NH | 20.27 | 187 | |||
| Highest adolescent depression | OR | 19.89 | 1089 | |||
| Lowest adolescent depression | DC | 13.91 | 2021 | |||
| Lowest adolescent depression | HI | 14.81 | 128 | |||
| Lowest adolescent depression | SC | 14.97 | 156 | |||
| Lowest adolescent depression | GA | 15.02 | 429 | |||
| Lowest adolescent depression | NY | 15.27 | 2733 | |||
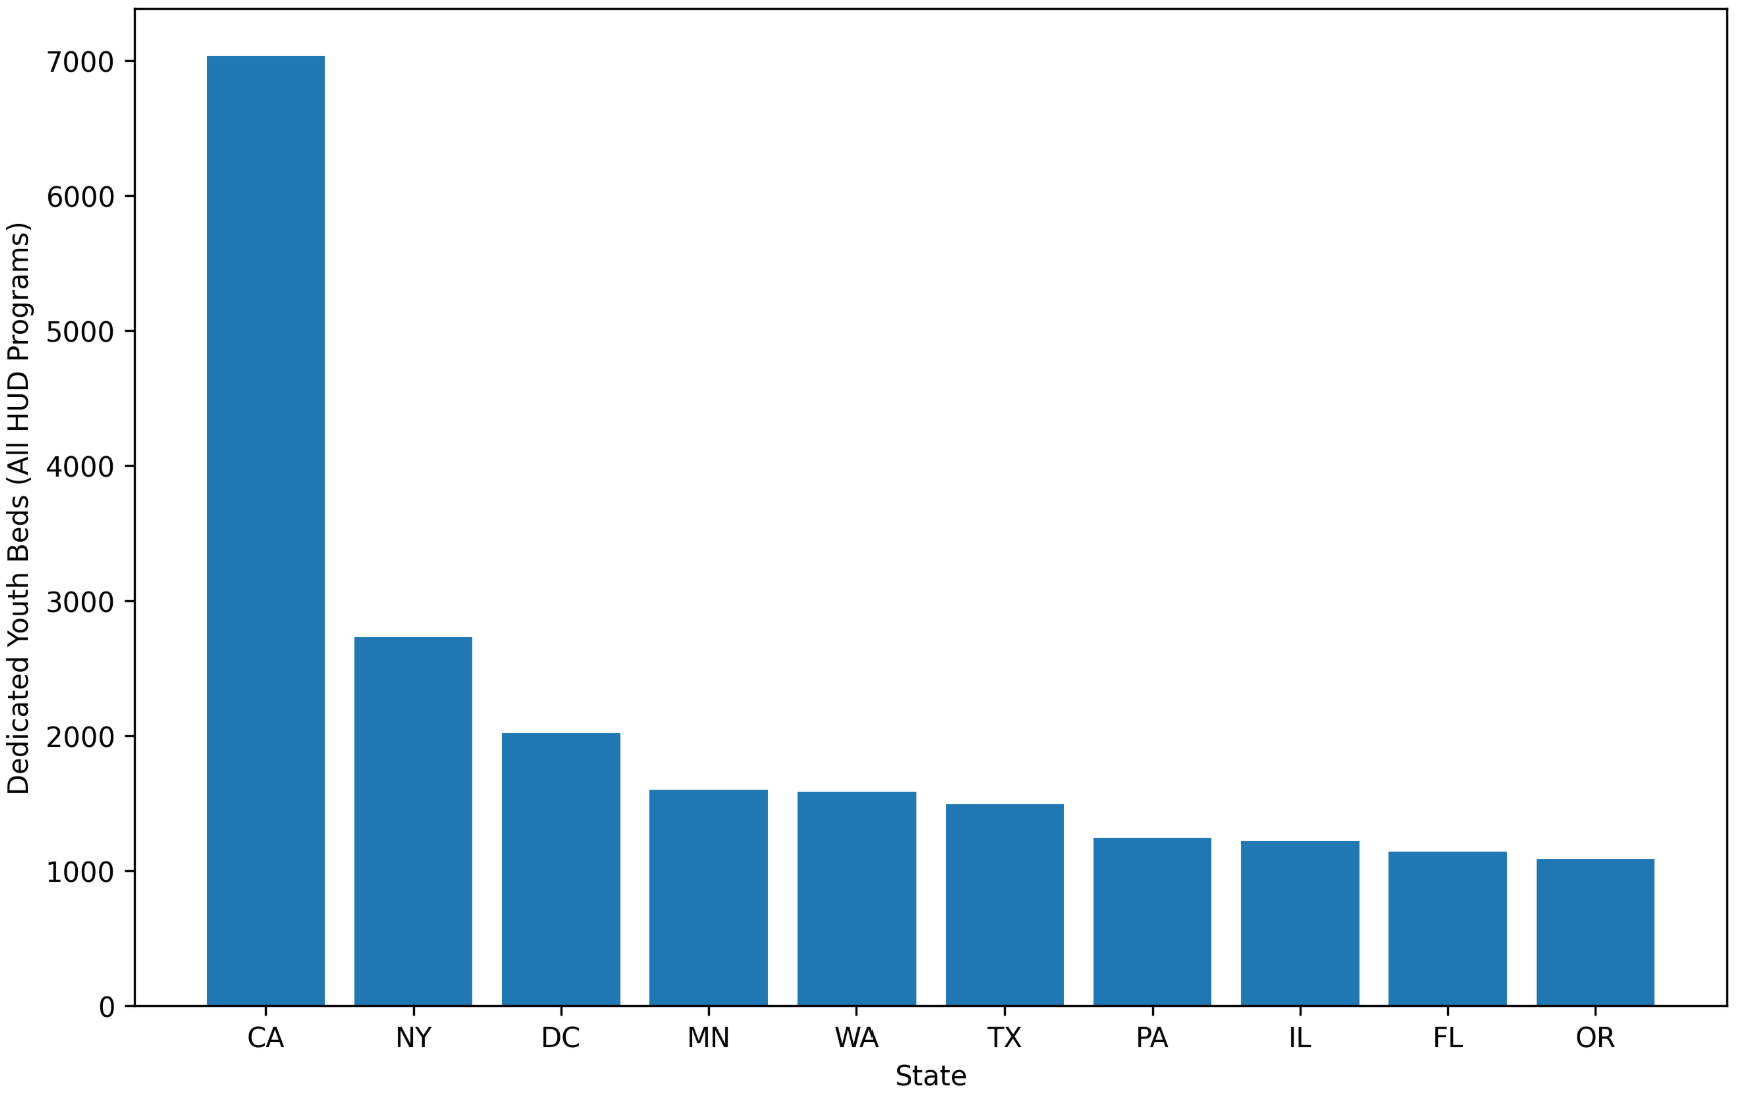
Sharp variation was observed in youth shelter capacity. For the raw count of dedicated youth beds across all programs used in a secondary sensitivity analysis, the mean reported was 663.24 beds per state, while the median reported was 306 beds. The standard deviation reported was 1077.20, indicating very wide dispersion across states. The minimum value reported was 9 beds, and the maximum value reported was 7033 beds. This range suggests a strongly right-skewed distribution, meaning that a small number of states had very large youth shelter systems, while many other states had relatively limited shelter capacity. California, New York, the District of Columbia, Minnesota, and Washington were states with the largest totals, while Delaware, Idaho, Vermont, Arkansas, and Alabama were states with the smallest totals (Figure 1). This showed that raw bed totals may partly reflect state size. This was one reason why the normalized-capacity measure was used as the primary model2,15.
In the normalized-capacity model, the scatterplot showed a weak negative pattern with substantial dispersion. Relative capacity was expressed as dedicated youth beds across all HUD programs per 100,000 youth. Compared with the raw-count model, the normalized specification visually reduced the influence of large states on the x-axis scale. Full numerical results for the normalized model are reported below. This result indicated that the main weakness of the relationship reflected the broader fact of how adolescent depression was shaped by many interacting influences beyond shelter inventory alone as well as the state-size imbalance17,16.
In the primary normalized-capacity model, youth shelter capacity was defined as dedicated youth beds across all HUD programs per 100,000 youth. The fitted regression equation was given as follows:
Where  represents the predicted adolescent major depressive episode rate and x is the normalized shelter-capacity measure. The slope was -0.001994 (SE = 0.001053), and the intercept was 17.4078. Pearson correlation was r = -0.2611, and the coefficient of determination was R2 = 0.0682. This indicates that the model explained about 6.8% of the cross-state variation in adolescent depression. The p-value for the slope was 0.0642, and the 95% confidence interval for the slope ranged from -0.004111 to 0.000122. Therefore, the normalized model did not provide statistically significant evidence of an association between normalized youth shelter capacity and adolescent depression.
The raw-count scatterplot showed a weak negative pattern with substantial dispersion, as most jurisdictions were clustered at lower bed counts and a small number of jurisdictions appeared at the high-capacity end of the distribution (Figure 2).
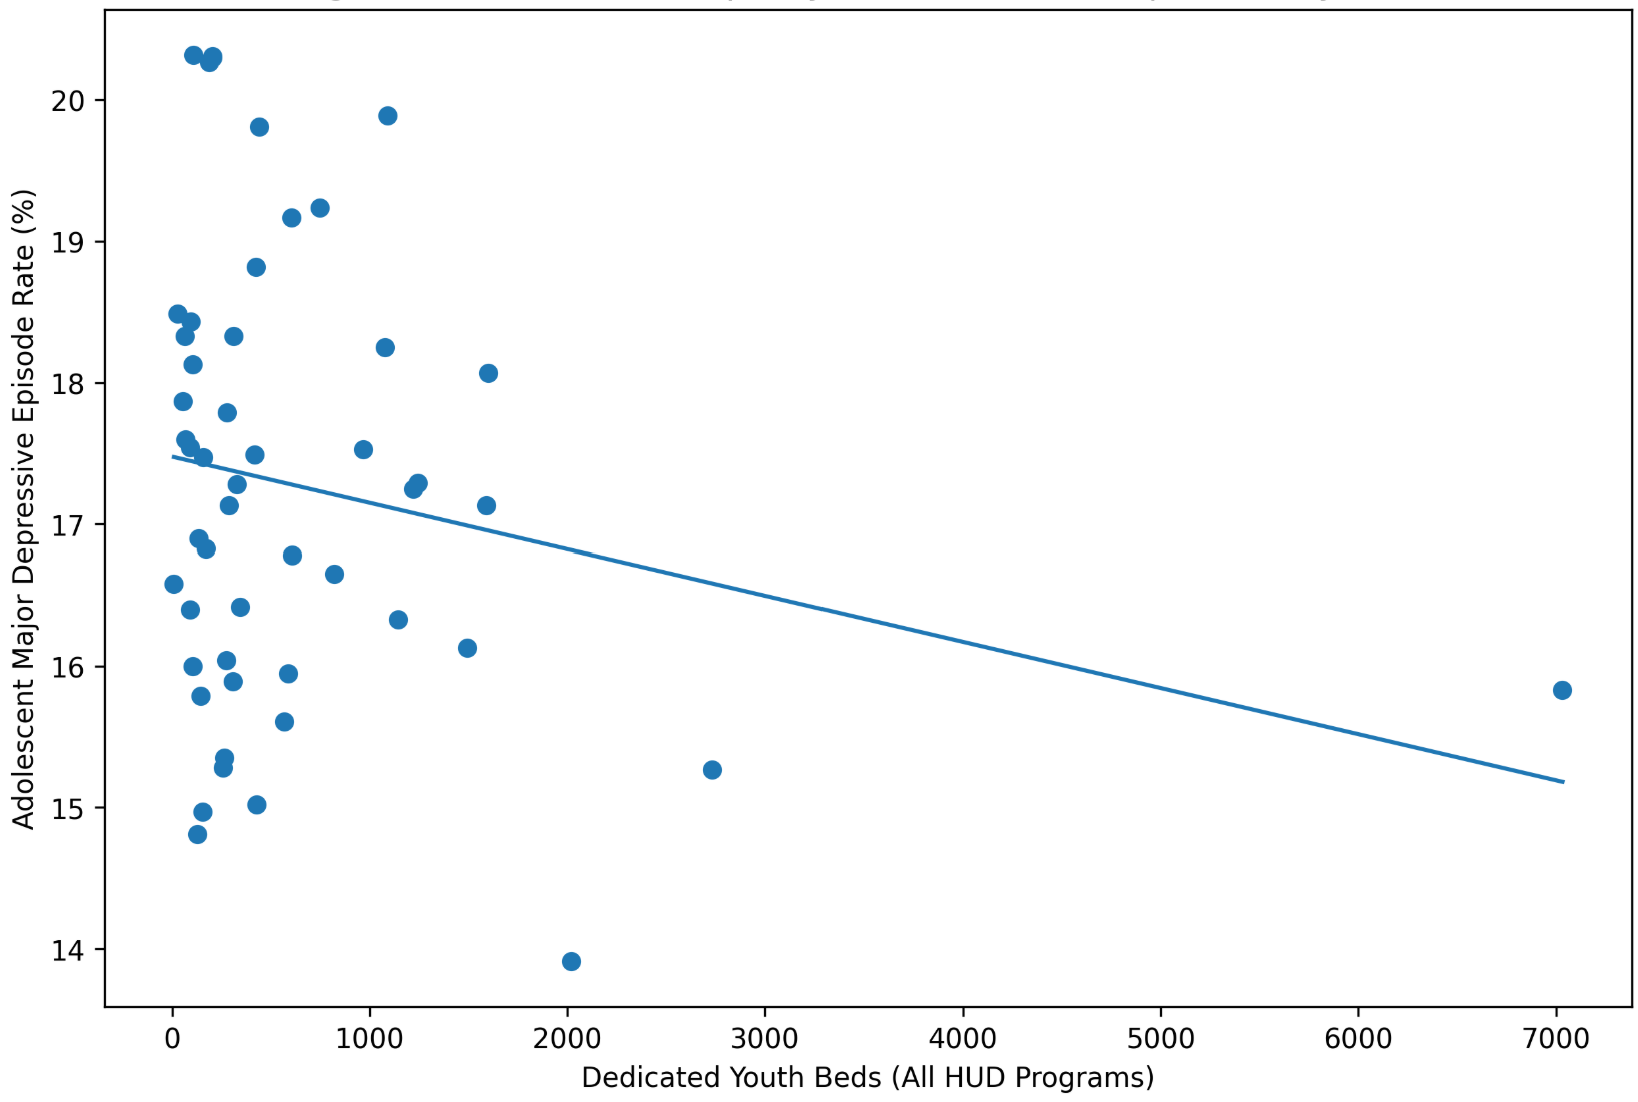
Using adolescent depression rate as the dependent variable and dedicated youth beds across all programs as the independent variable, a simple linear regression was performed. The fitted regression equation was as follows:
Where is the predicted adolescent depression rate, and x is the number of dedicated youth beds across all programs. The slope was -0.000326 (SE = 0.000206), and the intercept was 17.4766. In practical terms, the raw-count model estimated that an increase of 1000 dedicated youth beds corresponded to an approximately 0.33 percentage-point decrease in the adolescent depression rate. However, this association was not statistically significant.
However, the magnitude of the association was limited. A weak inverse relationship was indicated by the Pearson correlation with r = -0.221. The coefficient of determination was R2 = 0.049, suggesting that the model explained only around 4.9% of the cross-state variation in adolescent depression. The p-value for the slope was 0.119, and the 95% confidence interval for the slope was reported to be in a range from around -0.000740 to 0.000087 where zero was included. Therefore, there was no statistically significant evidence of a strong linear association between raw youth shelter capacity and adolescent depression in the raw-count sensitivity model.
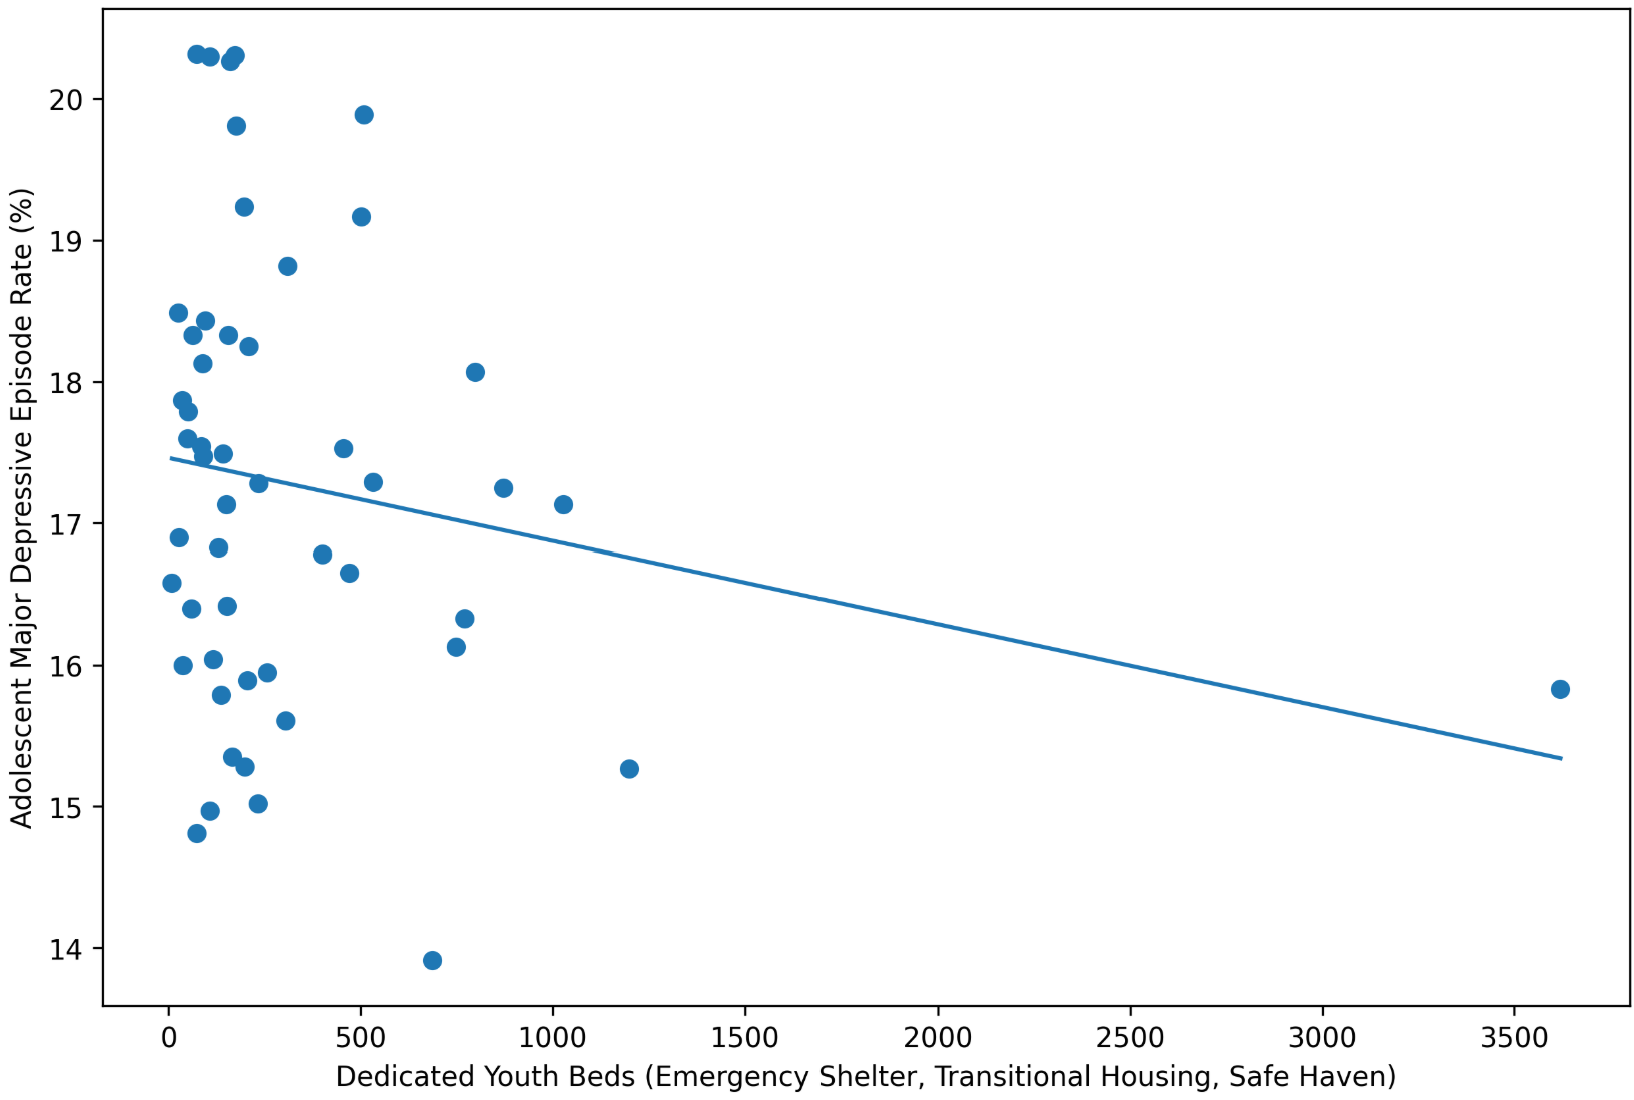
Using dedicated youth beds in emergency shelter, transitional housing, and safe haven programs only, the restricted-capacity model produced a similar overall result. The fitted equation was as follows:
The slope was -0.000586 (SE = 0.000408), and the intercept was 17.4609. The Pearson correlation in this model was r = -0.201, and the coefficient of determination was R2 = 0.040. The p-value was 0.158, and the 95% confidence interval for the slope was in a range from -0.001406 to 0.000235, which included zero. The restricted-capacity model also produced a negative point estimate, but the association was not statistically significant (Figure 3).
Since the raw-count predictor was strongly right-skewed, influence and robustness diagnostics were assessed. In the raw-count model, leverage was shown to be the highest for California (0.719), followed by New York (0.093), and the District of Columbia (0.051). In addition, Cook’s distance was also shown to be the highest for California (0.778). However, it was smaller but notable for the District of Columbia (0.098) and New York (0.040). According to Leave-one-out analyses, the estimated raw-count model slope varied from -0.000579 when California was excluded to -0.000255 when the District of Columbia was excluded. When all of California, New York, and the District of Columbia were excluded at the same time, the slope changed to 0.000025 (p = 0.961; 95% CI, -0.000988 to 0.001037). This indicates that the negative raw-count slope was not robust to the removal of the most influential high-capacity jurisdictions. The evidence for a stable monotonic association was also weakened by additional sensitivity analyses. The Spearman rank correlation between raw youth bed counts and adolescent depression was -0.166 (p = 0.246). A slope of -0.212 (SE = 0.180) was yielded by a log-transformed raw-count model, along with R2 = 0.028, p = 0.243, and a 95% confidence interval from -0.573 to 0.149. Taken together, these diagnostics show sensitivity of the estimated negative raw-count association to skewness and influential observations.
Overall, the point estimates across the normalized, raw-count, and restricted-capacity models were negative. However, none of the models provided statistically significant evidence of an association between youth shelter capacity and adolescent depression. As shown by the consistent sign across models, directional consistency has been suggested. However, the low explanatory power indicates that shelter capacity alone was not a strong predictor of adolescent depression in the dataset.
Discussion
This exploratory state-level analysis estimated negative slopes across the primary and secondary models. However, none of them provided statistically significant evidence of an association between youth shelter capacity and adolescent depression. A small negative association, no association, or a very small positive association was shown by the confidence intervals. Accordingly, the results should be cautiously interpreted. At the same time, youth shelter capacity alone explained only a limited portion of the variation in adolescent depression as shown by the weak correlations and low R2 values18.
Several competing explanations may explain the observed patterns, including differences across states in poverty, urbanization, healthcare access, homelessness prevalence, social spending, and education context. These factors were not included in the bivariate models. Therefore, the negative point estimates should not be interpreted as independent shelter-capacity effects.
These findings do not establish shelter capacity as a determinant of adolescent depression. Rather, they show that specialized youth shelter inventory is a theoretically plausible state-level variable requiring further investigation in more comprehensive designs. In this perspective, the present analysis should not be interpreted as inferential with respect to independent effects but as exploratory and descriptive.
The central limitation of the study is omitted-variable bias. The observed bivariate association may reflect confounding by state-level socioeconomic and healthcare differences rather than independent relationship with dedicated youth bed inventory. From that perspective, the weak result in this study is analytically understandable. In this study, shelter capacity should be interpreted as a theoretically plausible structural correlate rather than an established determinant of youth well-being that is influenced by other factors, such as poverty, family instability, access to counseling, school support, and broader community resources19.
This study is also subject to ecological fallacy. Using state-level averages and inventories, the analysis in this study cannot determine whether the adolescents represented in the statewide major depressive episode prevalence estimate are the same adolescents with a chance to experience youth-specific shelter services.
The results also support the prior literature connecting housing-related instability to emotional risk among youth. Youth experiencing family homelessness indicated worse emotional health outcomes, supporting the idea that mental-health burden is connected to housing-related vulnerability20. The present study aligns with that literature but rather suggests that state-level shelter inventory is a much broader and more indirect measure than individual-level housing experience. In other words, raw shelter capacity alone is not guaranteed to strongly predict depression across states by the existence of a relationship between homelessness and youth distress.
Another important point is that the relationship was not dramatically strengthened by the primary normalized model. This suggests that comparing larger states with smaller states was not simply the result of having the limited explanatory power of the main model. Instead, it implies that shelter capacity is only a part of a broader system, operating indirectly rather than directly. One theoretical work on homeless children argues that stress exposure, instability, and service-system conditions together shape mental-health outcomes. This framework helps explain why shelter capacity may matter but still is not a strong independent state-level predictor on its own21. Recent national evidence also shows that adolescent homelessness remains prevalent and is associated with worse educational, behavioral, and suicide-related outcomes among high school students in the U.S.22. Additional longitudinal work indicates that more depressive and anxiety symptoms in adolescence are associated with persistent housing insecurity23. Overall, this study contributes a feasible exploratory analytic approach for connecting public service-inventory data with estimates of state-level mental-health prevalence. Alternative explanations should also be considered, such as limited construct validity of bed counts as a proxy for response capacity, measurement mismatch between the specialized predictor and statewide outcomes, state-level aggregation that may hide local relationships, and the possibility of nonlinear associations. Recent primary research conducted among youth who experienced homelessness also suffered from sleep difficulties with depressive and anxious symptoms. This supports the view that mental-health burden in this population is much more complicated than just one structural variable24. Recent longitudinal work among young adults who experienced homelessness also shows that government, substance use, and social-support factors shape housing trajectories, and this reinforces the point that shelter capacity should be interpreted within a broader service-system context rather than as a stand-alone determinant25. It is recommended for future research to extend this model by adding poverty, insurance coverage, school support measures, or youth mental-health provider availability to test whether shelter capacity would be more informative in a multivariable framework.
Conclusion
In this study, an exploratory bivariate state-level analysis was conducted to see whether HUD youth bed capacity was associated with adolescent major depressive episode prevalence. The point estimates were negative across the primary and secondary models. However, none of them provided statistically significant evidence of an association. Therefore, the study did not find statistically significant evidence that HUD youth bed capacity was associated with adolescent major depressive episode prevalence across states.
The main contribution of this study is methodological rather than causal. This study shows how publicly available service-inventory and prevalence data can be connected for exploratory state-level analysis even when resulting associations were weak and not statistically significant.
Future research should examine this relationship using expanded designs by incorporating additional structural and social variables, stronger service-access measures, and more refined geographic levels of analysis.
References
- Substance Abuse and Mental Health Services Administration. State Data Tables and Reports from the 2023–2024 National Survey on Drug Use and Health. Substance Abuse and Mental Health Services Administration (2025). [↩] [↩] [↩]
- U.S. Department of Housing and Urban Development. The 2024 Annual Homelessness Assessment Report to Congress: Part 1: Point-In-Time Estimates of Homelessness. U.S. Department of Housing and Urban Development (2024). [↩] [↩]
- J. P. Edidin, Z. Ganim, S. J. Hunter, N. S. Karnik. The Mental and Physical Health of Homeless Youth: A Literature Review. Child Psychiatry and Human Development 43 (2012). [↩]
- K. J. Hodgson, K. H. Shelton, M. B. M. van den Bree, F. J. Los. Psychopathology in Young People Experiencing Homelessness: A Systematic Review. American Journal of Public Health 103 (2013). [↩]
- I. I. McKinnon, K. H. Krause, L. Robin, et al. Experiences of Unstable Housing Among High School Students—Youth Risk Behavior Survey, United States, 2021. MMWR Supplements 72 (2023). [↩]
- R. Keen, J. T. Chen, N. Slopen, M. Sandel, W. E. Copeland, H. Tiemeier. Prospective Associations of Childhood Housing Insecurity With Anxiety and Depression Symptoms During Childhood and Adulthood. JAMA Pediatrics 177 (2023). [↩]
- M. H. Morton, A. Dworsky, J. L. Matjasko, et al. Prevalence and Correlates of Youth Homelessness in the United States. Journal of Adolescent Health 62 (2018). [↩]
- M. H. Morton, S. Kugley, R. Epstein, A. Farrell. Interventions for Youth Homelessness: A Systematic Review of Effectiveness Studies. Children and Youth Services Review 116 (2020). [↩]
- K. A. Henderson, D. J. Rog, H. Bhattarai, A. Gilbert-Mongelli, B. Silveira, E. Jorge. Evaluation of the U.S. Department of Housing and Urban Development Youth Homelessness Demonstration Program: Final Report. U.S. Department of Housing and Urban Development (2022). [↩]
- D. A. Winiarski, A. C. Glover, D. T. Bounds, N. S. Karnik. Addressing Intersecting Social and Mental Health Needs Among Transition-Age Homeless Youths: A Review of the Literature. Psychiatric Services 72 (2021). [↩]
- F. Reiss. Socioeconomic Inequalities and Mental Health Problems in Children and Adolescents: A Systematic Review. Social Science & Medicine 90 (2013). [↩] [↩]
- U.S. Department of Housing and Urban Development. Annual Homelessness Assessment Report Data and Reports. U.S. Department of Housing and Urban Development (2025). [↩] [↩]
- Substance Abuse and Mental Health Services Administration. 2023–2024 National Surveys on Drug Use and Health: State Prevalence Estimates. Substance Abuse and Mental Health Services Administration (2025). [↩] [↩]
- Substance Abuse and Mental Health Services Administration. NSDUH State Releases. Substance Abuse and Mental Health Services Administration (2025). [↩]
- U.S. Department of Housing and Urban Development. Final 2024 HIC and PIT Data Collection Notice. U.S. Department of Housing and Urban Development (2023). [↩] [↩]
- D. C. Montgomery, E. A. Peck, G. G. Vining. Introduction to Linear Regression Analysis. John Wiley & Sons (2021). [↩] [↩]
- A. Agresti, C. Franklin, B. Klingenberg. Statistics: The Art and Science of Learning from Data. Pearson (2021). [↩] [↩]
- Centers for Disease Control and Prevention. Mental Health | Adolescent and School Health. Centers for Disease Control and Prevention (2024). [↩]
- L. B. Robins, D. Rodgers, Y. Muhammad. Unlocking Adolescent Mental Health: Exploring Social Determinants and Depression With the Social Ecological Model. Journal of Human Services 43 (2024). [↩]
- A. J. Barnes, J. Gilbertson, D. Chatterjee. Emotional Health Among Youth Experiencing Family Homelessness. Pediatrics 141 (2018). [↩]
- K. E. Marcal. A Theory of Mental Health and Optimal Service Delivery for Homeless Children. Child and Adolescent Social Work Journal 34 (2017). [↩]
- J. J. Cutuli, M. L. Garnett, Z. Noor, L. Lopez Lopez, C. Ike, J. Willard, and D. Treglia. Adolescent Homelessness in the United States, 2023. Pediatrics 156 (2025). [↩]
- K. A. Pierce, A. Mendelsohn, B. Smith, S. B. Johnson, and C. Duh-Leong. Trajectories of Housing Insecurity From Infancy to Adolescence and Adolescent Health Outcomes. Pediatrics 154 (2024). [↩]
- M. Budescu, A. Reid, A. Sisselman-Borgia, N. Holbrook, D. Valera, and G. C. Torino. Sleep and Mental Health Among Youth Experiencing Homelessness: A Retrospective Pilot Diary Study. Sleep Health 10 (2024). [↩]
- E. R. Pedersen, G. DiGuiseppi, E. J. D’Amico, A. Rodriguez, D. D. Tran, R. Jose, and J. S. Tucker. Predictors of Housing Trajectories Among Young Adults Experiencing Homelessness in Los Angeles. The Journal of Behavioral Health Services & Research 51 (2024). [↩]