Abstract
Recent disruptions in global biofuel markets, particularly China’s withdrawal from the U.S. used cooking oil (UCO) import market in 2025, have reshaped international supply chains and created a critical feedstock deficit in the United States. Applying an energy security framework and international trade policy analysis, this paper examines the feasibility of importing UCO from Latin America to offset the feedstock deficit left by China’s 2025 market exit. This study employs a targeted literature review, through searches of Google Scholar and relevant data portals (i.e. USDA Foreign Agricultural Services (FAS) and U.S. Energy Information Administration portals) and comparative case study policy analysis using data from the U.S. EIA, USDA FAS, and peer-reviewed journals were used to track diesel price trends from 2020 to 2025 and evaluate the biofuel policy frameworks of four Latin American countries. A Country Readiness Scorecard assigned composite scores on a scale from 0–100 across four dimensions—Collection, Policy, Infrastructure, and Export Readiness—using structured comparative analysis from USDA Biofuels Annual reports. A structured trade model was developed to support cross-country comparison and directional policy projection. The findings point out that Brazil demonstrates the strongest export readiness, supported by its RenovaBio program. Mexico holds a unique advantage through its inclusion in the U.S. 45Z tax credit, an incentive system that promotes domestic biodiesel production and consumption. Argentina and Colombia lag significantly due to absent UCO-specific incentives and infrastructure. Policy-based frictions, including tariffs and compliance barriers, are identified as the primary constraints on trade, not resource availability. In conclusion, policy reforms, expanding the 45Z tax credit to all Latin American UCO suppliers and investing in joint collection infrastructure, could close the U.S. feedstock deficit and reduce diesel prices by $0.12–$0.53 per gallon across up to six scenarios. These values are directional projections, not validated forecasts. Latin America holds substantial UCO potential; what is lacking is the regulatory and financial architecture to mobilize it.
Keywords: Biofuel Feedstock Markets, Used Cooking Oil (UCO), Feedstock Deficit, Trade Tariffs, Diesel Prices, Tax Incentives, Biofuel Trade Policy, Latin America, Policy Analysis, UCO Supply Chain, Diesel Price Volatility, 45Z Tax Credit Reform
Introduction
With more than three million certified semi trucks carrying domestic goods across the United States, large diesel-run freight transporters have long been the cornerstone of the industrial economy1. As a result, diesel prices have directly influenced the cost of hauling goods: as fuel prices rise, transportation costs increase, placing pressure on both producers and consumers. By 2022, diesel prices reached $5.81 per gallon—nearly $3 higher than the previous year—representing one of the most significant fuel price shocks in recent history2. Further increasing costs, the ongoing Iran conflict has inflated diesel prices to new heights, highlighting the necessity for price controls. Analyzing the current state of the global UCO market highlights the importance of policy effects in lowering diesel prices, minimizing transportation costs, and combating inflation through controlling the cost of fuel.
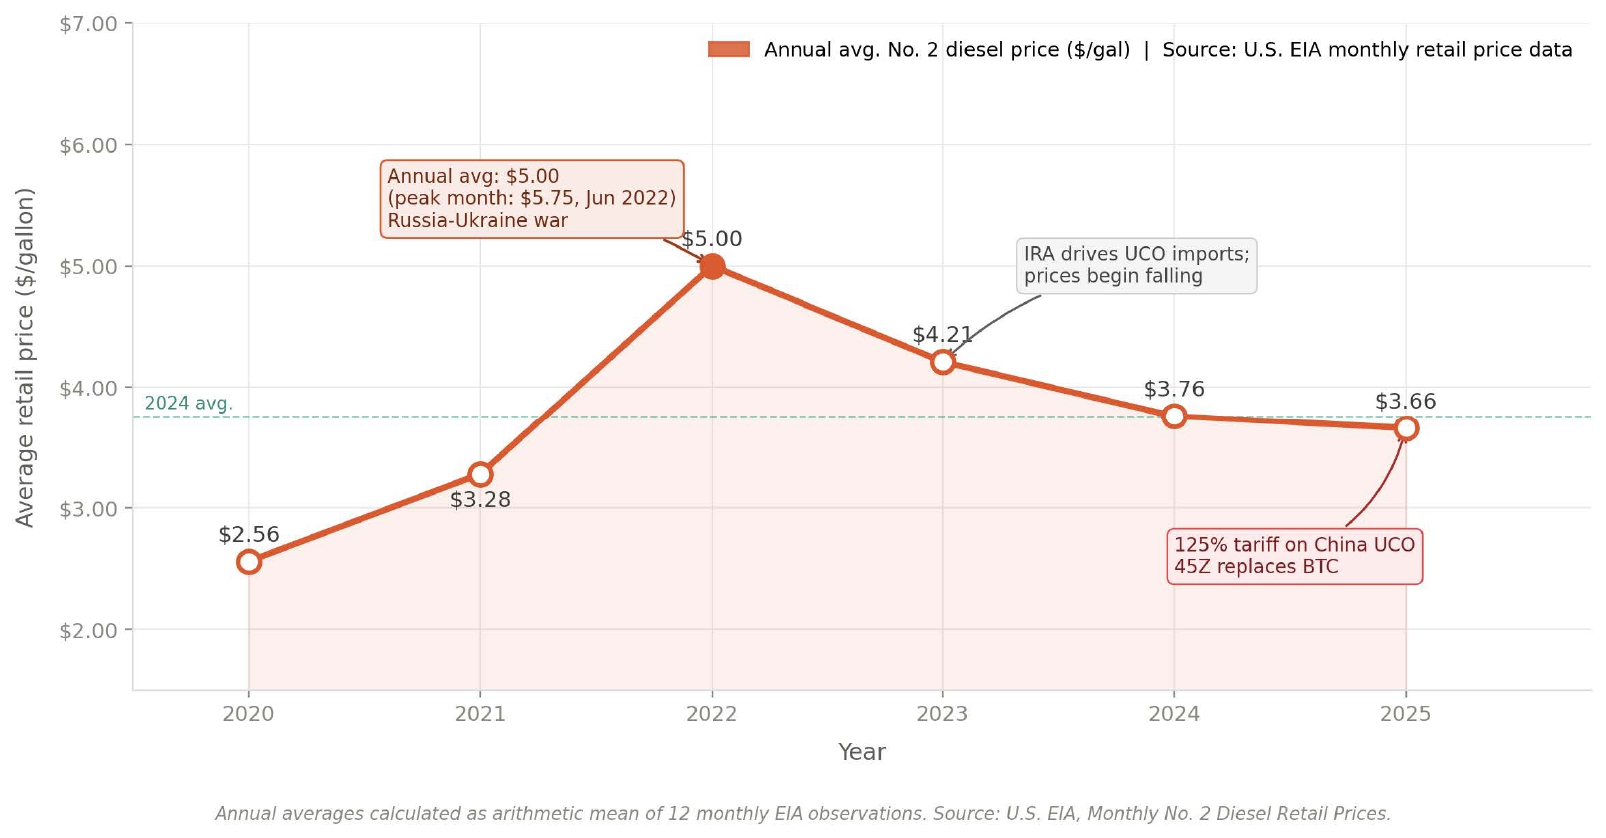
Note. Source: U.S. EIA Weekly No. 2 Diesel Retail Prices. Annual averages calculated as arithmetic mean of all weekly observations per calendar year.
Figure 1 shows the volatility of U.S. diesel prices between 2020 and 2025, with the annual average peaking at $5.00 in 2022 before declining to $3.46 in 2024—coinciding with an expansion of UCO imports. To combat the rising cost of diesel production in 2022, driven by the Biden Administration’s Inflation Reduction Act, the United States went from a net exporter of used cooking oil (UCO) to a net importer of UCO—a key ingredient in biodiesel and diesel fuels as well—from China. As a result, the price of diesel decreased to $3.46 per gallon by December of 2024. Joao Morciani, a Fastmarkets Agriculture and Biodiesel Analyst, found that the 2025 U.S demand for UCO surged to 5.7 million metric tons, and domestic production remains 3.3 million metric tons3. Coincidentally, the United States saw the greatest importation of UCO throughout 2024. Joshua Demoss, a USDA reporter, remarked that “the United States was the top export market for China’s UCO at 1.27 million metric tons (MMT), up approximately 52 percent from 2023 and accounting for approximately 43 percent of China’s total UCO exports”4.
With a reliable and abundant source of biodiesel supply, a substance used in the production of diesel fuel, prices seemed to level off. However, the United States’ dependence on China’s UCOs was tested. In early 2025, the Trump Administration imposed a 125% general tariff on Chinese goods—including UCO5. Furthermore, stricter regulations on UCO production within the Chinese government made the importation of UCO unviable for the U.S. economy4. With uncertainty growing in the UCO market, UCO/biofuel imports from China have sharply declined, in turn showing a gradual increase in diesel prices once more. As a result, transportation costs have risen, coinciding with a gradual increase in the prices of everyday goods. Due to the rising cost of living and the looming threat of economic downturn, a solution must be developed in order to prevent financial downturn.
One potential and highly feasible solution lies in Latin America, especially as the Trump Administration has not enacted any specialized UCO tariffs on their products. However, Latin America has ongoing issues that must be addressed. While the collection of UCO has been prominent in economically dominant countries such as the United States or China, many Latin American countries—including Argentina, Brazil, Colombia, and Mexico—show either underdeveloped methods of UCO collection or a lack of UCO collection altogether. For example, Julia Tomei and Paul Upham, two researchers at the Tyndall Centre for Climate Change Research, assert that “due to its size and geographical diversity, Argentina has significant bioenergy potential as well as a large, export oriented agricultural sector”6. Despite their geographical advantages and advanced agricultural market, however, many Latin American countries are associated with a reliance on grain products as their main export product.
Without a proper Latin American UCO collection system in place, problems arise in both Latin America and the United States. In Latin America, the untapped potential represents an underutilized source of profits and economic prosperity7. In the United States, the issue of China’s exit from UCO trade remains unsolved. More efficient systems of UCO collection and exportation coincide with Latin American countries creating economic prosperity through trade with the United States, while also showing signs of environmental benefit through the collecting of UCO, a waste product that can pollute soil and water.
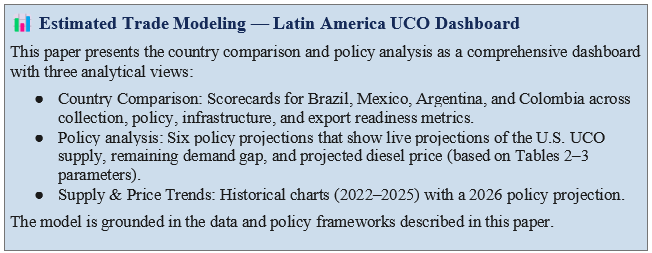
While studies have tracked the responsiveness of U.S. diesel prices in regards to biodiesel supply levels and the role of feedstock accessibility in biofuel production costs, no research has been conducted to evaluate Latin America as a substitute source of feedstock after China’s market exit, nor modeled the political actions required to mobilize a new market. In order to fully comprehend the sustainability of Latin America’s UCO market, a model has been developed to simulate possible outcomes and solutions that could increase the viability of a Latin American UCO source. The model was constructed with the following components in mind:
Scope and Limitations
This study focuses on Latin American countries based upon four specific criteria:
- An oil consumption capacity to produce recoverable UCO volumes
- Having either existent or potential UCO collection programs documented in USDA Biofuels Annual Reports
- Having established or potential trade relationships with the United States
- Containing sufficient geographic and institutional diversity for effective cross-country analysis and comparison.
For references, China will be used as a benchmark for each country’s policies and relations with the United States. Covering the period from 2020 to 2025, this study focuses on political interventions as opposed to firm-level agronomic decisions. The study’s key limitations include the unavailability of Latin American UCO production statistics, reliance on qualitative reports for infrastructure scoring, and the exploratory rather than explicative nature of the model in forecasting estimates rather than an econometric analysis of the data. The values provided in the model are researcher-derived estimates informed by historical policy outcomes and are not meant to be interpreted as precise economic forecasts.
Research Question and Objectives
This paper is guided by the following question: What policy actions can the United States and Latin America undergo to reduce the U.S. feedstock deficit, and what is the projected effect of U.S. diesel prices under different policy scenarios.
Along with the initial research question, three objectives are created as well:
- To evaluate and compare the readiness of Argentina, Brazil, Colombia, and Mexico as UCO exporters to the United States through a structured Country Readiness Scorecard
- To model the effects of six different policy interventions on the U.S. UCO supply and diesel prices using a qualitatively driven Policy Impact Simulator that creates quantifiable data.
- To identify different policy barriers—both in the United States and Latin America—that currently prevent UCO from reaching the U.S. market, and to propose evidence-based reforms.
Methods
Methodology Overview
Structured database searches and keywords were used in order to find relevant information sources: databases searched include the USDA FAS portal, EIA data portal, Google Scholar, and industry publications. Search terms used include the following: “used cooking oil trade,” “UCO biofuel feedstock,” “Latin America biodiesel policy,” “45Z tax credit,” and other country-specific variables. Sources were only used if they addressed UCO production, trade, or policy in the United States or Latin America. Additionally, references were only cited if they were published between 2009 and 2026. Quantitative diesel price data and UCO trade volumes were gathered from the Energy Information Administration (EIA) and the United States Department of Agriculture (USDA). Raw data was formed into average data points using the standard mean formula to identify correlations between feedstock availability and diesel price fluctuations. Qualitative analysis includes policy frameworks across the four key Latin American nations in order to develop the Country Readiness Scorecard and Policy Impact Simulator, synthesizing these findings into actionable policy projections. Full methodological details are provided in the Methods section.
In order to provide a comprehensive description of the current state of the international UCO market, the data used for this policy analysis was compiled through both articles and relevant literature that pertain to the research question. Publication sources include the following: government data reports and analyses, academic journals, industry publications, and timely news articles with relation to the UCO/biofuel industry.
Table 1’s data points reflect the average U.S. diesel fuel prices per year using monthly snapshots. These averages were calculated using the formula as described in Figure 2.
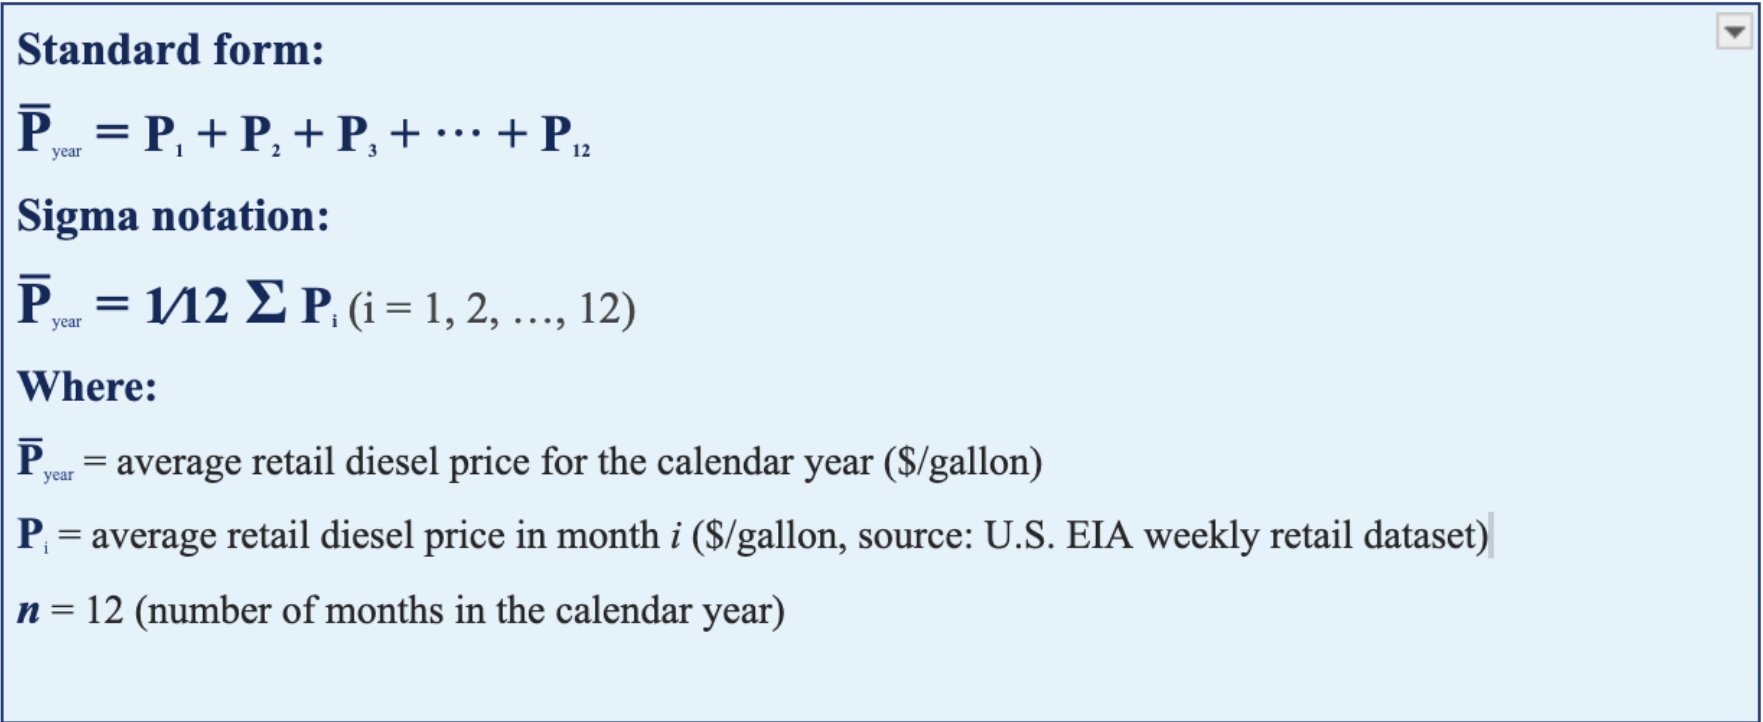
Note. Created by author. Annual average = arithmetic mean of 12 monthly EIA observations.
Research Design
This study is structured as a comparative case study, an appropriate design for research objectives that aim to explain differences across a small set of cases that share a common political context8. A comparative study was selected over econometric modeling because Latin America has a lack of precise qualitative UCO production data. Four large Latin American countries (Argentina, Brazil, Colombia, and Mexico) were selected as key targets based on oil consumption capacity and UCO collection rate, along with potential relevance to U.S. trade. The selection is also based on varying biofuel infrastructure systems and the policy frameworks that surround them.
Data Collection & Analysis
In order to provide a well-rounded study, data was collected from a variety of sources: government reports (e.g., the EIA, USDA Foreign Agricultural Service, Congressional Bills, etc.), peer-reviewed academic journals pertaining to energy policy and biofuels, UCO/biofuel industry publications and market analyses, and timely articles sourced from reputable news sources over developments in global UCO trade.
Quantitative analysis was conducted by examining diesel prices and UCO trade patterns from 2020-2025. Average diesel prices were calculated using monthly averages (using the standard mean formula) in order to identify correlations between feedstock availability and diesel price fluctuations. Annual averages were calculated using the arithmetic mean formula, detailed in Figure 2, using weekly observations for each calendar year—not from a single weekly peak value. The 2022 annual average was recalculated from all 52 weekly EIA data points, thus yielding $5.00 per gallon.
Qualitative analysis was used to compare the four major Latin American countries’ policy frameworks, including tax incentives, tariffs, blending mandates, and collection systems in order to evaluate each county’s market potential.
China serves as the default benchmark throughout each Latin American country: each Latin American nation’s readiness is compared against China’s past performance as the once dominant U.S. UCO supplier (1.27 Million Metric Tons annually, 43% of China’s total UCO exports in 2024). 9
Data triangulation was used across three different source types: primary government databases (EIA, USDA FAS) for quantitative figures; peer-reviewed academic literature for environmental, economic, and methodological information; and industry publications and policy documents for relevant market situations.
Trade Model: Analytical Framework
To complement both the country comparisons and the political analyses of this study, a comprehensive, structured trade model was developed. The model incorporates quantitative data and compiles it into two complementary analytical models: a Country Readiness Scorecard and a Policy Impact Simulator.
The Country Readiness Scorecard (Table 1) assigns composite scores on a scale from 0 to 100 across four readiness dimensions—Collection, Policy, Infrastructure, and Export Readiness—alongside two supplementary indicators: a binary flag for 45Z tax credit eligibility and a Cartel Risk score on an inverted scale (lower=lower disruption risk); see Table 1 for definitions. where lower values indicate lower supply chain disruption risk. Scores for each country were derived through a structured indicator assessment drawing on primary government sources. For each dimension, two to four measurable indicators were identified from USDA Biofuels Annual country reports, World Bank logistics performance data, and national biofuel regulatory frameworks. The model calculates each score using qualitative data derived from literature reviews and government reports. Additional flags are assigned for 45Z tax credit eligibility and cartel risk level, allowing a structured cross-country comparison with a qualitative narrative.
| Country | Collection | Policy | Infrastructure | Export Readiness | 45Z | Cartel Risk |
| Score direction: | Higher = better | Higher = better | Higher = better | Higher = better | ✓ = eligible | Lower = better |
| China (Benchmark) | 88/100 | 85/100 | 90/100 | 92/100 | ✗ | 18/100 |
| Brazil | 82/100 | 78/100 | 75/100 | 80/100 | ✗ | 35/100 |
| Mexico | 42/100 | 65/100 | 38/100 | 68/100 | ✓ | 72/100 |
| Argentina | 28/100 | 22/100 | 25/100 | 38/100 | ✗ | 28/100 |
| Colombia | 22/100 | 20/100 | 18/100 | 32/100 | ✗ | 55/100 |
Note. Scores derived from USDA Biofuels Annual reports (AR2025-0013, BR2025-0030, CO2024-0008, MX2025-0068) and Americas Market Intelligence (2022). 45Z eligibility per IRS Notice 2025-10. *China included as benchmark only. Cartel Risk scored on an inverted scale — lower = less supply chain disruption risk.
The Policy Impact Simulator below (Table 2) utilizes six distinct policy levers parameterized by an Export Boost multiplier (the estimated percent increase in UCO exports into the United States from Latin America) and a Diesel Price Impact (the projected change in average U.S. diesel price per gallon). Scores were derived through a structured comparative rubric: USDA language such as “well-developed” or “highly lucrative received scores from 75–90; “fragmented” or “nascent” received scores from 30–50; and “underdeveloped” or “extremely underdeveloped” received scores from 0–2510. The model employs the following base-scenario parameters: a U.S. annual UCO demand of 5.57 MMT, a domestic supply of 3.3 MMT, a China-exit deficit of 1.27 MMT, and a diesel price baseline of $3.46/gallon (2024 annual average)2. Impact values were derived from proportional scaling, anchoring the export boost estimates to historical trade volume changes following the removal of the Blender’s Tax Credit (BTC) and computing diesel price impacts with the Clean Fuels Alliance America (2022) finding that an increase in biodiesel supply created a 4% reduction in fuel prices, with each figure representing directional estimates.
| Policy Lever | Export Boost | Diesel Impact | Notes |
| Score direction: | Higher = better | Lower = better | |
| Remove Latin America UCO Tariffs (10% → 0%) | +22% | −$0.08/gal | Lowers trade barriers for all four countries; most immediate incentive for export activity |
| Expand 45Z Tax Credit to All of Latin America | +35% | −$0.12/gal | Extends the Mexico model to Brazil, Argentina, and Colombia. Note: directional estimate based on 45Z performance data, not an econometric forecast |
| Restore Blender’s Tax Credit (BTC) | +28% | −$0.10/gal | Reinstates the pre-2025 internationally neutral baseline applying equally to all importers |
| Raise Latin America Blend Mandates to B15+ | +18% | −$0.06/gal | Expands domestic UCO demand, building collection infrastructure base within Latin America |
| U.S.-Supported Cartel Reduction Program | +20% | −$0.07/gal | Critical for Mexico and Colombia; reduces supply-chain disruption from organized crime |
| Joint U.S.–Latin America UCO Infrastructure Investment | +42% | −$0.15/gal | Highest long-term impact; addresses structural collection gaps across all four countries |
Note. Export Boost and Diesel Impact are researcher-derived directional estimates based on CFA (2022), USDA, and EIA data. Modeled as additive projections, not econometric forecasts.
Results
Diesel Price Trends
In 2022, U.S. diesel prices reached a high of $5.00 per gallon, showing significant signs of acute supply shortages in the U.S. fuel market. Later, after the United States expanded UCO imports under the Biden Administration’s 2024 Inflation Reduction Act, prices subsequently declined to an average of $3.46 per gallon. However, in 2025, China—the United States’ largest UCO trade partner—shifted its focus towards domestic production and consumption along with finding alternative trading partners, removing 1.27 MMT of annual UCO supply from the U.S. fuel market. Simultaneously, the 45Z Tax Credit was enacted as a replacement to the Blender’s Tax Credit (BTC), a tax credit system that placed a $1.00 incentive on both internationally imported and domestically sourced biofuels, thereby removing many incentives for global UCO trade. Along with this policy change, the Trump Administration imposed a general tariff on all Chinese Imports, further distancing the U.S. UCO market from Chinese trade networks. As a result, biodiesel imports fell by over 16 million barrels between 2024 and 202511. This sudden fall in imports coincided with a minor increase in diesel prices. Diesel prices are affected by multiple factors beyond UCO availability, including crude oil prices, refinery margins, seasonal demand, and geopolitical events12. Such confounders are not controlled for in the descriptive analysis for the sake of efficiency. This study intended to identify suitable regions in Latin America that hold the capacity to address the current U.S. feedstock deficit.
The relationship between UCO supply availability and diesel prices from 2022–2025, along with projections for the impacts of 2026 Latin American policy interventions, is summarized in Table 3. Visualizations of such trends are available in the Supply & Price Trends view of the accompanying trade model.
This model employs the use of multiple figures for computations:
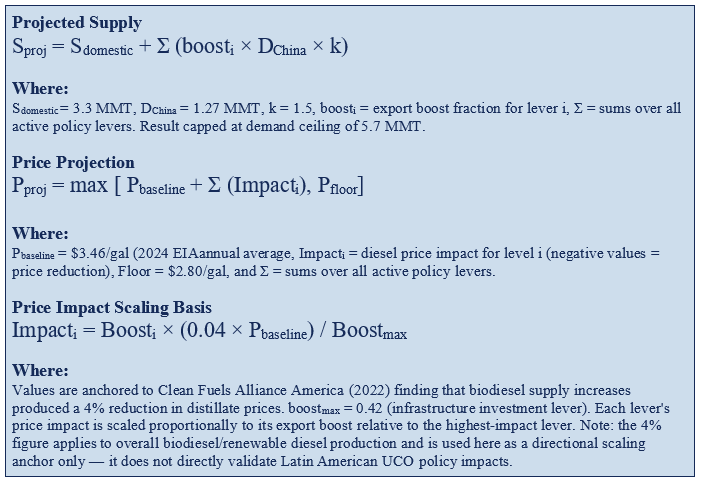
Note. k = 1.5 is the key unvalidated parameter, assuming Latin American export growth could modestly exceed the China deficit baseline given proximity advantages.
The policy impacts are modeled to be additive, a simplification that is acknowledged here. Sub-additive (diminishing) interactions, such as a scenario where multiple policies target the same UCO volumes, and super-additive (increasing) interactions, such as tariff removal amplifying 45Z incentives, are both plausible and discussed qualitatively in the Discussion section.
| Year | UCO Supply (MMT) | UCO Demand (MMT) | Avg. Diesel ($/gal) | Key Market Event |
| 2022 | 2.8 | 5.2 | $5.81 | Russia-Ukraine conflict; acute global fuel supply shock |
| 2023 | 3.6 | 5.4 | $4.17 | IRA drives biodiesel demand surge; U.S. expands UCO imports from China (+52% YoY) |
| 2024 | 4.6 | 5.7 | $3.46 | China supplies 1.27 MMT to U.S. (43% of total exports); diesel reaches 3-year low |
| 2025 | 3.3 | 5.7 | $3.75* | 125% tariff on Chinese goods; China terminates HS 151800; 45Z replaces BTC; imports collapse |
| 2026 (proj.) | 4.9–5.6† | 5.7 | $2.93–3.46† | Projected range under 2–6 active Latin American policy levers (see Table 2) |
| 2026 (Iran War Scenario) | 4.9–5.6† | 5.7 | $4.52–5.10† | Strait of Hormuz disruption raises baseline to ~$5.10/gal. Policy levers reduce by $0.58/gal max—war premium partially offset but not eliminated without Latin American UCO reforms/ |
Note. UCO supply and demand: EIA and USDA FAS. *2025 diesel price is a partial-year estimate. †2026 projections are directional scenario estimates; range reflects two-lever vs. six-lever outcomes. Iran war scenario assumes Strait of Hormuz disruption (~20% global crude restriction). All projections are directional, not econometric forecasts.
Economic Benefits of UCO Production
The biofuel industry supplies consumers with cost-effective fuel and an additional source of income for food industries. Biodiesel producers across the United States purchase UCO from restaurants or other commercial food/cooking establishments, often paying 35-45 cents per pound of UCO13. UCO collection and selling can provide a reliable secondary source of income for restaurants14.
Job creation for food and biodiesel industries is another benefit of UCO collection. In 2024, according to Clean Fuels Alliance America, the U.S. biodiesel sector provided over 107,000 full-time jobs and paid over $5.9 billion in wages15. As the biodiesel sector is a fast-growing industry derived from the high demand for environmentally safe fuel, one can associate the monetary benefits of the new workers with stable employment and livable wages. UCO collection and biodiesel industries have shown to be very profitable for both producers and consumers alike. However, with changing international politics and taxation, domestic UCO markets have been challenged by global tariffs.
Domestic Policy Concerns
Domestically, intense tariffs and national policies have hindered the UCO market; most notably, the Trump Administration’stariff on imported UCO led to an increase in the cost of biodiesel production, which, in turn, raised the price of diesel for American consumers16,17. In early October 2025, Chinese officials imposed restrictions on various forms of imports from the United States. At the same time, Chinese importers began to slow the purchasing of American soybeans, one of the United States’ largest international markets18. In response, the Trump Administration started to withhold UCO trade with China, a proportionally similar market to soybeans in the United States, showing signs associated with tariff wars. Trump was reported as stating the following regarding trade with China: “We are considering terminating business with China having to do with cooking oil, and other elements of Trade, as retribution”19. The Trump Administration’s tariff on UCOs succeeds in excluding Chinese competition; however the tariff failed to create domestic production to close the supply gap: U.S. UCO production remained at 3.3 billion pounds while demand remained at 5.7 billion pounds, meaning that the tariff’s protective effects have been diminished by a new supply deficit.
Furthermore, new policies in the United States, most notably Section 45Z Clean Fuel Production Credit (Section 45Z, for short), has occurred alongside importation of UCO from international markets. Section 45Z, a government-run tax-credit incentive program, aims to steer corporations toward sustainable fuel consumption through a $1.00-$1.75 incentive for utilizing environmentally safe fuel sources20. In a global context, however, Section 45Z creates a disparity between domestically and internationally collected UCO; UCO collected from secondary sources, such as China, does not qualify for tax incentives, leading many UCO providers to lean toward domestic production as opposed to global imports19. With domestic UCO production remaining at 3.3 billion pounds, meeting the United States’ annual demand of 5.7 billion pounds of UCO would be impossible without an external source. The 45Z tax credit successfully incentivizes domestic UCO production. However, the tax credit created a structural disparity through excluding internationally sourced UCO that could be used to close the supply gap more effectively.
U.S.-Chinese Economic Conflict
China’s UCO market restructure signifies a crucial, long-term trade policy shift rather than a slight disruption only stemming from U.S. tariffs. This shift represents a broader strategic interest in developing domestic biodiesel in China, for which UCO is a primary feedstock. In the past, China’s UCO market was a large industry, similar to its United States’ counterpart; with the United States being a primary consumer of UCO (for biofuel production) and China having a robust UCO collection system, the mutual trade of UCO was advantageous for both sides. To incentivize UCO exports, China offered a 13% tax rebate to Chinese exporters, formally known as HS (Harmonized System) Code 151800. However, as of December 1, 2024, HS 151800 was terminated by China’s Ministry of Finance in conjunction with the State Administration of Taxation19. Similar to the introduction of the 45Z tax credit, the termination of HS 151800 aimed to bring focus to the domestic production of biofuels in China5.
Moreover, with the introduction of high U.S. tariffs, China has begun pivoting their surplus of UCO exports toward other nations, especially to countries such as Thailand, Malaysia, India, and Korea, as well as to European countries5. Due to China’s surplus UCO supply and other countries’ developments of aviation fuel (another product that requires UCO), the sudden termination of UCO exports to the United States has paved the way for China to develop a strong UCO market through international exports and reliable domestic production, especially since it would be unviable for China to export their surplus UCO to the United States due to the 45Z tax credit21. While China has adapted to new global policies, the United States has not as it has failed to secure new international UCO import sources. With severe UCO shortages in the American UCO/biodiesel market, a solution is required.
Latin American Export Potential & Roadblocks
A potential solution to the shortage of UCO in the United States’ biofuel industry can be found in Latin American countries, specifically in Argentina, Brazil, Colombia, and Mexico. However, despite the opportunities for trade, Latin America has had little involvement in the global UCO market. For example, UCO trade between the United States and Brazil had only started occurring since mid-2024, a stark contrast to the previously well-established trade between the U.S. and China22. Latin American UCO/biofuel companies may be the solution to the import gap that was left by the Chinese UCO exporters.
However, due to a lack of regulations on feedstock and UCO collection in Latin America, “the collection and processing of feedstock is either nascent and fragmented or a tightly controlled oligopoly,” according to Arthur Deakin of Americas Market Intelligence7. Through a mix of effective government interventions (curtailing cartel involvement) and improved economic policy (tax incentives similar to the United States’ 45Z tax credit), Latin America would be able to supply UCO to the United States and utilize it in domestic biofuel production, thus improving its economies. Comparison of the political standings and current UCO collection situations in Argentina, Brazil, Colombia, and Mexico is presented in Table 4.
Additionally, beyond physical infrastructure limitations, institutional and governance capacity remains a significant barrier for UCO trade. UCO collection in Argentina, Colombia, and Mexico is dominated by informal actors or oligopolistic private collectors (as shown in Table 1 with varying levels of crime risk). These factors create traceability, certification, and quality assurance issues that must be resolved to meet U.S. biofuel standards.
| Country | Blend Mandate | Collection Dev. | Tax Incentives | Market Potential |
| Argentina | B7.5 | Low; no government support for UCO-based biodiesel | No UCO-specific incentives | Potential via soybean oil industry similarities; large export-oriented ag sector |
| Brazil | B12 | RenovaBio (est. 2016): well-developed, highly lucrative | RenovaBio tax credits for farmers | 3rd largest biofuel producer globally; strong export potential |
| Colombia | B10 | Underdeveloped; palm oil dominates, diverts focus | No UCO-specific incentives | ~$196M UCO inventory potential; ~$135M/yr in projected sales |
| Mexico | B5.8 (→B10, 2025 law) | Early stage; local collectors use street-food markets | Qualifies for U.S. 45Z $1.75/gal credit (from 2026) | Fuel demand rising: 1.1M → 1.4M barrels/day (2020–2025) |
Note. Data: USDA Biofuels Annual reports (AR2025-0013, BR2025-0030, CO2024-0008, MX2025-0068); Americas Market Intelligence (2022). Blend Mandate = percentage of biofuel required by law to be mixed with petroleum diesel.
Except for Brazil, the Latin American countries in Table 4 all have fragile UCO collection systems, leaving little room for standardization and regulatory support and constraining their ability to export products. Despite these obstacles, this study reveals that Latin American countries have substantial potential as a UCO supplier for the United States
Trade Model Results: Country Readiness
Putting the Country Readiness Scorecard (Table 1) in context, Brazil is shown to be the most prepared nation for immediate UCO trade, with a collection score of 82/100 and an export readiness index of 80/100. These values are based on Brazil’s RenovaBio program, Brazil’s Government-run UCO collection and biofuel production program, and its status as the third-largest biofuel producer globally. Mexico shows promise as well, scoring a moderate 68/100 on the export readiness index. However, Mexico is limited by their high cartel risk (72/100) and limited collection infrastructure (38/100), constraining their immediate scalability.
Scoring lower values overall, Argentina and Colombia’s index numbers are particularly weak in policy strength (22/100 and 20/100 respectively) and collection development (28/100 and 22/100 respectively). Both Argentina and Colombia lack UCO-specific tax incentives, along with their agricultural sectors being dominated by other crops, with soybeans and palm oils being dominant in each respective country. These crops are deeply entrenched in each economy, thus diverting economic focus away from UCO development, creating a barrier that is both logistical and political in nature.
Alternative Argument
An alternative argument presents that sufficient financial incentives could re-attract Chinese UCO exporters to the U.S. market even without HS 151800. While incentives may bring a certain amount of exports into the United States, the U.S. UCO deficit issue stems from Chinese investment strategies rather than lack of incentives. This paper considers an incentive-based strategy unlikely given China’s long-term domestic biodiesel production investment—but acknowledges it cannot be ruled out absent econometric modeling.
Discussion
How Latin American Countries Can Promote UCO Collection
This paper identifies the tension between domestic incentives and international trade barriers. While the Inflation Reduction Act of 2022 and 45Z Tax Credit of 2025 succeeded in lowering domestic fuel production and decreasing carbon emissions, the imposition of a tariff on Chinese UCO along with the removal of tax rebates have constricted the supply of necessary feedstocks, causing economic harm as a consequence. The comparative analysis of Latin American UCO markets reveals their potential as a solution to closing in on the U.S. supply gap of UCO.
To fully implement international trade of UCO and biofuels in Latin America, it is important to first understand possible methods of incentivizing both the domestic production and international exportation of UCO/biofuel products. In Latin America, one policy that many nations use is blending mandates, defined as a specific percentage of UCO or UCO-equivalent products that must be mixed with traditional petroleum diesel. The Country Readiness Scorecard shows that countries with higher blending mandates (Brazil B12, Colombia B10) tend to have higher collection development scores than those with lower mandates (Argentina B7.5). Compared to blending mandates in the United States, such as Minnesota’s B20 mandate, biodiesel in Latin America plays a much lesser role overall in the production of diesel fuel23. However, the earlier correlation suggests that when raising the blending mandate to similar levels as seen in other nations, Latin American countries would witness a rise in biofuel production, in turn increasing UCO collection.
To address the dominance of other agricultural oil products (such as soybean oil in Argentina or palm oil in Colombia), UCO-focused policies are essential. While there are multiple ways to popularize UCOs, the most valuable incentives stem from tax rebates and nation-wide collection services. For example, the United States’ 45Z tax credit—looking past the domestic focus—contains many policies that promote UCO collection and biodiesel production. In fact, UCOs have one of the highest carbon intensity (CI) scores, meaning that UCOs gain a much more substantial tax rebate compared to other food oils, such as soybeans or palm oil24. In the United States’ case, however, Section 45Z focuses on domestic production by restricting tax credits to UCOs collected within the U.S. border.
The Country Readiness Scorecard provides an evidential basis for expanding 45Z eligibility: Mexico’s export readiness score of 68/100 is much higher than Argentina’s 38/100 and Colombia’s 32/100. The main structural difference between Mexico and other Latin American countries is its 45Z eligibility—a financial incentive that no other Latin American nation has access to. Mexico therefore serves as practical evidence towards 45Z expansion.
Through adapting Section 45Z’s policies towards a more internationally-friendly system, such as placing tax credits on UCO-based biofuel usage as opposed to production, Latin American nations would be able to not only promote domestic UCO production but also boost global exports, improving Latin American UCO industries and the Latin American economy overall.
Positive Effects of a Hypothetical Latin American Export System
With an established foundational understanding of the methods for introducing Latin America to the global market, it is important to consider the possible benefits of a Latin American export system by analyzing both its effects on diesel prices and the economic growth for Latin America and the rest of the world. With many mandates around the globe requiring a specific blend of biodiesel within a country’s diesel fuel supply, biodiesel prices are vital to controlling worldwide fuel prices. As a result—with UCOs being the primary source of biodiesel fuel—UCOs carry a similar weight to that of biodiesel: as UCO prices rise, diesel prices rise accordingly and vice versa.
The scorecard provides measurable evidence for infrastructure investment: Brazil’s collection score of 82/100 reflects the effectiveness of its RenovaBio program—a government-managed UCO collection and certification program established in 2016. By contrast, Mexico’s score of 42/100 displays fragmented local collectors with little to no central organization, with Mexican collection agencies being described as being in its early stages25. Since both countries produce substantial UCO products, the 40-point gap is best explained by the absence of organized collection infrastructure rather than UCO supply.
A news release from Clean Fuels Alliance America notes that U.S. production of biodiesel and renewable diesel consistently reduces distillate fuel prices by increasing supply, with the price impact reaching a 4% benefit in 2020 and 202126. The Clean Fuels Alliance 4% finding is used only as the proportional scaling anchor for diesel price impacts (The $0.12–$0.53 range is a scenario output of the Policy Impact Simulator, not a figure from the Clean Fuels Alliance source). With biodiesel playing an important role in the price of diesel fuels, UCO supply is imperative for controlling fuel prices. If Latin America were to enter the market, UCO supply would increase, promoting biodiesel production and lowering diesel prices substantially.
Furthermore, in a study conducted by the USDA Agricultural Marketing Service, researchers found that fuel prices and transportation costs had a substantial effect on the prices of food, showcasing the importance of diesel prices when considering the costs of everyday goods27. In a hypothetical scenario where Latin America enters the global UCO market and decreases diesel prices, the international economy would not only see a fall in diesel prices but would also witness a decrease in transportation costs, resulting in lower prices for all truck-transported goods.
The trade model’s policy simulation (see table 1) reinforces this finding. The most impactful near-term intervention is expanding the 45Z tax credit to all Latin American UCO suppliers. This single lever produces the second-largest export boost (+35%) and diesel price benefit (−$0.12/gallon) of any modeled policy. Combined with joint infrastructure investment—the highest-impact lever (+42% export boost)—a two-policy package could substantially close the feedstock gap within a 2–4 year horizon.
Crime Rates in Latin America
One significant factor in the hindrance of UCO collection is a surge in criminal activity. Advanced Biofuels USA specifically mentions illegal cartels operating in Mexico that directly affect UCO production through infiltrating collection routes, extorting collectors, and concentrating market power around cartel-affiliated operators28. However, recent developments in international relations have proposed a solution. The Trump administration has offered support in curtailing the cartel’s efforts within Mexico. Los Angeles Times reporters Kate Linthicum and Jared Olson reveal that slightly more than half of Mexicans believe that U.S. authorities should enter Mexican territory to fight organized crime and arrest its leaders29. With the majority of Mexico in support of international aid, the U.S. opposition of organized crime would benefit the biofuel industry. This data serves as the base qualitative information used for the +20% export boost attributed to cartel reduction in the Policy Impact Simulator.
Crime prevention is not just limited to Mexico. Other countries, like Brazil, have implemented surveillance programs to monitor major cities and prevent illegal activity. Paraná, a riverside city within Brazil, has been categorized as a crime hub due to its proximity to the Paraná River—a key stronghold for drug trafficking, illegal weapons trades, human trafficking, and environmental crime30. The ongoing organized crime in Latin America has infiltrated its way into the UCO market, often preventing local UCO/biofuel associations from efficiently producing products. However, in 2022, the Brazilian and Paraguayan governments signed an agreement to dissolve organized crime, with its main target being the Primeiro Comando da Capital (PCC)—a highly influential criminal organization with a significant trafficking center in Paraná31. With efforts turning toward crime prevention across Latin America, UCO collectors and biofuel producers will be given the opportunity to produce their products without criminal intervention, increasing supply and decreasing diesel prices.
The cartel risk column of the Country Readiness Scorecard directly supports the U.S.-supported cartel reduction recommendations—but its relevance is concentrated in two countries. Mexico, with a cartel risk score of 72/100, has the highest crime risk of any country in the study. Likewise, Colombia, with a cartel risk score of 55/100, reflects similar issues, albeit with less UCO-specific documented limitations. By contrast, Argentina scores 28/100, making this recommendation largely irrelevant for Argentina’s UCO development. The Policy Impact Simulator shows a +20% export boost for cartel reduction, having the widest uncertainty range of any lever. This recommendation should therefore be prioritized towards Mexico and Colombia specifically and be solely complementary to other countries rather than a substitute for infrastructure investment.
Cartel Risk scores in the Country Readiness Scorecard are measured from the GI-TOC Global Organized Crime Index 2023, a multi-dimensional tool that assesses criminality tied to organized crime across 193 countries along three pillars: criminal markets, criminal actors, and resilience, identified by over 350 expert assessments32.
Brazil’s cartel risk score (35/100) shows a more contained profile relative to UCO supply chains. On the other hand, Colombia’s score (55/100) reflects more documented cartel presence with less UCO-specific market infiltration than Mexico, a country with the highest amount of UCO-specific cartel activity. Within GI-TOC’s data, Colombia scores 7.75 out of 10 on criminality (2nd globally) and Mexico scores 7.57 out of 10 (3rd globally), consistent with current Cartel Risk scores of 55/100 and 72/100 respectively in Table 1. Brazil and Argentina score substantially lower on the GI-TOC index, consistent with their lower Cartel Risk scores of 35/100 and 28/100.
Addressing the 45Z Tax Credit
High cartel activity is not the only limiting factor in the global trade of Latin American UCOs; within the United States, the 45Z tax credit exists as a way to prevent the importation of UCOs from foreign nations. However, it is important to mention the inclusion of Mexican UCOs in the 45Z tax credit. Within the tax credit’s regulations, any Mexican-sourced UCOs meet the same $1.75 incentive as U.S.-sourced UCOs24. In Mexico’s case, increasing UCO collection and international trade would be beneficial for both themselves and the United States. Mexico would successfully avoid competition with U.S. collectors since they both acquire the same tax benefits due to the USMCA (United States-Mexico-Canada) agreement. The United States would benefit as well, especially after China’s prompt resignation from America’s UCO market.
Extending 45Z eligibility to Argentina, Brazil, and Colombia would require Congressional actions or an IRS ruling to amend the tax credit33. Politically, extending 45Z eligibility remains optimistic: domestic biodiesel producers often oppose measures of increasing competition from international feedstocks. A potentially feasible alternative would be restoring elements of the Blender’s Tax Credit (BTC), a former tax credit system that placed a $1.00 incentive on both internationally imported and domestically sourced biofuels34.
However, in the context of greater Latin America, all other countries’ UCOs do not fall under the 45Z tax credit system. To that end, domestic production of biofuels within the United States still prevails as the most monetarily sustainable form of biofuel acquisition. Nevertheless, as stated earlier, China’s withdrawal from the U.S. UCO trade system has created a substantial deficit between the supply and demand of UCO. With such scarcity within the American UCO market, especially with domestic collection remaining constant, global trade must occur to meet the United States’ demand for biofuels. To compensate for the undersupply of UCOs, policy changes must adapt to promote the international trade of UCO, especially from Latin America.
Effective International Policy Changes for the United States
With a need for biodiesel production in the United States and a rapidly increasing gap between America’s UCO supply and demand, incentives for international UCO imports are crucial. Such a solution lies in domestic policy. Through incentivizing international UCO trade, the United States has the ability to effectively reverse the damage caused by China’s pullback from the UCO market. One former policy, the Blender’s Tax Credit (BTC), provides a proper baseline for an internationally-focused policy.As of 2025, the 45Z tax credit replaced the BTC, causing a sharp decline in imported biofuels due to the removal of global tax incentives35.
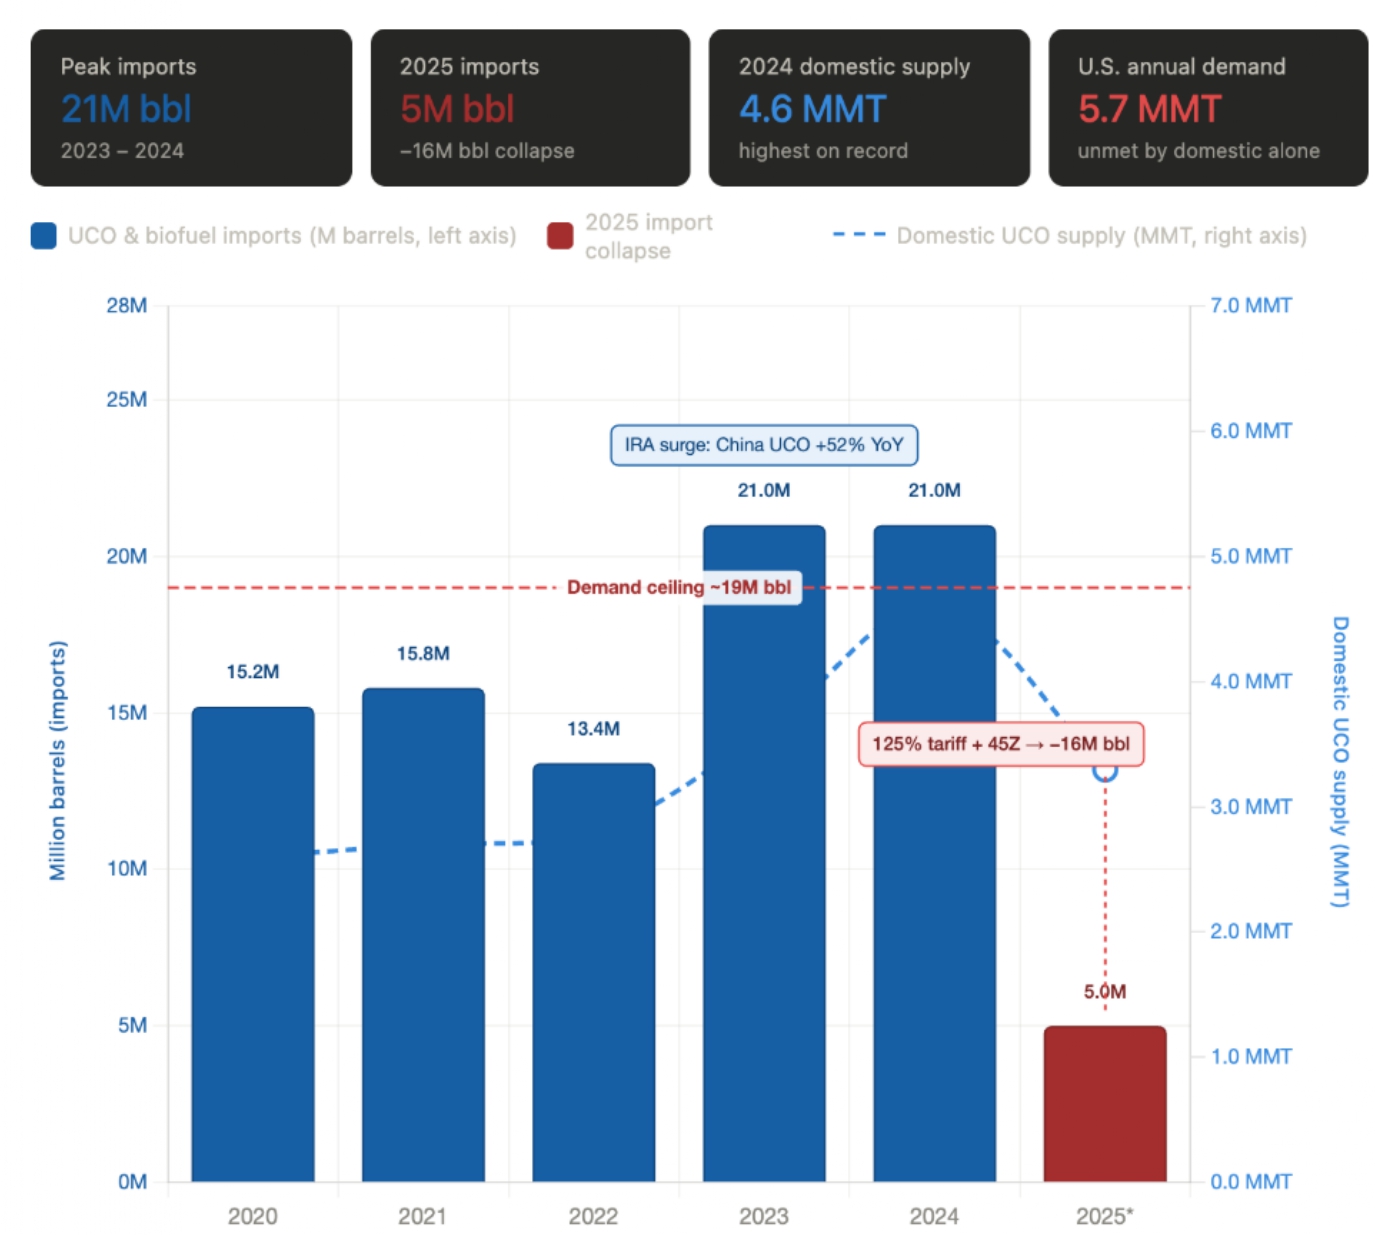
Note. Import data: U.S. EIA Monthly Petroleum Supply. Domestic supply: USDA FAS and Fastmarkets (2025). *2025 values are partial-year estimates.
As seen above, biodiesel imports fell by over 16 million barrels between 2024 and 202511. With domestic biodiesel production and UCO collection unable to meet the 16 million barrel deficit, internationally sourced UCOs and biodiesel—as the BTC promoted—must take effect to stabilize increasing fuel prices and transportation costs.
Furthermore, from a Latin American UCO collector’s perspective, either a significant reduction or complete removal of UCO tariffs would aid in promoting UCO/biofuel exchange with the United States, paving the way for increased UCO imports and American biofuel production. As of now, all Latin American goods fall under a baseline 10% tariff, significantly more cost efficient than the tariff placed on China’s UCO36.
However, this relatively small tariff contributes to a growing hesitation within Latin America; with the tariff in place, many UCO collectors are turned away from U.S. trade, primarily due to domestic biofuel production remaining more monetarily productive than international exchange with the United States34. By removing Latin American UCO tariffs, the United States would be able to open the doors for international UCO exchange with Latin America, further closing the gap between the systemic UCO demand issue.
With this tariff-removal proposal, one could argue that a removal of Chinese UCO tariffs would prove to be more beneficial to the United States, and with perhaps faster positive outcomes that would incentivize the country’s former largest importer of UCOs to continue to export products.
Nevertheless, it is important to consider the aforementioned removal of China’s HS 151800. Even in the event of a complete reversal of U.S. tariffs on Chinese UCO, it is plausible to presume that Chinese UCO collectors would remain domestically focused due to the cost effectiveness of biofuel production within China. Chinese UCO collectors would logically avoid the extra costs associated with exporting their product to the United States. Instead, it would remain substantially more cost efficient to provide UCO to domestic biofuel producers, as transportation costs would remain lower and international shipping costs would be nonexistent.
However, removing tariffs for Latin American countries would successfully incentivize trade due to a lack of domestic focus within Latin America. Both domestic production and international trade of UCO and other agricultural products are treated relatively similar under Latin American policies, meaning that there would be no further barriers for international exchanges, especially within the United States.
Conclusion
In 2020–2021, as seen in Figure 3, the United States remained stable in biofuel imports—remaining near 15–16 million barrels per year. Later, in 2024, as demand for biofuels rose, policy-driven surges began to sharply increase biofuel imports, soaring to 21 million barrels of biodiesel in 2023–2024. However, as the new and aggressive U.S. tariff regime began in April 2025, biofuel trade began collapsing. Diesel prices over a similar time period, as seen in figure 1, peaked in 2022, reflecting the biofuel shortage. Consequently, as policies began to allow the importing of biofuels in 2023–2024, prices began to level off, proving the importance of renewable fuel sources in the price of diesel.
This paper makes three distinct contributions. Theoretically, it applies energy security diversification frameworks in order to demonstrate Latin America’s structurally distinct UCO supply opportunity. Methodologically, the Country Readiness Scorecard provides a reproducible, visual framework that compares biofuel feedstock supplier readiness. From a policy standpoint, it identifies tariff removals and 45Z expansion as the highest-impact interventions per unit of political capital.
A key limitation of this study is the absence of formal statistical validation: regression analysis controlling for crude oil prices, refinery margins, and seasonal demand would be required to establish causal relationships, and econometric modeling of policy interaction effects would strengthen the simulator projections. With a lack of such sources, data points based on qualitative analysis were formed to serve as visual benchmarks rather than quantitative data points.
Furthermore, policy hindrance extends farther than just UCO collection: throughout U.S. trade networks with Latin America, especially those that have ties to feedstock, trade regulations and local incentives further block international exchanges. While the United States’ 45Z Tax Credit includes the Mexican UCO market, the rest of Latin America does not have any sort of trade incentive, in turn causing UCO producers to operate domestically due to lower logistical expenses34. These factors suggest that UCO expansion in Latin America is not a cause of insufficient demand; rather, a comprehensive lack of policy frameworks create a barrier between trade networks. Overall, despite the willingness and potential of Latin America’s global UCO trade economy, policy frameworks and international trade regulation leave their feedstock market unrealized.
Acknowledgements
I would like to thank NYU Economics Professor John Zindar and University of New Hampshire Finance Professor Steven Irlbeck for providing feedback through the research process and reviewing my paper, ensuring that the work I produced was the best it could possibly be.
References
- Bureau of Transportation Statistics. Number of trucks, locomotives, rail cars, and vessels. https://www.bts.gov/browse-statistical-products-and-data/freight-facts-and-figures/number-trucks-locomotives-rail-cars, 2025. [↩]
- U.S. Energy Information Administration. Weekly U.S. No 2 diesel retail prices (dollars per gallon). https://www.eia.gov/dnav/pet/hist/LeafHandler.ashx?n=PET&s=EMD_EPD2D_PTE_NUS_DPG&f=W, 2024. [↩] [↩]
- J. Morciani. Used cooking oil (UCO) price forecast: a cornerstone feedstock for sustainable aviation fuel. Fastmarkets. https://www.fastmarkets.com/insights/used-cooking-oil-forecast-a-cornerstone-feedstock-for-sustainable-aviation-fuel/, 2025. [↩]
- J. Demoss, FAS China Staff. China: UCO export tax rebate terminated. USDA Foreign Agricultural Service. https://www.fas.usda.gov/data/china-uco-export-tax-rebate-terminated, 2024. [↩] [↩]
- C. Aizhu, L. Yap. China pivots to Europe for used cooking oil exports as tariffs hit shipments to US. Reuters. https://www.reuters.com/sustainability/climate-energy/china-pivots-europe-used-cooking-oil-exports-tariffs-hit-shipments-us-2025-04-30/, 2025. [↩] [↩] [↩]
- J. Tomei, P. Upham. Argentinean soy-based biodiesel: an introduction to production and impacts. Energy Policy. Vol. 37, pg. 3890–3898, 2009, https://doi.org/10.1016/j.enpol.2009.05.031. [↩]
- A. Deakin. Renewable fuels in Latin America: how to win. Americas Market Intelligence. https://americasmi.com/insights/renewable-fuels-latin-america/, 2022. [↩] [↩]
- T. Hollweck. Robert K. Yin. Case study research design and methods (5th ed.). Canadian Journal of Program Evaluation. Vol. 30, pg. 108–110, 2015. https://www.researchgate.net/publication/308385754 [↩]
- FAS China Staff. UCO trade update. USDA Foreign Agricultural Service. https://apps.fas.usda.gov/newgainapi/api/Report/DownloadReportByFileName?fileName=UCO+Trade+Update_Beijing_China+-+People%27s+Republic+of_CH2025-0043, 2025. [↩]
- USDA Foreign Agricultural Service. Biofuels annual — Buenos Aires, Argentina. Report No. AR2025-0013. https://apps.fas.usda.gov/newgainapi/api/Report/DownloadReportByFileName?fileName=Biofuels%20Annual_Buenos%20Aires_Argentina_AR2025-0013.pdf, 2025. [↩]
- U.S. Energy Information Administration. U.S. biodiesel and renewable diesel imports fall sharply in 2025 after tax credit change. https://www.eia.gov/todayinenergy/detail.php?id=66045, 2025. [↩] [↩]
- U.S. Energy Information Administration. Geopolitical developments contribute to elevated diesel prices. https://www.eia.gov/todayinenergy/detail.php?id=66764, 2025. [↩]
- Michael. Can you sell grease for money? Grease Connections. https://greaseconnections.com/can-you-sell-grease-for-money/, 2025. [↩]
- A. Kumar, S. Bhayana, P. K. Singh, A. D. Tripathi, V. Paul, V. Balodi, A. Agarwal. Valorization of used cooking oil: challenges, current developments, life cycle assessment and future prospects. Discover Sustainability. Vol. 6, pg. 1–18, 2025, https://doi.org/10.1007/s43621-025-00905-7. [↩]
- Clean Fuels Alliance America. Resources. https://cleanfuels.org/news-media/resources/, 2025. [↩]
- K. Singh, E. Cao, J. Cash. Trump targets China cooking oil trade — but sales were already tanking. Reuters. https://www.reuters.com/world/us/trump-mulls-ending-some-trade-ties-with-china-including-relation-cooking-oil-2025-10-14/, 2025. [↩]
- R. Hanrahan. Trump threatens to end used cooking oil trade with China. Farm Policy News. https://farmpolicynews.illinois.edu/2025/10/trump-threatens-china-uco-trade-over-lack-of-soybean-purchases/, 2025. [↩]
- J. Pao. China halts US soybean imports to hit Trump’s MAGA supporters. Asia Times. https://asiatimes.com/2025/10/china-halts-us-soybean-imports-to-hit-trumps-maga-supporters/, 2025. [↩]
- FAS China Staff, J. Demoss. China: UCO export tax rebate terminated. USDA Foreign Agricultural Service. https://apps.fas.usda.gov/newgainapi/api/Report/DownloadReportByFileName?fileName=UCO%20Export%20Tax%20Rebate%20Terminated_Beijing_China%20-%20People%27s%20Republic%20of_CH2024-0149.pdf, 2024. [↩] [↩] [↩]
- Internal Revenue Service. Section 45Z clean fuel production credit; request for public comments. Notice 2025-10. https://www.irs.gov/pub/irs-drop/n-25-10.pdf, 2025. [↩]
- S&P Global Energy. China domestic UCO market rebounds amid ample domestic feedstock supply. https://www.spglobal.com/energy/en/news-research/latest-news/refined-products/010926-china-domestic-uco-market-rebounds-amid-ample-domestic-feedstock-supply, 2026. [↩]
- C. Couto. US opens way for Brazil used cooking oil in blow for farmers. Bloomberg. https://www.bloomberg.com/news/articles/2024-06-20/us-opens-way-for-brazil-used-cooking-oil-in-blow-for-farmers, 2024. [↩]
- Minnesota Department of Agriculture. Minnesota biodiesel. https://www.mda.state.mn.us/environment-sustainability/minnesota-biodiesel, n.d. [↩]
- L. Geiver. Feedstock flagging. Ethanol Producer Magazine. https://ethanolproducer.com/articles/feedstock-flagging, 2025. [↩] [↩]
- USDA Foreign Agricultural Service. Newly enacted laws and regulations governing biofuels development in Mexico in 2025. Report No. MX2025-0068. https://apps.fas.usda.gov/newgainapi/api/Report/DownloadReportByFileName?fileName=Newly%20Enacted%20Laws%20and%20Regulations%20Governing%20Biofuels%20Development%20in%20Mexico%20in%202025%20_Mexico%20City_Mexico_MX2025-0068, 2025. [↩]
- Clean Fuels Alliance America. Clean fuels releases new study demonstrating lower consumer costs at the pump. https://cleanfuels.org/clean-fuels-releases-new-study-demonstrating-lower-consumer-costs-at-the-pump/, 2022. [↩]
- J. Shi, J. Aichih. Impact of rising diesel prices and truck-driver availability on food transportation and distribution. USDA Agricultural Marketing Service. https://www.ams.usda.gov/sites/default/files/media/ImpactofRisingDieselPricesSummary.pdf, n.d. [↩]
- Advanced BioFuels USA. Illegal UCO cartels hinder biofuel program: observers. https://advancedbiofuelsusa.info/illegal-uco-cartels-hinder-biofuel-program-observers, 2017. [↩]
- K. Linthicum, J. Olson. Trump wants to attack cartels. Many Mexicans welcome it. Los Angeles Times. https://www.latimes.com/world-nation/story/2025-12-05/why-latin-americans-fed-up-with-cartel-crime-are-embracing-mano-duro-security-policies-like-neve, 2025. [↩]
- InSight Crime. Paraná, Brazil. https://insightcrime.org/brazil-organized-crime-news/parana-brazil/, 2021. [↩]
- V. Madureira. Brazil and Paraguay agree to fight organized crime together. OCCRP. https://www.occrp.org/en/news/brazil-and-paraguay-agree-to-fight-organized-crime-together, 2025. [↩]
- Global Initiative Against Transnational Organized Crime. Global Organized Crime Index 2023. https://ocindex.net, 2023. [↩]
- N. Buffie. The Section 45Z clean fuel production credit. Congressional Research Service. IF12502. https://www.congress.gov/crs-product/IF12502, 2025. [↩]
- M. Cousin. Understanding the 45Z tax credit and RFS changes: US biomass-based diesel and SAF at a crossroads. Fastmarkets. https://www.fastmarkets.com/insights/us-biomass-based-diesel-and-saf-at-a-crossroads-understanding-the-45z-tax-credit-and-its-ripple-effects/, 2025. [↩] [↩] [↩]
- CAPTS NDSU. Breaking down the February 2026 NDSU agricultural trade monitor: how IEEPA tariffs reshaped U.S. biofuel feeds. CAPTS. https://www.capts-ndsu.com/post/breaking-down-the-february-2026-ndsu-agricultural-trade-monitor-how-ieepa-tariffs-reshaped-u-s-bio, 2026. [↩]
- The White House. Modifying reciprocal tariff rates to reflect trading partner retaliation and alignment. https://www.whitehouse.gov/presidential-actions/2025/04/modifying-reciprocal-tariff-rates-to-reflect-trading-partner-retaliation-and-alignment/, 2025. [↩]