Abstract
Athlete monitoring for injury surveillance in basketball generates a large amount of data pertaining to player health and training. A number of collected variables may be correlated, which makes injury risk analysis challenging. In this study, a Principal Component Analysis (PCA) based framework was developed for injury risk profiling and evaluated using three publicly available basketball datasets. PCA was used to reduce dimensionality and logistic regression was used for classification, producing cross-validated injury risk profiles. The framework performed well when training load and recovery features were available in a large enough sample (Dataset 1: AUC = 0.855 ± 0.091). For Dataset 1, athletes classified as high-risk were injured at a rate of 13% compared to 1% among those classified as low-risk (Fisher’s exact test, OR = 14.79, p = 0.0013). Fatigue score surfaced as the strongest risk factor and recovery days as the strongest protective factor in the feature importance analysis although bootstrap analysis showed these values were unstable across resamples. In datasets with biomechanical and rehabilitation features (Dataset 2: AUC ≈ 0.5) or with insufficient sample size (Dataset 3: AUC = 0.759 ± 0.174, 95% CI including 0.5), the framework did not discriminate injury outcomes. Exploratory feature importance from Dataset 3 identified recovery score and sleep quality as protective factors. PCA combined with logistic regression produced interpretable injury risk profiles when sufficient training load data and sample size were available. Real athlete data is needed to confirm these findings before clinical use.
Keywords: Principal Component Analysis, basketball injuries, dimensionality reduction, injury risk profiling, training load, logistic regression, cross-validation
Introduction
Basketball is a physically demanding sport where the players have to move in many different ways. A player has to move in short bursts, rapidly change direction, jump, and abruptly stop in a matter of a few seconds. These explosive movements engage the musculoskeletal and cardiorespiratory systems using both aerobic and anaerobic energy pathways1. The repetition of these movements puts athletes at a high risk of musculoskeletal injury. Ongoing athlete monitoring has enabled identification of common injuries and their prevalence in basketball. Epidemiological studies have documented how injury rates shift between competition and practices, and identified common areas of injury and associated risk factors in collegiate basketball2,3. Across all these studies, the main areas of injury were in the lower extremities, with ankle and knee sprains and strains accounting for the largest proportion of injuries.
Many factors capturing athlete movement patterns, training, and recovery influence the risk of injury in basketball. Landing mechanics and joint loading are common risk factors for knee injuries like ACL tears4,5. Ankle joint proprioception deficit was found to be a predictor of ankle injury6. Internal load measures like sleep and external load measures like acute/chronic workload ratio and minutes played have all been associated with injury risk in basketball7. Pre-season fatigue monitoring combined with workload management also plays a crucial role in reducing athlete injury rates in upcoming playing seasons8.
Athlete monitoring in basketball enables the collection of a number of biomechanical and training-related variables for analysis to determine how individual factors or a subset of them contribute to injury risk. However, it is challenging to identify which parameters may be the most relevant for injury analysis due to the sheer number of variables that are collected. Many variables may be correlated and possibly convey similar information. In regression models, when two variables move together, whether one is weighted more towards injury prediction than the other depends on the specific sample data. This results in unstable coefficients and overfitting of the training data9. When the number of variables approaches the number of observations in the dataset, the reliability of predictions is considerably reduced10.
Principal Component Analysis (PCA) can be used to address this problem as it works by reducing data dimensionality and transforming many correlated variables into fewer uncorrelated components called principal components (PCs). These components capture the most important patterns in the original data. When provided as inputs to a logistic regression classifier, these components can be used to generate injury risk predictions without the coefficient instability that multicollinear inputs would otherwise cause. Logistic regression can be used to produce continuous probability outputs that can be used for relative risk ranking. Its coefficients can be back-projected through the PCA loading matrix to quantify each variable’s contribution to risk9.
There are limited studies that have demonstrated how PCA can be beneficial in basketball injury research. So far PCA has been used to simplify basketball external load data and relate the resulting components to the load demands of different positional groups, and examine subject-specific associations between biomechanical factors and psychological state11,12,13. Overuse and tendon injuries were linked to low long-term workload combined with short-term spikes by applying PCA to weekly workload measures14. PCA was also used in under-18 players to identify distinct workload patterns by position15. Across these studies, PCA was mainly used to derive feature loadings. In Australian football, PCA combined with regularised logistic regression applied to training load data achieved an AUC of 0.76 for hamstring injury prediction and produced a predicted daily injury probability per athlete16. A scoping review of machine learning approaches in sports injury prediction found that logistic regression remains the most commonly used method, appearing in approximately 60% of published studies9. Research is lacking in combining dimensionality reduction, classification, and interpretation in the same framework for basketball injury profiling.
This study developed a cross-validated PCA-based framework for dimensionality reduction followed by risk classification and feature importance analysis for basketball injury risk profiling. This framework was evaluated using three publicly available basketball training and biomechanical datasets for analysis. It was hypothesized that PCA-derived components loading heavily on training load, fatigue, and recovery would be significantly associated with injury risk. It was further hypothesized that cross-validated risk profiles derived from these components would show statistically significant differences in injury rates between athletes classified as higher and lower risk.
Methods
Data Source and Provenance
In this study, three publicly available basketball-related datasets from the Kaggle data repository were used to evaluate the proposed PCA-based framework. Datasets 1 and 2 are synthetically generated and do not contain real athlete measurements. The dataset descriptions explicitly note that no actual athletes were involved in data creation. Dataset 3 is described as multimodal athlete monitoring data collected from athletes over a six-month period. Additional provenance information could not be retrieved, and independent verification of the data collection methodology was not available at the time of submission. Therefore, all findings reported in this study reflect patterns in synthetic and unverified data, not real injury rates observed in actual basketball players. The framework developed in this study needs to be applied to real athlete monitoring data before informing clinical decisions.
Datasets 1 and 2 have been utilized in peer-reviewed research on basketball injuries17,18. Other publicly available datasets from the Kaggle repository have been used for sports injury prediction modeling in recent peer-reviewed literature10,19. This study followed the same precedent.
Study Design
Datasets 1 and 2 were analyzed cross-sectionally, with each row representing a single athlete observation. Dataset 3 was different from the other two as it consisted of data collected from athletes over a 6-month period across approximately 4 sessions per week. Each row in Dataset 3 represented data from a single session; therefore, this dataset required longitudinal aggregation of session-level data into athlete-level profiles before PCA was applied.
Participants and Variables
Dataset 1: Athlete Injury and Performance Dataset
This was a synthetic cross-sectional dataset and it contained simulated demographic, training regime, schedule, fatigue level, and injury risk data for 200 basketball players between the ages of 18-25 years. Key variables include athlete information (age, height, weight), training information (training intensity, training hours per week, recovery days per week), schedule information (match count per week, rest between event days), injury information (injury indicator), and performance metrics (fatigue score, performance score, team contribution score). Load_Balance_Score and ACL_Risk_Score were excluded as derived features (Table 1).
| Category | Data Measure Name | Description |
| Athlete Information | Athlete_ID | Unique identifier for each athlete (e.g., A001, A002) |
| Age | Athlete’s age (18-25 years) | |
| Gender | Gender of the athlete (Male/Female) | |
| Height_cm | Height of the athlete in centimeters (160-200 cm) | |
| Weight_kg | Weight of the athlete in kilograms (55-100 kg) | |
| Position | Playing position in the team (Guard, Forward, Center) | |
| Training Information | Training_Intensity | Average intensity of training sessions on a scale of 1 (low) to 10 (high) |
| Training_Hours_Per_Week | Total hours of training per week (5-20 hours) | |
| Recovery_Days_Per_Week | Number of days dedicated to recovery per week (1-3 days) | |
| Schedule Information | Match_Count_Per_Week | Number of matches scheduled per week (1-4 matches) |
| Rest_Between_Events_Days | Average rest days between matches (1-3 days) | |
| Derived Features | Load_Balance_Score | A calculated score (0-100) indicating the balance between training load and recovery. A higher score reflects a better balance |
| ACL_Risk_Score | Predicted risk score (0-100) for ACL injuries. A higher score indicates a greater risk of injury | |
| Injury Information | Injury_Indicator | Target column indicating whether the athlete sustained an ACL injury (1 = Yes, 0 = No) |
| Performance Metrics | Fatigue_Score | Subjective fatigue level on a scale of 1 (low) to 10 (high) |
| Performance_Score | Composite performance score (50-100) based on metrics like points scored and assists | |
| Team_Contribution_Score | Athlete’s overall contribution to the team’s success on a scale of 50-100 |
Dataset 2: Basketball Player Injury in Sports Rehabilitation
This dataset was also synthetic and it contained cross-sectional biomechanical motion data and rehabilitation information of 100 injured basketball players between the ages of 18-34 years. All athletes in this dataset had previously sustained an injury and had a marker for injury recurrence. This dataset included player demographics (age, height, weight), injury information (injury type, severity, recurrence), biomechanical motion data (knee angle, jump height, ankle flexion angle, movement speed, reaction time), and rehabilitation information (rehabilitation program, time, efficiency). Injury_Severity was ordinal-encoded (Mild=1, Moderate=2, Severe=3) and included in the analysis because it had a natural order relevant to recurrence risk (Table 2).
| Category | Data Measure Name | Description |
| Player Demographics | Player_ID | Unique identifier for each player |
| Age | Age at the time of injury | |
| Height_cm | Player’s height in centimeters | |
| Weight_kg | Player’s weight in kilograms | |
| Position | Playing position (e.g., Guard, Forward, Center) | |
| Injury Information | Injury_Type | Nature of the injury (e.g., Ankle Sprain, ACL Tear) |
| Injury_Severity | Categorized as Mild, Moderate, or Severe | |
| Date_of_Injury | Date on which the injury occurred | |
| Injury_Recurrence | Binary indicator of re-injury post-rehabilitation (0: No, 1: Yes) | |
| Biomechanical Motion Data | knee_angle_deg | Knee angle (degrees) during movement |
| jump_height_cm | Maximum jump height (centimeters) | |
| ankle_flexion_deg | Ankle flexion angle (degrees) | |
| speed_m_s | Movement speed (meters/second) | |
| reaction_time_ms | Reaction time (milliseconds) during task execution | |
| Rehabilitation Information | Rehabilitation_Program | Type of rehabilitation undertaken (e.g., Physiotherapy, Strength Training) |
| Rehabilitation_Time_weeks | Duration of rehabilitation (weeks) | |
| Rehabilitation_Efficiency_Score | Efficiency score (range: 0.5-1.0), reflecting rehabilitation quality and performance recovery |
Dataset 3: Multimodal Sports Injury Dataset
This dataset contained physiological, biomechanical, environmental, and workload information from athletes across various sports, collected longitudinally over a 6-month period. For the purposes of this study, this dataset was filtered on the field sport_type = Basketball. The filtering produced 3,302 rows of data for 41 basketball players. Playing_surface was excluded during preprocessing as a non-continuous categorical variable. Age and bmi were excluded from the session-level aggregation because they are static athlete-level attributes that do not vary across training sessions and therefore are not meaningful to average over a time window. training_load was excluded because it is defined as training_intensity × training_duration (r = 0.83 with the product) (Tables 3 and 4).
| Category | Feature | Unit | Range | Mean ±SD | Description | Sensor Type |
| Physiological Metrics | heart_rate | bpm | 40-180 | 72.4 ± 18.3 | Cardiovascular stress indicator | Chest-strap HR monitor |
| body_temperature | ℃ | 35.8-39.2 | 37.1 ± 0.6 | Core body temperature | Infrared thermometer | |
| hydration_level | % | 45-100 | 78.3 ± 12.4 | Fluid balance status | Bioimpedance sensor | |
| sleep_quality | score | 2-10 | 6.8 ± 1.9 | Recovery quality indicator | Wearable sleep tracker | |
| recovery_score | score | 25-98 | 68.5 ± 15.2 | Overall recovery status | Composite metric | |
| stress_level | a.u. | 0.1-0.95 | 0.42 ± 0.18 | Physiological stress level | HRV-based estimate | |
| Biomechanical Data | muscle_activity | μV | 10-850 | 245.6 ± 127.3 | Muscle activation level | Surface EMG |
| joint_angles | degrees | 45-175 | 112.3 ± 28.4 | Joint range of motion | IMU sensors (9-axis) | |
| gait_speed | m/s | 0.8-3.5 | 1.85 ± 0.52 | Walking/running speed | Motion capture | |
| cadence | steps/min | 50-200 | 85.7 ± 22.1 | Step frequency | Accelerometer | |
| step_count | count | 2000-15000 | 7823 ± 2341 | Total steps per session | Pedometer | |
| jump_height | meters | 0.15-0.85 | 0.48 ± 0.14 | Vertical jump performance | Force plate | |
| ground_reaction_force | N | 800-2800 | 1654 ± 387 | Impact force during movement | Force plate | |
| range_of_motion | degrees | 60-180 | 124.5 ± 23.7 | Joint flexibility | Goniometer | |
| Environmental Factors | ambient_temperature | °C | 15-38 | 24.8 ± 5.3 | Training environment temperature | – |
| humidity | % | 30-85 | 58.3 ± 14.2 | Air humidity level | – | |
| altitude | meters | 0-1200 | 285 ± 234 | Training location elevation | – | |
| playing_surface | categorical | 0-1200 | – | Surface type (0=Grass, 1=Turf, 2=Indoor, 3=Track, 4=Other) | – | |
| Workload Indicators | training_intensity | RPE | 2-10 | 6.4 ± 1.8 | Perceived exertion level | – |
| training_duration | minutes | 30-180 | 87.5 ± 28.3 | Session duration | – | |
| training_load | a.u. | 150-1800 | 568 ± 287 | Intensity × Duration | – | |
| fatigue_index | score | 15-85 | 48.3 ± 18.7 | Cumulative fatigue measure | – |
| Columns | Type | Description |
| athlete_id | Integer | Unique athlete identifier (1-156) |
| session_id | Integer | Session number per athlete |
| sport_type | Categorical | Sport discipline (Soccer, Basketball, Track, Other) |
| gender | Categorical | Male (68%), Female (32%) |
| age | Integer | Athlete age in years (18-35, Mean: 24.3 ± 4.2) |
| bmi | Float | Body Mass Index (18.5-28.3, Mean: 23.1 ± 2.4) |
| injury_occurred | Integer | 0 – Healthy, 1 – Low Risk, 2 – High Risk/Injury |
Data Preprocessing
Since PCA works on continuous numerical input, non-numerical feature columns like position, gender and rehabilitation program were excluded. Binary encoding on such features was avoided to make sure all features included in the final analysis were similarly scaled considering PCA sensitivity to scale mismatch in a dataset20. Injury_Severity in Dataset 2 was included as an exception because, despite being non-numerical, it had a natural order (Mild=1, Moderate=2, Severe=3) relevant to recurrence risk. Gender and positional role were excluded as they were not actionable targets for load management.
Several derived features were removed to avoid inflating PCA structure. Load_Balance_Score was removed from Dataset 1 (computed from Training_Hours_Per_Week and Recovery_Days_Per_Week, R² = 0.61). training_load was removed from Dataset 3 (defined as training_intensity × training_duration, r = 0.83). ACL_Risk_Score was removed from Dataset 1 because it encoded the prediction target.
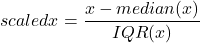
Outliers were detected using the IQR method. For each variable, outliers were flagged if a value was lower than Q1 – 1.5×IQR or greater than Q3 + 1.5×IQR. Variables with outliers were robustly scaled (Equation 1). Variables without outliers were standardized using the z-score method (Equation 2).
(1) 
(2) 
where μ is the mean and s is the standard deviation of the training samples for feature x.
Dataset 3 required longitudinal aggregation. Session-level data was averaged over each athlete’s last 16 sessions (approximately 4 weeks) to create athlete-level profiles before PCA. The 4-week window was selected based on cross-validated AUC across windows of 3 to 10 weeks (Table 5). A 4-week window ties to the acute-to-chronic workload paradigm used in sports injury research, and 3-6 week windows are standard practice for capturing cumulative load effects21,22. A large variation in performance was observed across time windows (AUC range: 0.468-0.764). The 4-week and 10-week windows produced higher AUCs (0.764 and 0.762) compared to other windows.
| Time Window | Sessions | Classes | CV AUC ± Std | 95% CI |
| 3 weeks | 12 | 29:12 | 0.468 ± 0.309 | 0.083-0.953 |
| 4 weeks | 16 | 28:13 | 0.764 ± 0.118 | 0.597-0.912 |
| 6 weeks | 24 | 27:14 | 0.509 ± 0.118 | 0.340-0.610 |
| 8 weeks | 32 | 28:13 | 0.527 ± 0.233 | 0.128-0.742 |
| 10 weeks | 40 | 24:17 | 0.762 ± 0.082 | 0.667-0.868 |
Athletes who had a mean injury severity score of over 0.5 on the 0-2 scale were classified as high-risk. Class distributions were imbalanced. Balanced class weighting and stratified cross-validation splits were used to address this imbalance.
Dataset Validation
Two datasets used in this study are synthetic and the third lacks verified provenance. Four validation checks were therefore performed against published sports science literature to assess whether data patterns in the datasets used in this study reflected known relationships.
For each dataset, injury prevalence was compared to published injury rates for the relevant injury type to determine if the prevalence reflected real-life situations. Skewness and kurtosis were computed to assess whether data distributions were realistic or uniformly generated. Kurtosis near -1.2 suggests simple random number generation. Inter-variable correlations were compared to physiologically expected relationships. For example, Height and Weight would be expected to show a moderate positive correlation in real athlete populations. Near-zero correlations between variables that should be related would suggest independent generation. Finally, the direction of injury risk factors was compared to published findings. Injured athletes are expected to show higher training hours, higher intensity, higher fatigue, and fewer recovery days7. These checks provide an approximate, literature-based way to determine whether the given datasets presented realistic patterns and could be used to build a proof of concept.
Analytical Framework
The framework had four stages – PCA for dimensionality reduction, component selection using cross-validated AUC, classification using logistic regression, and risk profile construction with feature importance analysis.
In the first stage, PCA was performed separately on each dataset using scikit-learn in Python. Components were ordered by decreasing explained variance. In the second stage, cross-validated AUC was calculated for a combination of components and the number of components was selected where the cross-validated AUC plateaued. This method retained only components that actually contributed to injury classification, removing dimensions that explained variance in the data but carried no relationship to injury risk.
In the third stage, four classifiers were compared on Dataset 1. Logistic regression performed the best with the highest AUC (0.855 ± 0.091, 95% CI: 0.672-0.980). It outperformed random forest (0.750 ± 0.143), gradient boosting (0.708 ± 0.145), and SVM (0.812 ± 0.103). Logistic regression with balanced class weighting was used to calculate cross-validated AUC across different numbers of principal components. To prevent data leakage, the process of scaling, PCA, and classification was repeated 10 times using a 5-fold method. Athletes were split into 5 folds where each fold preserved the overall injury rate seen in the dataset. Within each run, scaling and PCA were applied to 4 training folds and the model was then tested on the 5th fold which contained athletes it had not seen. The results were averaged over the 10 runs for stable estimates.
In the fourth stage, only datasets with an AUC greater than 0.5 were picked to calculate cross-validated injury risk probabilities. Then, athletes were grouped into four risk groups (Very High, High, Moderate, Low) based on probability quartiles and Fisher’s exact test was applied to test group differences. Feature importance was computed by multiplying the PCA loading matrix by the logistic regression coefficients.
To make sure the model could find genuine injury risk patterns, the risk probabilities were calculated using the held-out fold from the 5-fold process described above. Each athlete’s estimate came from a model that never included that athlete in training. Risk groups were then formed from these probabilities, ensuring the evaluation reflected the model’s ability to detect risk patterns and not just memorize them23.
Results
Dataset 1: Athlete Injury and Performance
Data Validation
Dataset 1 presents an ACL injury prevalence of 7.0% (14 of 200 athletes) which is substantially greater than the published ACL injury rates in collegiate basketball ranging from 0.33% to 0.84% per athlete-year depending on sex24. Injured athletes demonstrated higher training hours, higher training intensity, higher fatigue scores, and fewer recovery days7. Most variables showed skewness values close to zero and slightly negative kurtosis values. This shows that the data distribution is generally balanced and realistic without major outliers. However, inter-variable correlations were substantially weaker than would be expected in real athlete data (e.g., Height vs. Weight r = +0.03, compared to a typical r = 0.3-0.7). There was a slight mismatch for match count per week, where injured athletes participated in marginally fewer matches than healthy athletes.
PCA and Component Selection
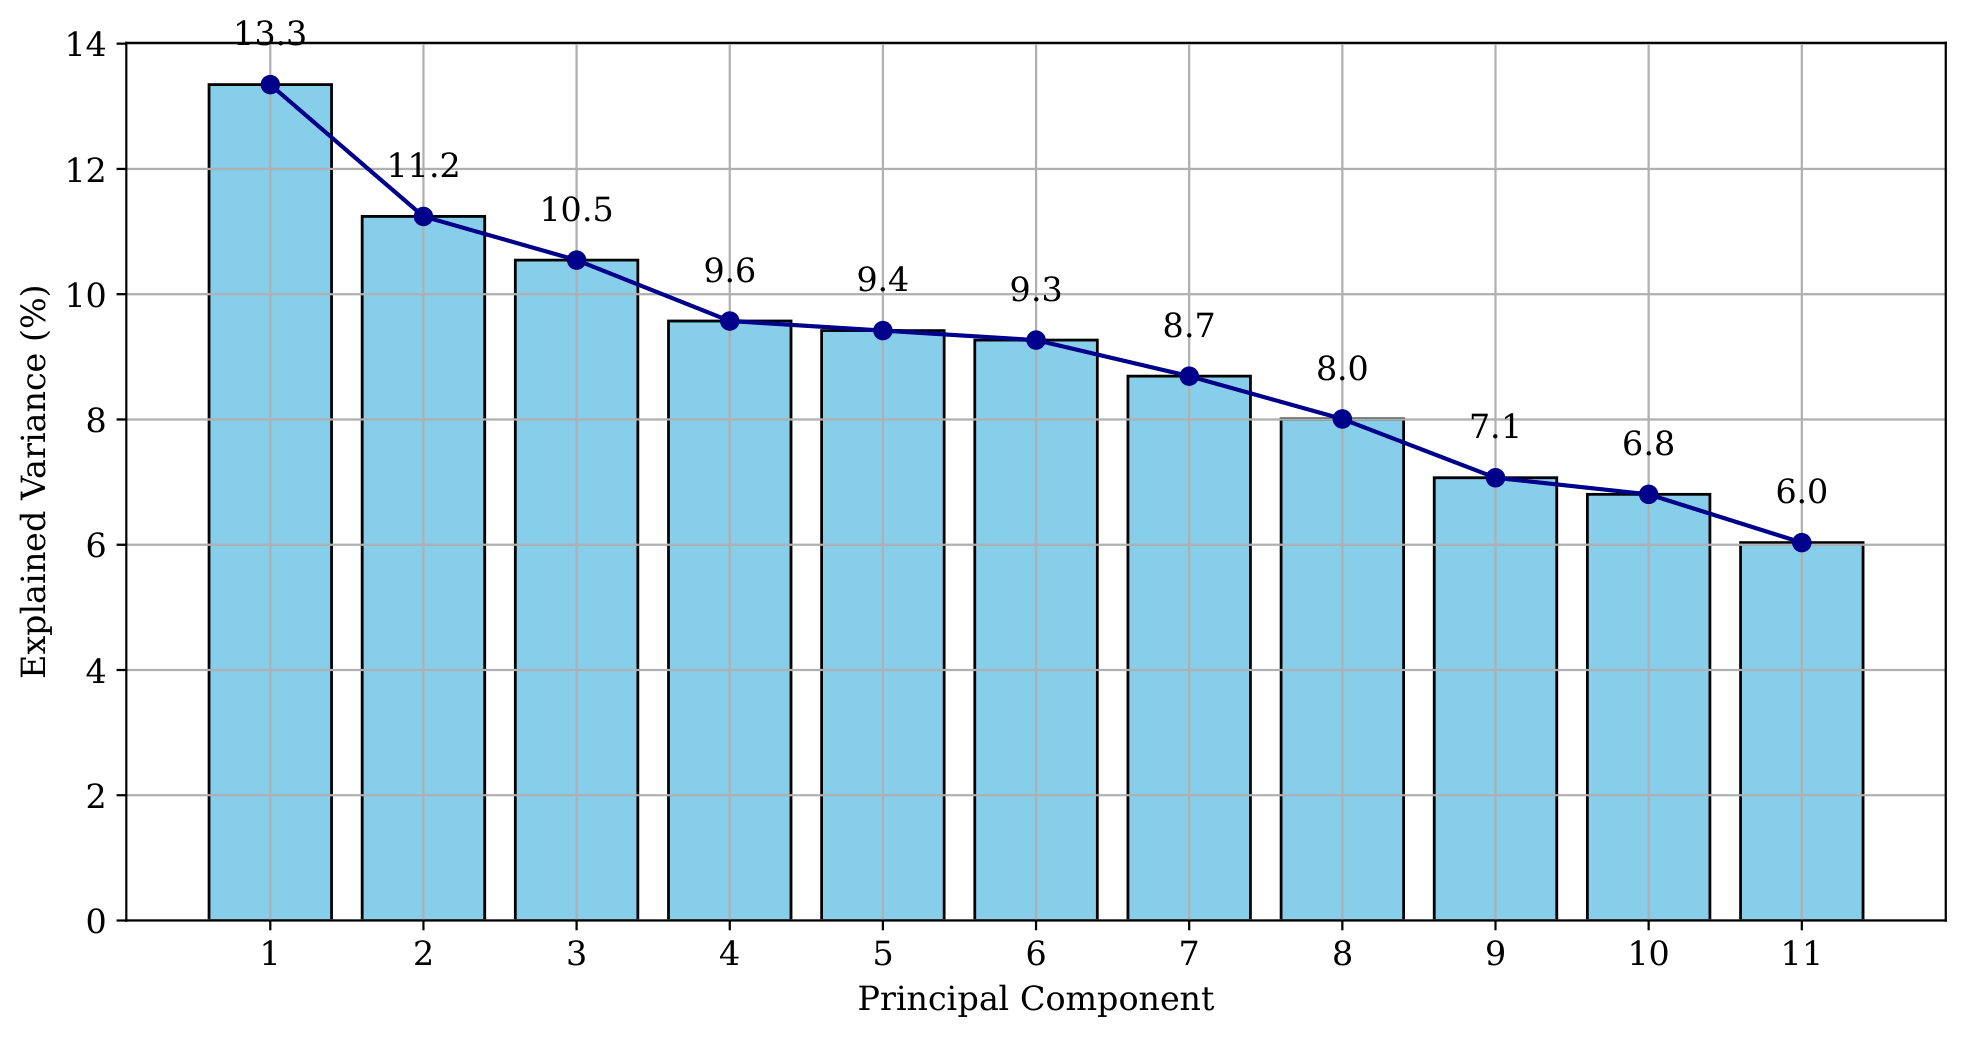
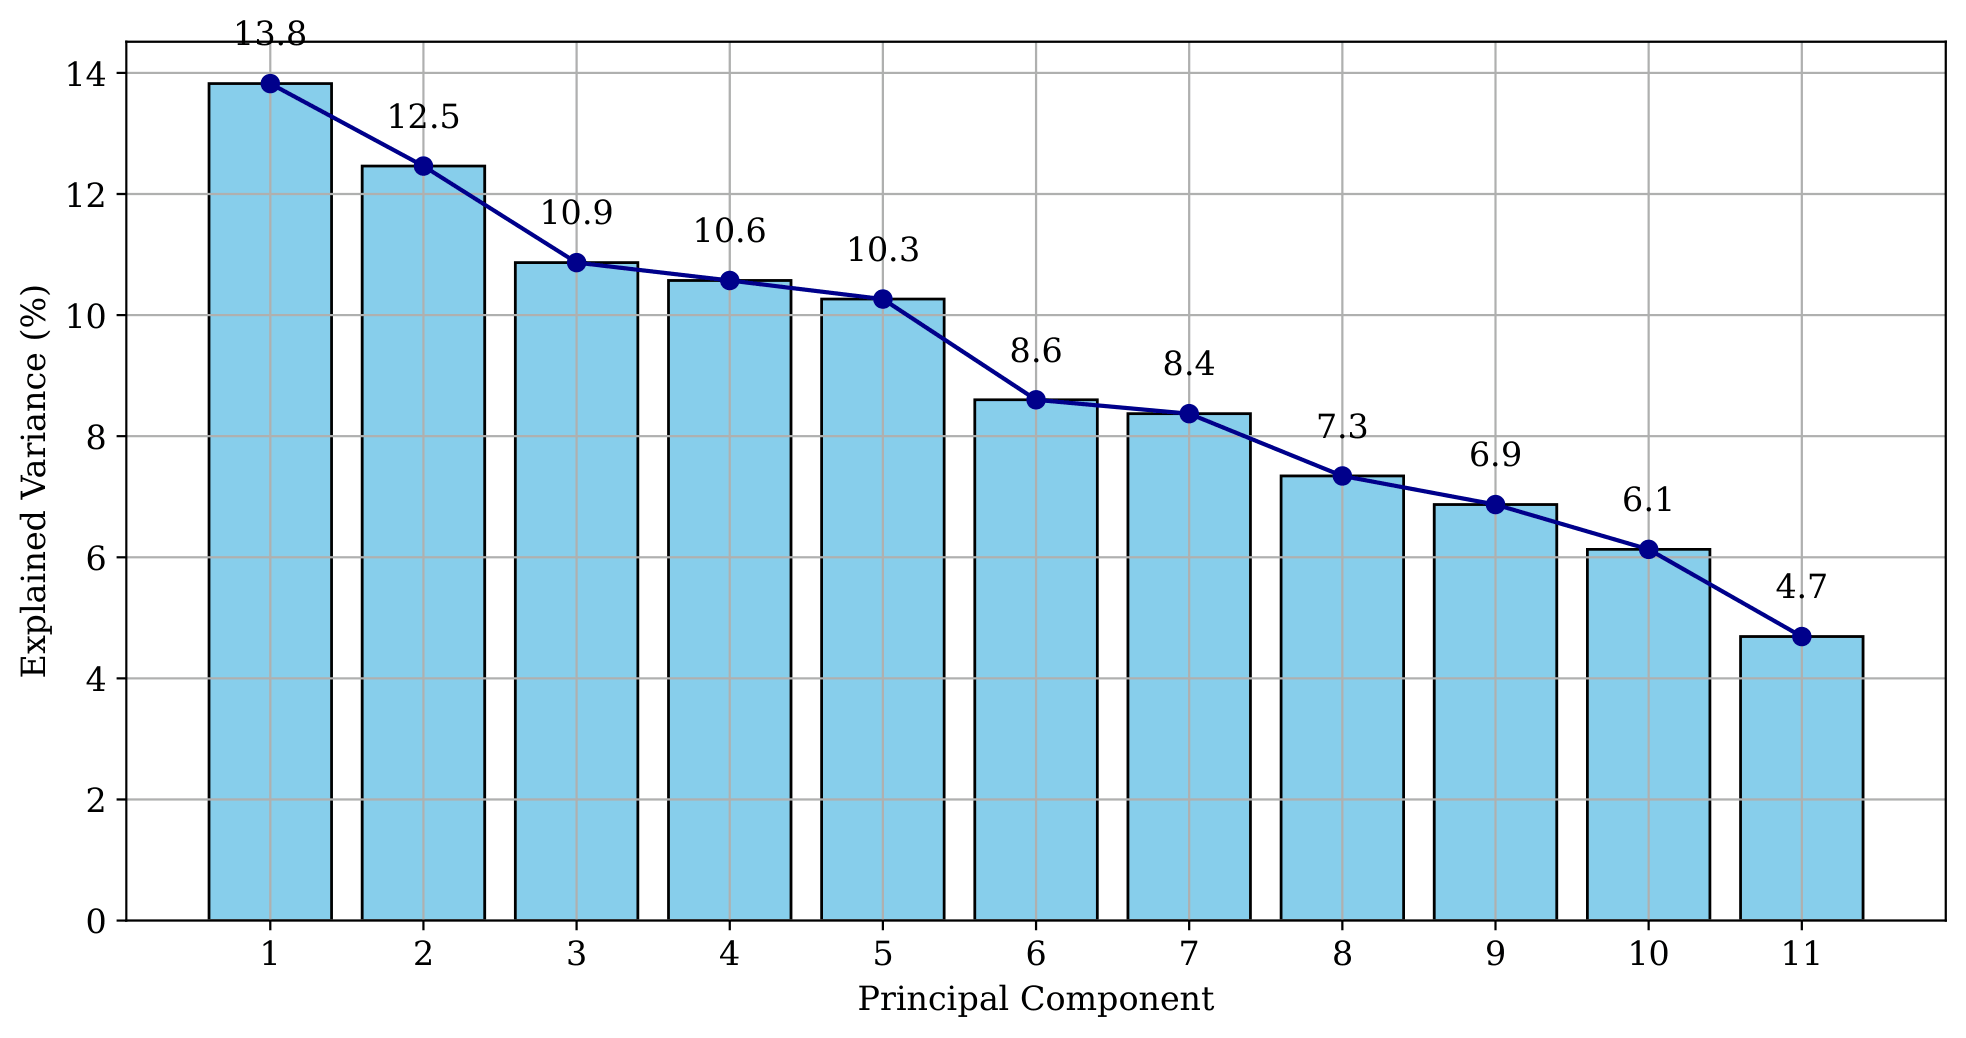
After removing Load_Balance_Score and ACL_Risk_Score, PCA on this dataset produced 11 principal components. The scree plot (Figure 1) shows that variance was distributed relatively evenly across all components. There was no distinct elbow observed. The top 8 PCs covered approximately 80% of the total variance.
AUC values increased gradually from a single component (0.472 ± 0.170) up to the first 8 components (0.855 ± 0.091, 95% CI: 0.672-0.980). Adding the remaining three components did not improve model performance (all 11 PCs: 0.854 ± 0.109) (Table 6). Bootstrap stability analysis across 1000 resamples showed that every one of the 88 feature-component loading pairs had 95% confidence intervals crossing zero (mean CV = 1516%).
| PC Combination | AUC | Std | 95% CI | Var Explained |
| PC1 only | 0.472 | 0.170 | 0.163 – 0.892 | 13.3% |
| Top 8 PCs | 0.855 | 0.091 | 0.672 – 0.980 | 80.1% |
| All 11 PCs | 0.854 | 0.109 | 0.635 – 1.000 | 100.0% |
Feature Importance
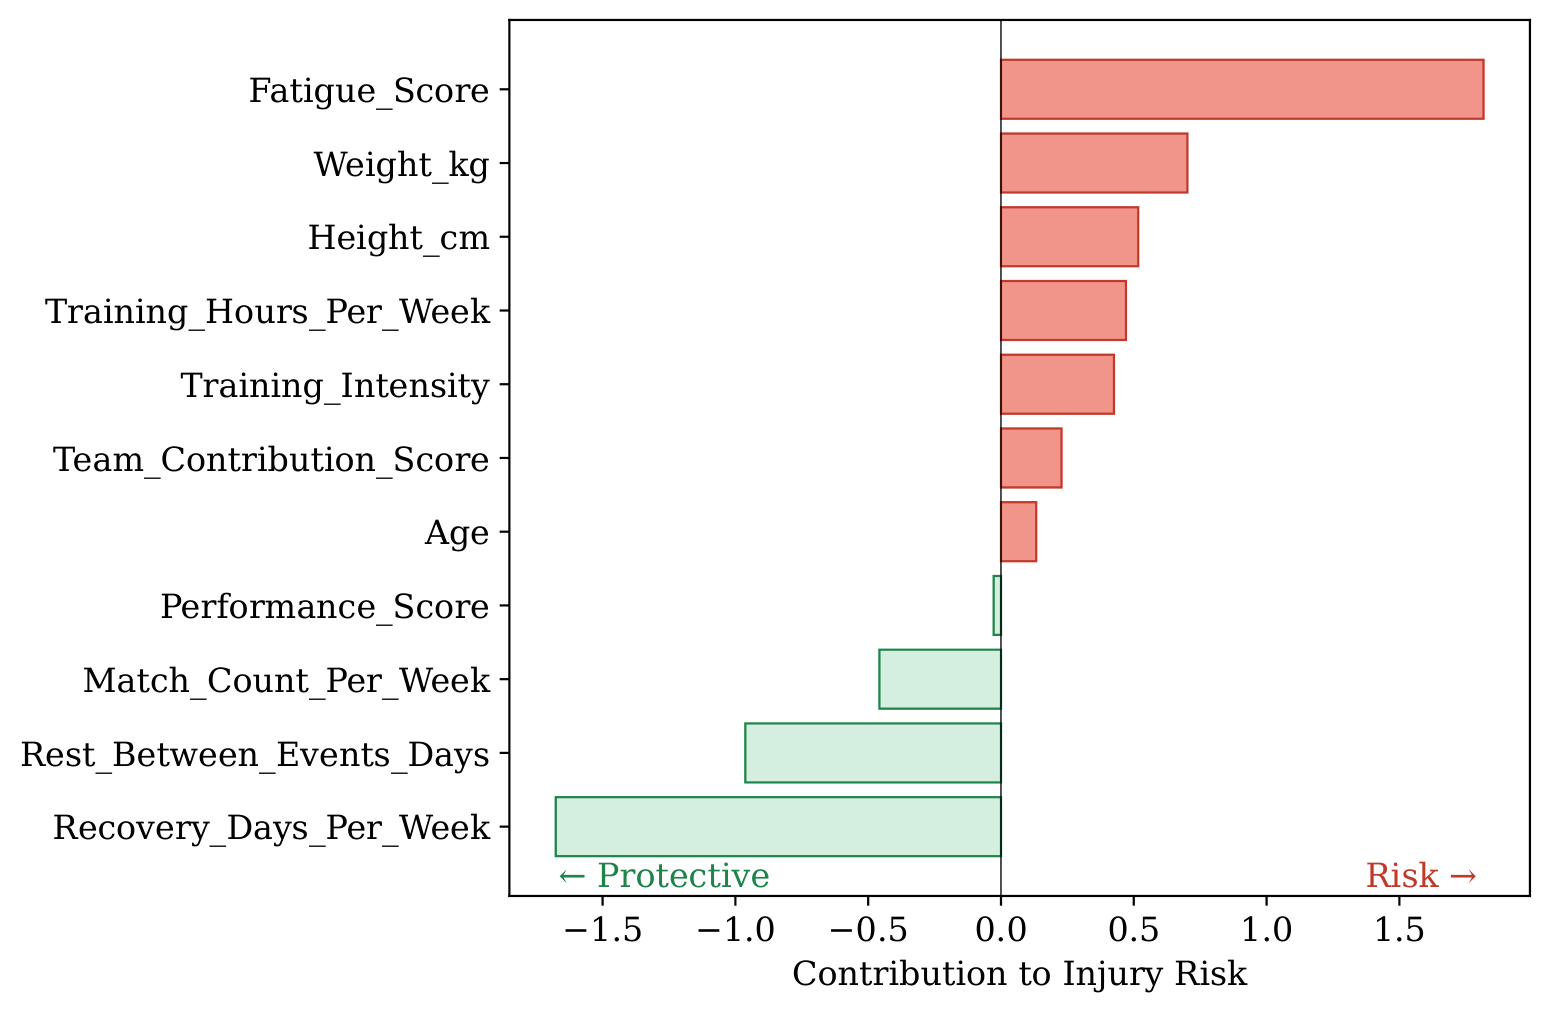
Feature importance was computed by back-projecting the logistic regression coefficients through the PCA loading matrix. Figure 2 shows the contribution of each original variable to the overall injury risk score across all 8 principal components. The original variable most strongly associated with increased injury risk was Fatigue_Score, while Recovery_Days_Per_Week was most strongly associated with reduced risk. Bootstrap analysis showed that all PCA loadings were unstable across resamples. These feature importance values represent the specific solution obtained from the full dataset.
Cross-Validated Risk Profiles
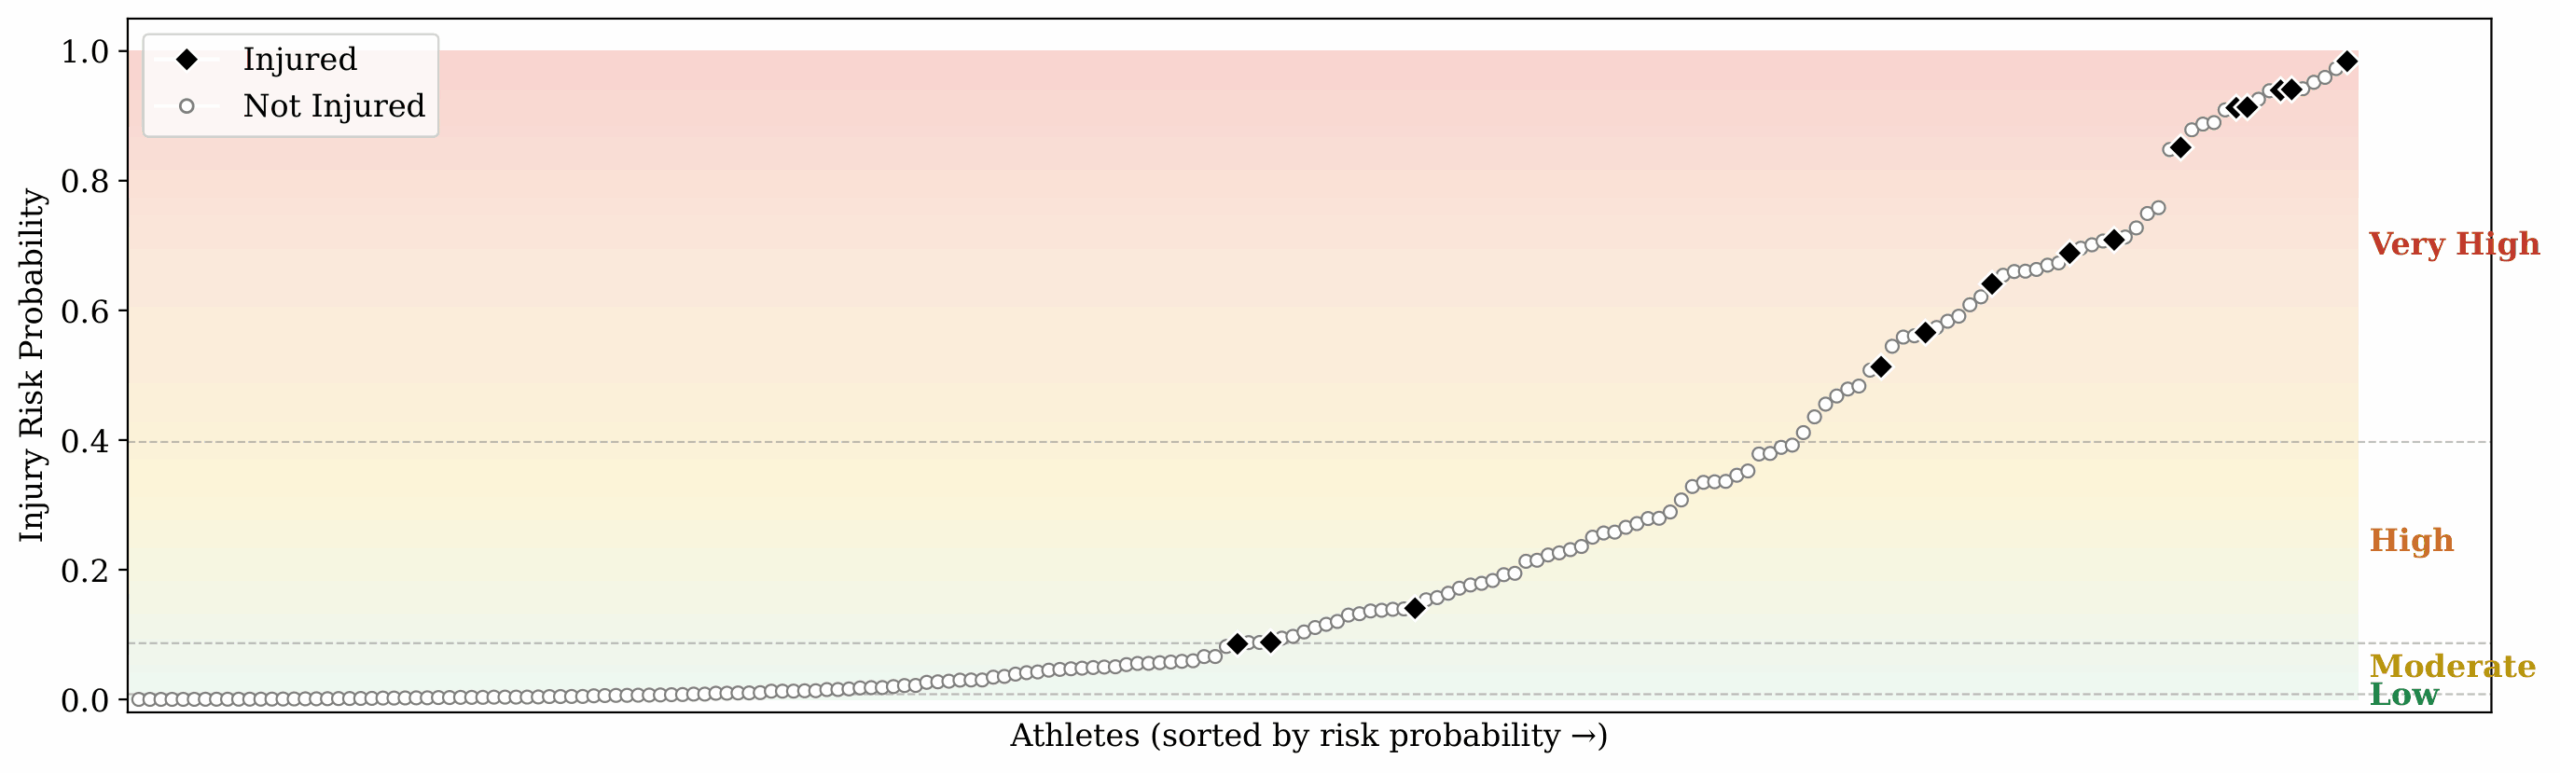
Cross-validated injury risk probabilities were generated using 5-fold stratified cross-validation with scaling, PCA, and logistic regression performed within each fold to prevent data leakage. Each athlete received a probability estimate from a model that never included that athlete in training. Athletes were then classified into four risk groups based on quartiles of these probabilities (Table 7).
| Profile | n | Injured | Rate | Probability Range |
| Very High | 50 | 11 | 22% | 0.412 – 0.984 |
| High | 50 | 2 | 4% | 0.088 – 0.392 |
| Moderate | 50 | 1 | 2% | 0.008 – 0.086 |
| Low | 50 | 0 | 0% | 0.000 – 0.008 |
Fisher’s exact (High+VeryHigh vs Moderate+Low): OR = 14.79, p = 0.0013
The mean cross-validated Brier score was 0.129, which is greater than the naive baseline of 0.065 (Brier skill score = -0.98). The ROC curve for Dataset 1 (Figure 3) shows the discriminative performance of the 8-component model.
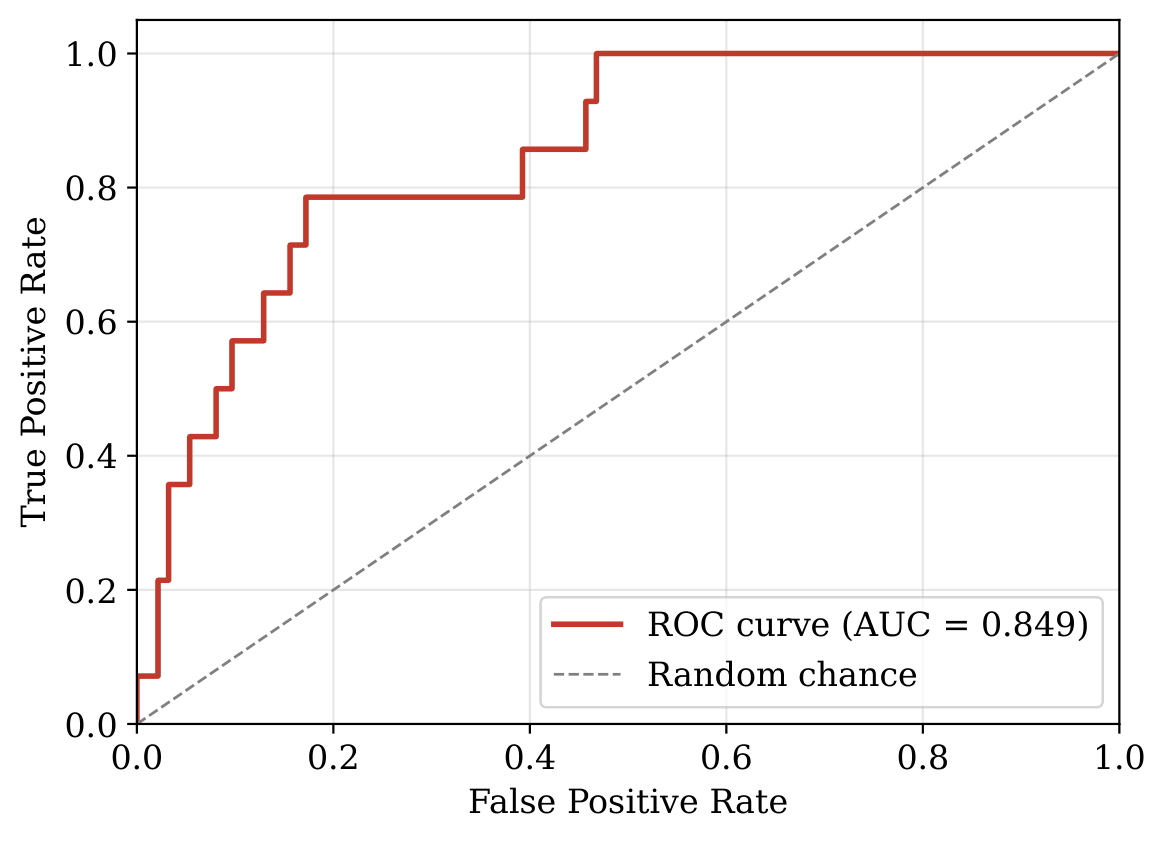
Figure 4 shows each athlete’s cross-validated injury probability on a heatmap, sorted from lowest to highest risk. Black diamonds indicate athletes who actually sustained injuries.
Dataset 2: Basketball Player Injury in Sports Rehabilitation
Data Validation
The observed injury recurrence rate was 25.0%. Athletes with recurrent injuries demonstrated longer rehabilitation time, increased knee angle, and greater ankle flexion4. Similar to Dataset 1, Dataset 2 also had a balanced and realistic data distribution without major outliers as most variables showed skewness values close to zero and slightly negative kurtosis values. However, several inter-variable correlations did not match expected physiological relationships. This included age vs. rehabilitation time (r = -0.121), knee angle vs. ankle flexion (r = -0.027), and speed vs. reaction time (r = +0.117). Contrary to expectations, minimal differences were observed between recurrent and non-recurrent athletes for rehabilitation efficiency score and injury severity. Recurrent athletes showed slightly lower body weight.
PCA and Component Selection
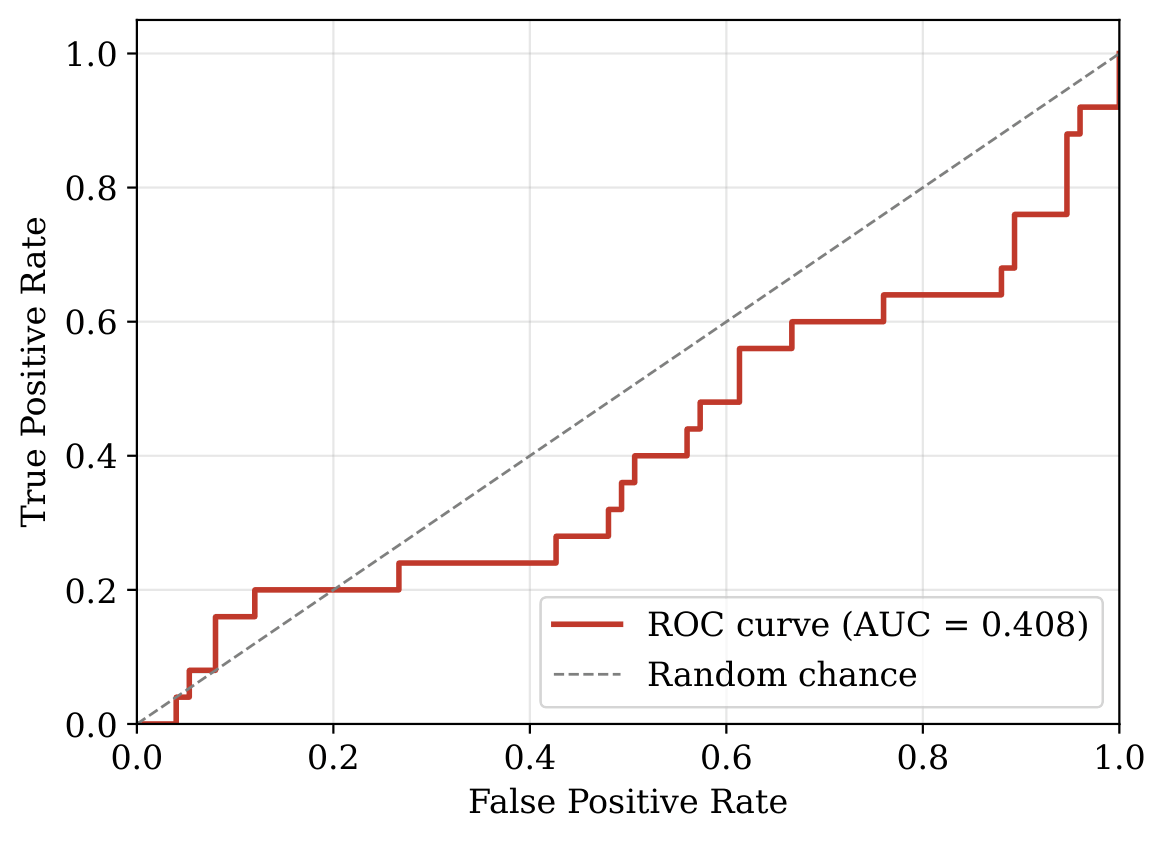
PCA on this dataset produced 11 principal components after inclusion of ordinal-encoded Injury_Severity (Figure 5). No combination of principal components or classifiers achieved AUC meaningfully above chance (Table 8). The best result was achieved by SVM for the top 8 PCs with an AUC of 0.575. All 95% confidence intervals included 0.5 (Figure 6).
| Classifier | AUC | Std | 95% CI | Var Explained |
| Logistic Regression – All PCs | 0.570 | 0.134 | 0.360 – 0.797 | 100.0% |
| Random Forest – All PCs | 0.528 | 0.143 | 0.221 – 0.827 | 100.0% |
| Gradient Boosting – All PCs | 0.539 | 0.128 | 0.323 – 0.733 | 100.0% |
| SVM – Top 8 PCs | 0.575 | 0.122 | 0.299 – 0.760 | 82.3% |
| SVM – All PCs | 0.454 | 0.108 | 0.280 – 0.653 | 100.0% |
Dataset 3: Multimodal Sports Injury Dataset
Data Validation
The observed high-risk prevalence was 31.7% (13 of 41 athletes), based on a mean injury severity score threshold greater than 0.5 on the 0-2 scale. Similar to the previous datasets, data distribution was balanced and realistic, without major outliers, as indicated by mild skewness and near-normal kurtosis values in most variables. This dataset presented strong expected inter-variable relationships for recovery score vs. sleep quality (r = +0.786), training intensity vs. fatigue index (r = +0.485), training duration vs. fatigue index (r = +0.393), heart rate vs. training intensity (r = +0.186), and recovery score vs. fatigue index (r = -0.589). High-risk athletes generally demonstrated lower recovery scores, lower sleep quality, higher fatigue index, and slightly elevated heart rate7. Minimal differences were observed for training intensity, training duration, and stress level. However, the dataset contained an observation-to-variable ratio of 2.0:1 (41 observations across 20 variables) which is below the recommended minimum ratio of 5:1 for robust PCA solutions25.
Aggregation Window Selection
To convert Dataset 3’s longitudinal data into athlete level cross-sectional data, session-level data was aggregated over five candidate time windows (Table 5). The 4-week (16-session) window was selected for analysis based on the computed AUC (0.764 ± 0.118, 95% CI: 0.597-0.912) and current literature21.
PCA and Component Selection
After excluding training_load (a derived feature, r = 0.83 with training_intensity × training_duration) and removing injury-related columns from the feature set, PCA produced 20 principal components from 20 features across 41 athletes (Figure 7).
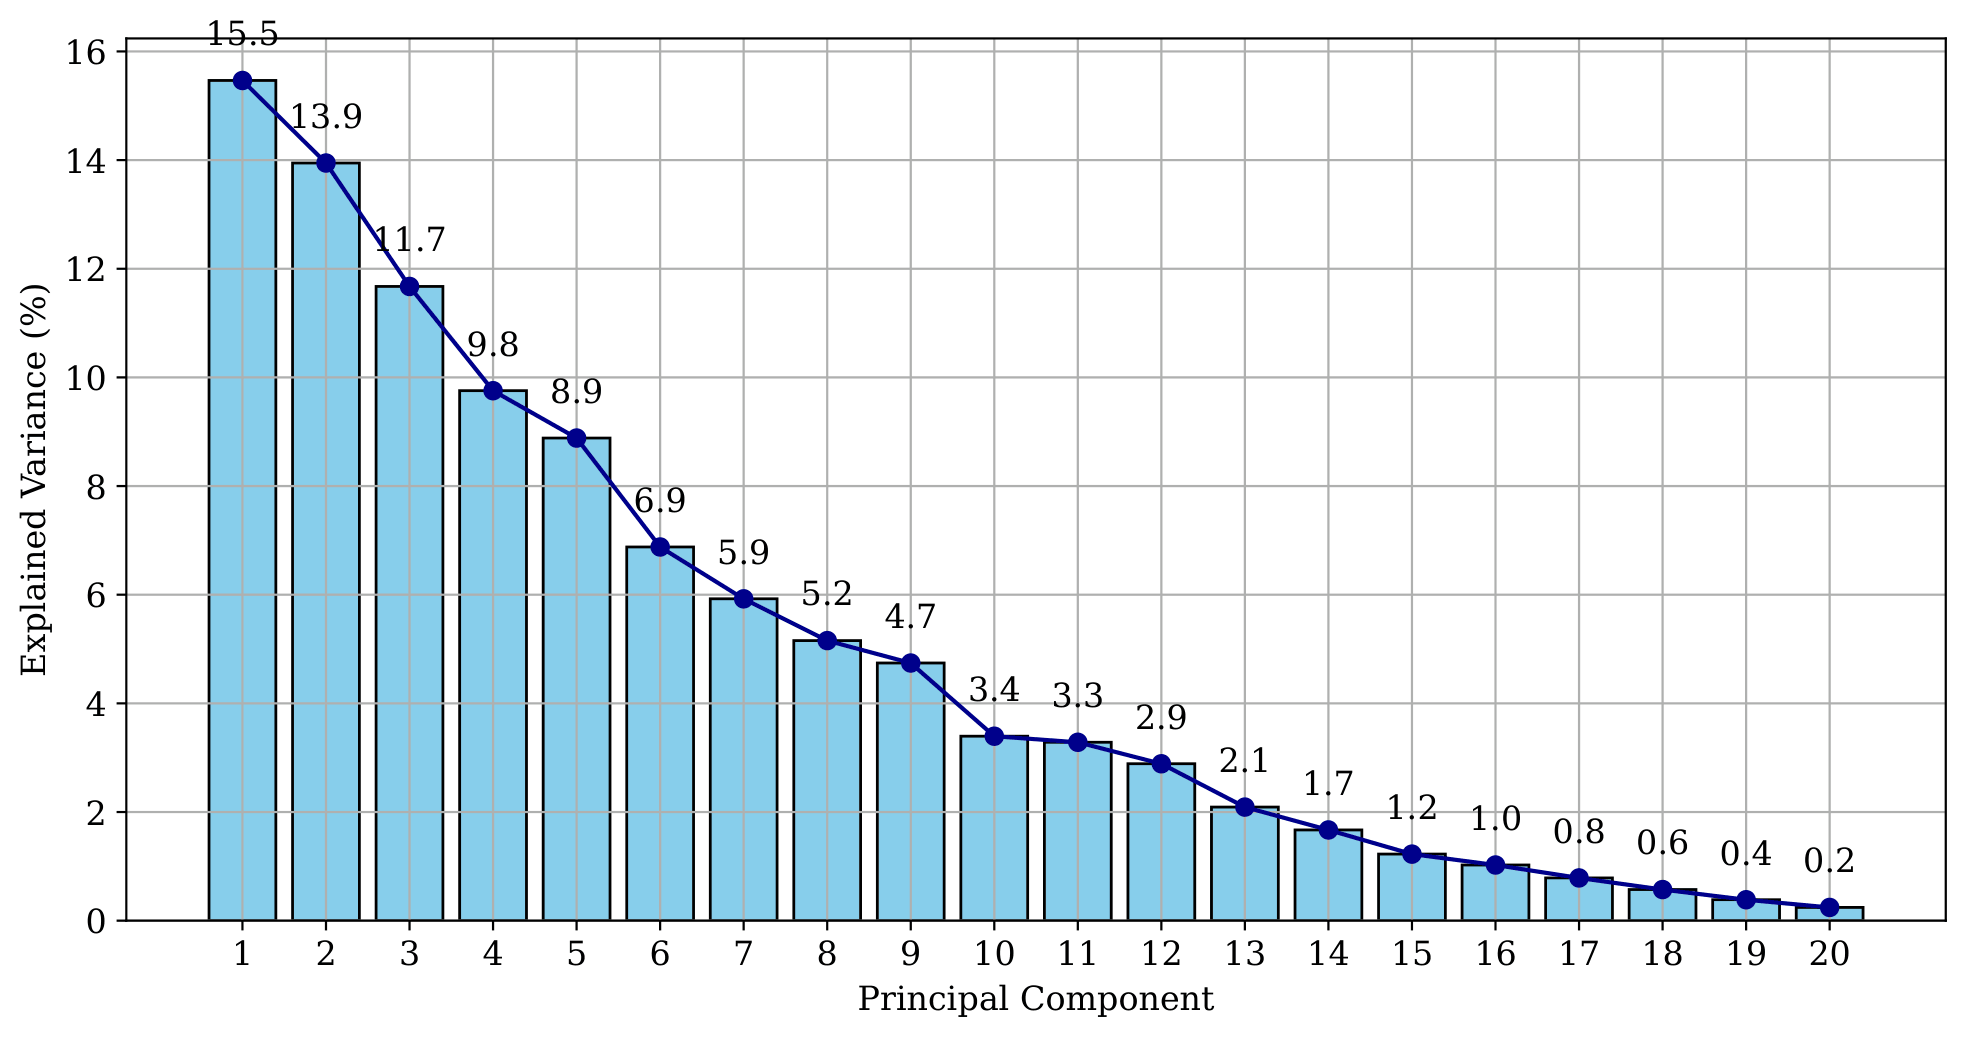
Cross-validated AUC did not show a clear plateau across principal component counts (Table 9). Top 10 PCs (0.759 ± 0.174) produced the highest AUC value, although all 95% confidence intervals included 0.5. The best PCA-based result (AUC = 0.759) did not perform better than the baseline logistic regression without PCA (AUC = 0.764).
| PC Combination | AUC | Std | 95% CI | Var Explained |
| PC1 only | 0.689 | 0.196 | 0.309 – 1.000 | 15.5% |
| Top 8 PCs | 0.673 | 0.211 | 0.222 – 1.000 | 77.7% |
| Top 10 PCs | 0.759 | 0.174 | 0.358 – 1.000 | 85.8% |
| All 20 PCs | 0.741 | 0.167 | 0.352 – 1.000 | 100.0% |
Bootstrap stability analysis (1,000 resamples) showed that 100% of feature-component loading pairs (200/200) had 95% confidence intervals crossing zero, with a mean coefficient of variation of 1792%.
Feature Importance
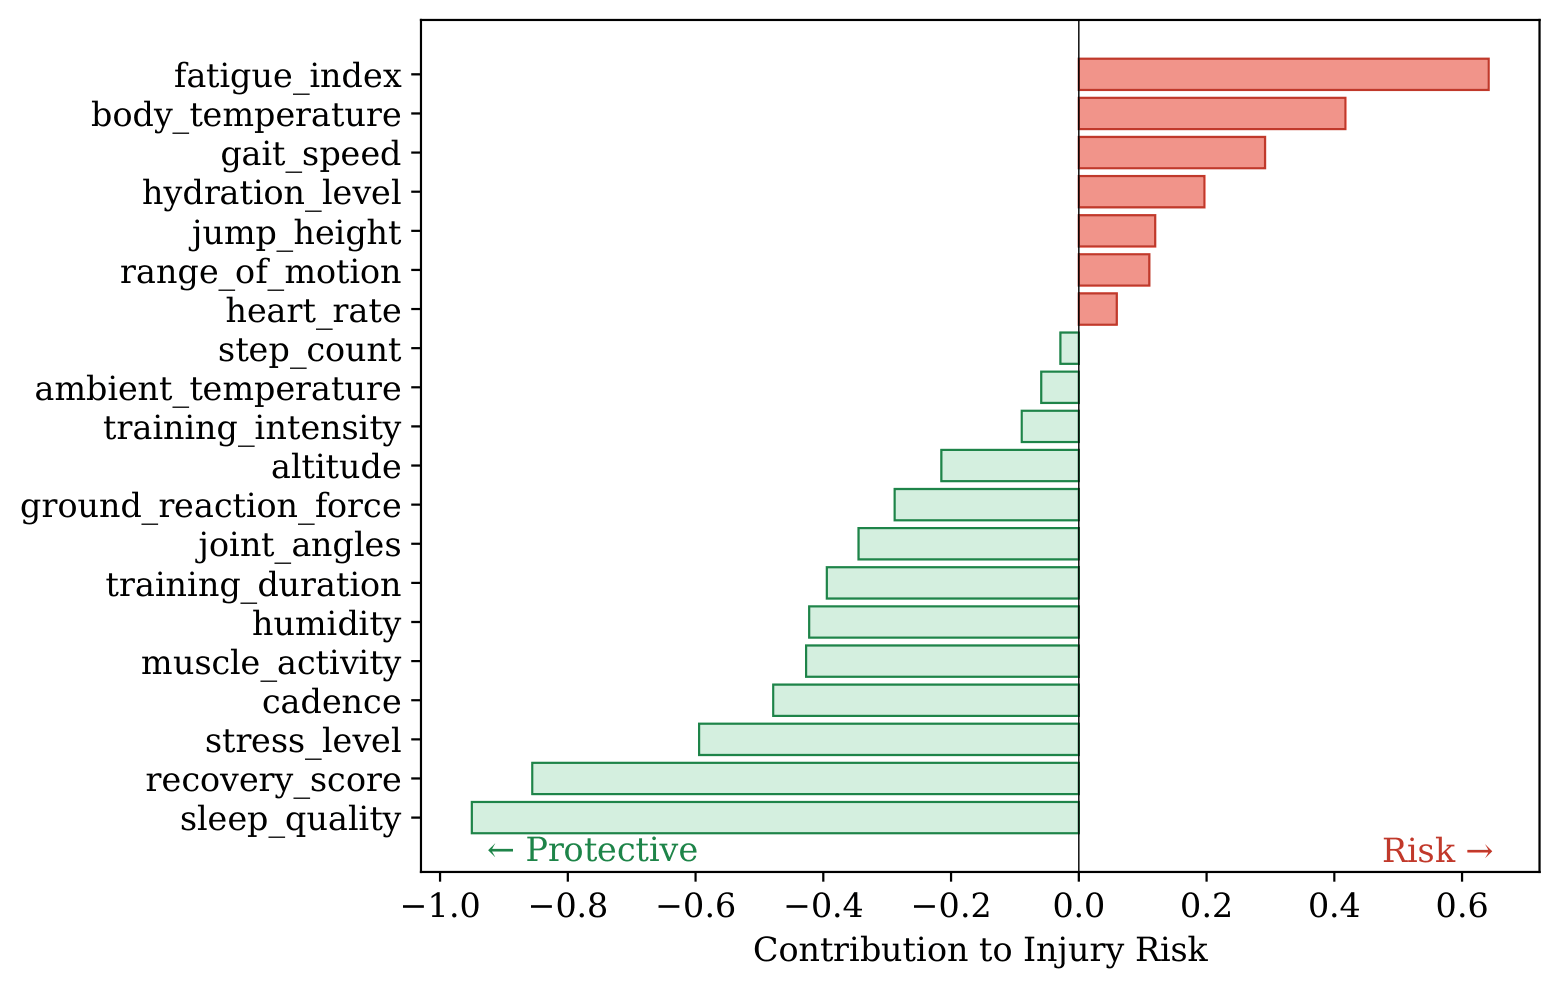
Feature importance was computed for exploratory purposes by back-projecting the logistic regression coefficients through the PCA loading matrix using the top 10 principal components (Figure 8). Recovery_score and sleep_quality emerged as the strongest protective factors, while fatigue_index and heart_rate were the strongest risk factors. Since all 95% confidence intervals for AUC included 0.5, these feature importance values are reported for exploratory purposes only.
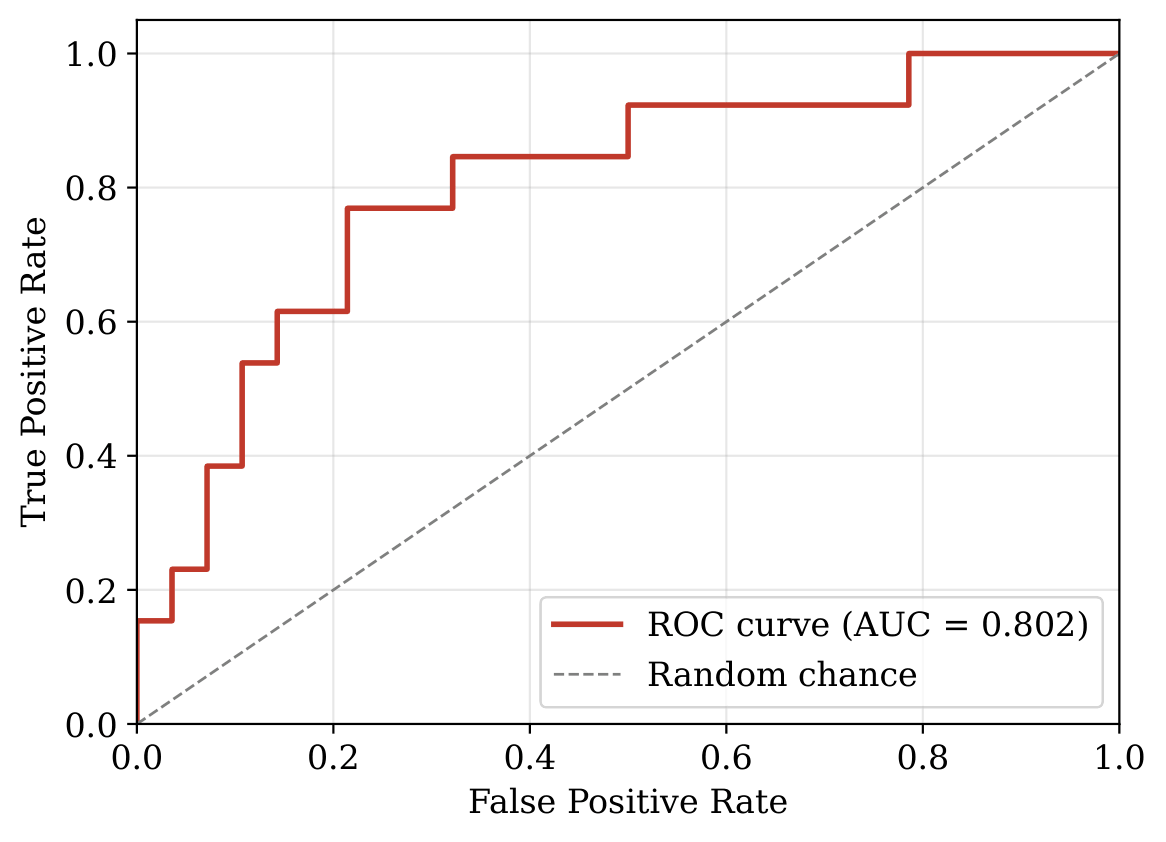
The ROC curve for Dataset 3 (Figure 9, AUC = 0.802) reflects a single cross-validation pass. The repeated cross-validation mean was 0.759 ± 0.174.
Discussion
Framework Performance with Training Load Data
The framework produced strong discrimination when applied to Dataset 1 (AUC = 0.855 ± 0.091, 95% CI: 0.672-0.980), which contained training load and recovery features for 200 athletes. Using feature analysis, fatigue score was found to be the strongest risk-associated variable and recovery days were the strongest protective variable. Although these results followed the trend shown in published sports medicine literature on load management and recovery7,8, bootstrap analysis showed loading-derived importance values were unstable because of a weak inter-variable connection structure in the dataset. Therefore, the risk and protective variables found by the framework should be considered hypothesis generating.
Although training hours showed a positive relationship with injury risk, it reflected only one side of the relationship. Insufficient training load can also increase injury risk through inadequate preparation26,22. A sudden increase in acute/chronic workload is more strongly associated with injury risk than absolute training volume26,22.
Due to the application of balanced class weighting to a highly imbalanced dataset (7% injury rate), the model ranked athletes effectively by risk, but the absolute probability estimates were poorly calibrated as shown by the negative Brier skill score (-0.98). The risk profiles in Table 7 should be interpreted as relative risk rankings, not as precise injury probabilities.
Exploratory feature importance from Dataset 3 identified recovery score and sleep quality as protective factors, though these values require caution given the small sample size. A previous study achieved AUC = 0.76 using a similar approach on Australian football data16. The Dataset 1 AUC compares favorably, though direct comparison is limited by the synthetic data.
Framework Limitations with Biomechanical Data
Dataset 2 did not yield discriminative PCA components and no classifier or PC combination achieved AUC above chance. Therefore, static biomechanical measurements and rehabilitation outcomes likely did not contain sufficient signal for recurrence prediction. The framework was not effective on this dataset because it requires modifiable training and recovery variables measured over time, which contrast with the static biomechanical snapshots.
Sample Size Constraints and Dataset 3
While Dataset 3 had the most realistic multivariate structure of the three datasets, with strong and physiologically accurate inter-variable correlations (e.g., recovery_score vs. sleep_quality r = +0.79, recovery_score vs. fatigue_index r = -0.59), the observation-to-variable ratio of 2.0:1 was below the recommended minimum of 5:125. Bootstrap analysis found loading instability in this dataset (100% of confidence intervals crossing zero, CV = 1792%) because the model did not have enough information to identify the feature with the greatest importance. The framework did not produce better discrimination than that of baseline logistic regression (window selection AUC = 0.764 vs. best PCA AUC = 0.759), and all 95% confidence intervals included 0.5.
Data Quality and Synthetic Data Limitations
Data in Dataset 1 appeared to be randomly generated as shown by the data distributions (kurtosis ≈ -1.2) with minimal correlation between variables (e.g., Height vs. Weight r = 0.03). Dataset 3 showed a more realistic structure with data having varied distributions (kurtosis range: -0.98 to +0.59) with some correlations. However, even with better quality data, Dataset 3’s AUC was lower and less stable than Dataset 1’s AUC. Dataset 3 had the lowest sample size with just 41 athletes, indicating that good data was not the only factor for the model to work as designed.
Dataset 1 produced the strongest AUC yet had the least realistic correlation structure. The strong discrimination may reflect the simplicity of the synthetic signal – independent variables with clear marginal differences between groups – rather than the framework’s ability to extract latent structure from correlated real-world data. Bootstrap analysis confirmed this. PCA loadings were completely unstable for Dataset 1 (100% of confidence intervals crossing zero), meaning PCA could not identify stable latent dimensions even as the downstream classifier achieved strong discrimination through the full component space. Real athlete data would contain stronger natural correlations, and AUC values obtained here may not generalize to such settings.
Despite these limitations, Dataset 1 and Dataset 2 have been used in peer-reviewed research17,18. The PCA framework itself is methodologically sound and transferable to real data.
Statistical Limitations
Risk groups contained as few as 50 athletes (Dataset 1). The selection of the PC count was data driven based on cross-validated AUC and may not be generalized. For Dataset 1, component selection did not matter as AUC was almost the same whether 8 or all 11 components were selected (0.855 vs. 0.854). For Dataset 3, no component count produced a stable, standout AUC, and every result’s confidence interval included 0.5. None of these component counts could be reliably distinguished from random guessing regardless of which one was chosen. Dataset 3 lacked verified provenance and its results were exploratory. External validation was not performed on Dataset 3. The use of out-of-fold predictions produces an estimate of how the model performs when given athletes it never saw.
Dataset 1’s AUC across 8-11 components (0.855 – 0.854) did not change by much and Dataset 3’s PCA-based AUC (0.759) was slightly lower than the non-PCA baseline (0.764). Bootstrap analysis showed these loadings were unstable across resamples. This shows that the variables in the datasets did not have a strong, consistent shared structure for PCA to add value. The remaining potential benefit of this framework was the ability to back-project logistic regression coefficients through the PCA loadings to see which original variables were driving risk. Given the loading instability, the interpretability benefit could not be reliably established with the current datasets.
Future Work
Validation with prospectively collected, clinically documented basketball cohorts is the essential next step. Such a study would need a sample large enough to meet the 5:1 observation-to-variable ratio this analysis showed was necessary for stable PCA solutions, ideally across multiple teams or seasons.
Integration with wearable monitoring systems could enable real-time risk assessment rather than the retrospective analysis performed here. Realizing this would require solving two problems this study encountered – verified, real-world data collection and sample sizes large enough to produce stable, well-calibrated risk estimates rather than the wide confidence intervals and poor calibration observed in this analysis.
The framework could also be extended to incorporate temporal modeling, such as LSTM networks, for session-level prediction. Dataset 3 originally consisted of session-by-session data. This data was aggregated into a single 4-week athlete-level profile for this analysis, losing the session-to-session pattern. A temporal model could use that session-level structure to capture trends or spikes in training load and recovery over time.
Conclusion
This study developed a PCA-based analytical framework that compresses a large set of correlated athlete monitoring variables into a smaller number of uncorrelated components. The framework then uses these components to classify athletes by injury risk and to trace which original variables are driving that classification. This framework was applied to three publicly available benchmark basketball injury datasets for evaluation.
For Dataset 1, with sufficient sample size, the model could reliably differentiate between injured and uninjured athletes based on training and recovery data alone (AUC = 0.855, 95% CI: 0.672-0.980). The odds of an athlete in a high-risk group getting injured were about 15 times higher than that of one in a low-risk group (Fisher’s exact test, OR = 14.79, p = 0.0013). Fatigue score emerged as an injury risk factor and recovery days as a protective factor. However, bootstrap analysis flagged these findings as unstable across resamples. The model performed better at ranking athletes by their risk of injury than predicting their precise probability of injury (Brier skill score = -0.98).
The framework did not reliably identify which athletes were at risk for Dataset 2 (AUC ≈ 0.5) which contained biomechanical and rehabilitation features and Dataset 3 (AUC = 0.759, 95% CI including 0.5) with a small sample size. Since Dataset 3’s AUC could not be statistically distinguished from random chance, the feature importance was exploratory and revealed recovery score and sleep quality as protective factors. A larger data sample with a 5:1 observation-to-variable ratio is required for these findings to be tested with greater statistical confidence.
As the datasets used are synthetic or lack verified provenance, these findings represent a methodological demonstration. The next step is to apply this framework to basketball injury datasets collected through real-world cohort studies before it can inform injury prevention practices.
Acknowledgments
The author thanks David Nguyen for guidance on data analysis techniques and for assistance in identifying publicly available datasets used in this study. The author also acknowledges the Lumiere Research Program writing coaches for feedback on manuscript clarity and organization. All analytical decisions, data interpretation, and scientific conclusions are the author’s own. The literature review, data analysis, and writing were conducted by the author.
Dataset Availability Statement
All three datasets were sourced from the Kaggle public data repository. Dataset 1 was sourced from “Athlete Injury and Performance Dataset” available at https://www.kaggle.com/datasets/ziya07/athlete-injury-and-performance-dataset. This dataset was previously used in BMC Sports Science, Medicine & Rehabilitation17. Dataset 2 was sourced from “Basketball player injury in sports rehabilitation” dataset available at https://www.kaggle.com/datasets/ziya07/basketball-player-injury-in-sports-rehabilitation. This dataset was previously used in Molecular & Cellular Biomechanics18. Dataset 3 was sourced from “Multimodal Sports Injury Dataset” available at https://www.kaggle.com/datasets/anjalibhegam/multimodal-sports-injury-dataset.
References
- R. Gottlieb, A. Shalom, J. Calleja-Gonzalez. Physiology of basketball – field tests. Journal of Human Kinetics. Vol. 77, pg. 159-167, 2021, https://doi.org/10.2478/hukin-2021-0018. [↩]
- S. N. Morris, A. Chandran, L. B. Lempke, A. J. Boltz, H. J. Robison, C. L. Collins. Epidemiology of injuries in National Collegiate Athletic Association men’s basketball: 2014-2015 through 2018-2019. Journal of Athletic Training. Vol. 56(7), pg. 681–687, 2021, https://doi.org/10.4085/1062-6050-436-20. [↩]
- L. B. Lempke, A. Chandran, A. J. Boltz, H. J. Robison, C. L. Collins, S. N. Morris. Epidemiology of injuries in National Collegiate Athletic Association women’s basketball: 2014-2015 through 2018-2019. Journal of Athletic Training. Vol. 56(7), pg. 674–680, 2021, https://doi.org/10.4085/1062-6050-466-20. [↩]
- L. Guo, J. Zhang, Y. Wu, L. Li. Prediction of the risk factors of knee injury during drop-jump landing with core-related measurements in amateur basketball players. Frontiers in Bioengineering and Biotechnology. Vol. 9, pg. 738311, 2021, https://doi.org/10.3389/fbioe.2021.738311. [↩] [↩]
- F. Tosarelli, M. Buckthorpe, S. Di Paolo, A. Grassi, G. Rodas, S. Zaffagnini, G. Nanni, F. Della Villa. Video analysis of anterior cruciate ligament injuries in male professional basketball players: injury mechanisms, situational patterns, and biomechanics. Orthopaedic Journal of Sports Medicine. Vol. 12(3), pg. 23259671241234880, 2024, https://doi.org/10.1177/23259671241234880. [↩]
- G. D. McKay, P. A. Goldie, W. R. Payne, B. W. Oakes. Ankle injuries in basketball: injury rate and risk factors. British Journal of Sports Medicine. Vol. 35(2), pg. 103–108, 2001, https://doi.org/10.1136/bjsm.35.2.103. [↩]
- C. C. Chan, P. S. Yung, K. M. Mok. The relationship between training load and injury risk in basketball: a systematic review. Healthcare (Basel, Switzerland). Vol. 12(18), pg. 1829, 2024, https://doi.org/10.3390/healthcare12181829. [↩] [↩] [↩] [↩] [↩]
- T. Edwards, T. Spiteri, B. Piggott, J. Bonhotal, G. G. Haff, C. Joyce. Monitoring and managing fatigue in basketball. Sports (Basel, Switzerland). Vol. 6(1), pg. 19, 2018, https://doi.org/10.3390/sports6010019. [↩] [↩]
- C. Leckey, N. van Dyk, C. Doherty, A. Lawlor, E. Delahunt. Machine learning approaches to injury risk prediction in sport: a scoping review with evidence synthesis. British Journal of Sports Medicine. Vol. 59(7), pg. 491–500, 2025, https://doi.org/10.1136/bjsports-2024-108576. [↩] [↩] [↩]
- J. Ma, S. Liu, Y. Pei. SHAP-based interpretable machine learning for injury risk prediction in university football players: a multi-dimensional data analysis approach. Scientific Reports. Vol. 15(1), pg. 40252, 2025, https://doi.org/10.1038/s41598-025-24144-y. [↩] [↩]
- J. D. Stone, J. J. Merrigan, J. Ramadan, R. S. Brown, G. T. Cheng, W. G. Hornsby, H. Smith, S. M. Galster, J. A. Hagen. Simplifying external load data in NCAA Division-I men’s basketball competitions: a principal component analysis. Frontiers in Sports and Active Living. Vol. 4, pg. 795897, 2022, https://doi.org/10.3389/fspor.2022.795897. [↩]
- J. A. J. Keogh, M. C. Ruder, K. White, M. G. Gavrilov, S. M. Phillips, J. J. Heisz, M. J. Jordan, D. Kobsar. Longitudinal monitoring of biomechanical and psychological state in collegiate female basketball athletes using principal component analysis. Translational Sports Medicine. Vol. 2024, pg. 7858835, 2024, https://doi.org/10.1155/2024/7858835. [↩]
- W. Wu. Injury analysis based on machine learning in NBA data. Journal of Data Analysis and Information Processing. Vol. 8, pg. 295-308, 2020, https://doi.org/10.4236/jdaip.2020.84017. [↩]
- L. C. Benson, O. B. A. Owoeye, A. M. Räisänen, C. Stilling, W. B. Edwards, C. A. Emery. Magnitude, frequency, and accumulation: workload among injured and uninjured youth basketball players. Frontiers in Sports and Active Living. Vol. 3, pg. 607205, 2021, https://doi.org/10.3389/fspor.2021.607205. [↩]
- S. J. Ibáñez, M. Rico-González, C. D. Gómez-Carmona, J. Pino-Ortega. Physical workload patterns in U-18 basketball using LPS and MEMS data: a principal component analysis by quarter and playing position. Sensors (Basel, Switzerland). Vol. 25(19), pg. 6253, 2025, https://doi.org/10.3390/s25196253. [↩]
- D. L. Carey, K. Ong, R. Whiteley, K. M. Crossley, J. Crow, M. E. Morris. Predictive modelling of training loads and injury in Australian football. International Journal of Computer Science in Sport. Vol. 17(1), pg. 49-66, 2018, https://doi.org/10.2478/ijcss-2018-0002. [↩] [↩]
- S. Raju, K. K. Singamaneni, L. B. Hooi, K. U. Rani, B. Chandrika. Machine learning framework for predicting athletic injuries and optimising performance. BMC Sports Science, Medicine & Rehabilitation. Vol. 18(1), pg. 107, 2026, https://doi.org/10.1186/s13102-025-01502-x. [↩] [↩] [↩]
- X. Li. Research on the biomechanical characteristics of basketball player injuries and their application in sports rehabilitation. Molecular & Cellular Biomechanics. Vol. 21(3), pg. 493, 2024, https://doi.org/10.62617/mcb493. [↩] [↩] [↩]
- X. Ye, Y. Huang, Z. Bai, Y. Wang. A novel approach for sports injury risk prediction: based on time-series image encoding and deep learning. Frontiers in Physiology. Vol. 14, pg. 1174525, 2023, https://doi.org/10.3389/fphys.2023.1174525. [↩]
- I. T. Jolliffe, J. Cadima. Principal component analysis: a review and recent developments. Philosophical Transactions. Series A, Mathematical, Physical, and Engineering Sciences. Vol. 374(2065), pg. 20150202, 2016, https://doi.org/10.1098/rsta.2015.0202. [↩]
- P. C. Bourdon, M. Cardinale, A. Murray, P. Gastin, M. Kellmann, M. C. Varley, T. J. Gabbett, A. J. Coutts, D. J. Burgess, W. Gregson, N. T. Cable. Monitoring athlete training loads: consensus statement. International Journal of Sports Physiology and Performance. Vol. 12(Suppl 2), pg. S2161–S2170, 2017, https://doi.org/10.1123/IJSPP.2017-0208. [↩] [↩]
- T. J. Gabbett. The training-injury prevention paradox: should athletes be training smarter and harder?. British Journal of Sports Medicine. Vol. 50(5), pg. 273–280, 2016, https://doi.org/10.1136/bjsports-2015-095788. [↩] [↩] [↩]
- G. S. Collins, P. Dhiman, J. Ma, M. M. Schlussel, L. Archer, B. Van Calster, F. E. Harrell Jr., G. P. Martin, K. G. M. Moons, M. van Smeden, M. Sperrin, G. S. Bullock, R. D. Riley. Evaluation of clinical prediction models (part 1): from development to external validation. BMJ (Clinical research ed.). Vol. 384, pg. e074819, 2024, https://doi.org/10.1136/bmj-2023-074819. [↩]
- A. M. Montalvo, D. K. Schneider, K. E. Webster, L. Yut, M. T. Galloway, R. S. Heidt Jr., C. C. Kaeding, T. E. Kremcheck, R. A. Magnussen, S. N. Parikh, D. T. Stanfield, E. J. Wall, G. D. Myer. Anterior cruciate ligament injury risk in sport: a systematic review and meta-analysis of injury incidence by sex and sport classification. Journal of Athletic Training. Vol. 54(5), pg. 472–482, 2019, https://doi.org/10.4085/1062-6050-407-16. [↩]
- J. W. Osborne, A. B. Costello. Sample size and subject to item ratio in principal components analysis. Practical Assessment, Research, and Evaluation. Vol. 9(1), pg. 11, 2004, https://doi.org/10.7275/ktzq-jq66. [↩] [↩]
- T. Caparrós, M. Casals, Á. Solana, J. Peña. Low external workloads are related to higher injury risk in professional male basketball games. Journal of Sports Science & Medicine. Vol. 17(2), pg. 289–297, 2018. [↩] [↩]