
Abstract
With the emergence of artificial intelligence, researchers now explore unstructured data through large language models (LLMs), applied to materials such as company earnings transcripts with some positive outcomes noted. Although much work covers how large language models sort text, only a small number examine whether they produce same-day shifts across economic sectors. This study shows that when guided by specific directions, a large model can partially forecast movement between industry segments in the United States during trading hours based on real-time financial disclosures. Though built without prior examples in some cases, the system learns from 4,200 financial reports between 2015 and 2024 across six key industries through a repeatable process mindful of expense, handling text cleanup, prompt setup, output generation, and data extraction. Each run costs about 7.2 × 10⁻⁵, calculated using standard rates for GPT-3.5-turbo during 2024. When tested on unseen records totaling 600 instances, correct predictions appear in just under 57.3 percent of cases; measures like precision, recall, and F1 match that number exactly. Though less powerful than complex sector rotation methods using numeric datasets and custom metrics, the method runs without price history or technical tools, keeping setup lean. What stands out matters most for individual traders facing tight budgets, just as it does for major firms eyeing lightweight LLM frameworks to guide how headlines reshape sector behavior. Progress here might push forward how markets digest public information, adding quiet but steady value to those studying financial narratives.
Keywords: Large language models; financial natural language processing; earnings announcements; sector rotation; machine learning bias; text-based market analysis
Introduction
Forecasting shifts between industry sectors when economic conditions shift is a major challenge for financial investors. Instead of relying solely on traditional tools, some turn to price trends, broad market snapshots, economic data, or company details, though access to such analysis often favors larger players. Processing power matters as well; tiny time windows after earnings news show how fast prices adjust, sometimes within moments. These quick adjustments shrink the chance to act, especially for those without real-time systems.
Updates on company profits shape rapid shifts across sectors more than any other data point. When firms release significant reports, attention sharply toward them, prompting traders to group reactions by industry lines. This collective focus tends to amplify movement within sector-based strategies1. Often, financial updates shift money across industry groups because they bundle results, outlook changes, customer patterns, while also hinting at business challenges. When companies discuss profits, perception around fields shift fast. Information about financial health shapes decisions sharply. A brief line in a report sometimes pushes prices up or down, even when deeper analysis has not started yet. Reading between such statements helps make sense of sudden swings, particularly if resources are limited.
Historically, pulling clear patterns from profit announcements meant using custom-built language tools or niche emotion trackers2. Because such methods showed promise, researchers began turning news snippets into clues about future price shifts3. Rather than relying solely on numbers, modern tools like LLMs detect subtle linguistic cues, condense reports into core developments, while also surfacing underlying topics, capabilities that support broad-scale review of economic reporting4. One shift stands out in recent years: text analysis once limited to well-funded firms is now within reach of many. A Harvard Economics Discussion Paper from 2024 points to this change. Where earlier methods relied on intricate natural language processing, access was mostly held by organizations with strong technical backing. Behind those older systems often sat investor-backed teams focused solely on data modeling. Since models like ChatGPT emerged, interpreting written content no longer demands heavy infrastructure. Instead, meaning can be drawn quickly, without layers of specialized code. Because of this, insights from financial reports or news need not be restricted to large institutes or investors.
Literature Review
Earlier studies into financial language show corporate reports carry detectable patterns affecting markets. Text within filings like 10-Ks reveals subtle cues tied to investor response. Work by Loughran and McDonald5 explored how wording in these documents shifts perception of obligations. Their method used word lists to decode meaning in legal-sounding statements. It was revealed that certain terms predict stock movements more reliably than others. Market reactions often follow emotional tones buried in dry regulatory prose. Though numbers dominate finance, phrasing also steers decisions behind the scenes. Investors react not just to data, but to how it’s framed in official releases. Published in the Journal of Finance in 2011, Loughran and McDonald alo examined how specific wording in annual reports relates to future stock price fluctuations, introducing a tailored set of finance-related terms to capture nuanced sentiment5. That research revealed vocabulary patterns carry predictive value apart from general positivity or negativity. Around the same time, another analysis focused on commentary pieces in the Wall Street Journal, finding increased usage of pessimistic language tended to precede brief declines in overall market levels6. Such work helped show emotional tone in public narratives may influence investor behavior in measurable ways. Because of these findings, researchers began treating written material as a source of actionable data for near-term forecasts. Later assessments across multiple papers support the idea that mining text, from news articles to official statements, can uncover insights tied to real economic outcomes, as one way to predict markets involves extracting data from texts7.
More findings emerge when studying how words affect reactions to earnings news as tone plays a significant role in reactions. Though financial results dominate headlines, subtle shifts in phrasing shift market responses regardless of actual performance. A study by Davis, Piger, and Sedor revealed upbeat wording in official reports links to higher-than-normal stock movements afterward, even when profit deviations are accounted for8. Their work showed language alone can tilt investor behavior upward. Later, Frankel, Mayew, and Sun questioned whether small cues like word choice influence decisions more than assumed9. Tone carries weight beyond raw data. Surprising investors slightly on the downside affects how firms manage communication afterward. Published in Review of Accounting Studies in 2010, Frankel, Mayew, and Sun also examined how communication surrounding earnings announcements influences investor and analyst responses. Aside from just numbers, the way executives communicate also matters. The research relied on textual information rather than financial metrics alone, highlighting that language can shape market perceptions and reactions9.
Deep learning methods, especially those built on transformers, have pushed forward how well machines predict outcomes from financial language. In 2014, Malo and colleagues created the Financial PhraseBank and showed that tailored models beat generic tools when judging tone in economic statements10. Later came FinBERT, a version of BERT refined using financial documents, proving specialized training boosts performance on finance-related sentiment tasks11. While standard models struggle with jargon and context, those tuned on financial data perform better due to familiarity with sector-specific patterns. Evidence from follow-up studies supports this edge, showing marked gains in interpreting reports and disclosures12. Because financial language carries unique traits, generic tools fall short when precision matters, and adaptation to the field becomes essential.
Newer studies explore if large language systems can handle finance predictions without special training first. Work by Lopez-Lira and Tang questions whether tools like ChatGPT approximate stock shifts accurately, testing how well these models foresee returns using only general knowledge13. The study found that sentiment extracted by ChatGPT from financial headlines contained information relevant to predicting subsequent stock returns13. Meanwhile, work by Ke, Stokes, and Mullainathan showed that large language models can detect market developments within articles because guided prompts allow extraction of organized insights despite lacking labeled examples4.
When it comes to sectors, studies reveal a clear order in how stocks perform after companies report earnings. As seen in work by Boudoukh and colleagues, data pulled from financial news can anticipate where sector returns are next directed2. Their analysis ties real-world phenomena directly to future market movements across industries. This reinforces the idea that written content shapes broader predictions. Zhang and Skiena further explored these patterns using computational methods applied to large volumes of news14. Starting from media tone in finance, researchers built market approaches guided by article sentiment. These findings suggest that sentiment extracted from financial news can provide useful information for forecasting market behavior. The results support the broader view that textual signals may contain information relevant to investment decision-making and sector-level analysis15.
Even though plenty of work explores how markets respond to earnings reports, many brief-term sector-switching methods depend mostly on numbers like price movements, historical returns, or chart-based metrics. Earlier efforts using written content typically merge word patterns with numeric data, or overly focus on single-company mood instead of broader industry trends14. This leaves an open question: can compact headline texts by themselves carry clear enough structure to reliably tell apart same-day shifts across sectors? Meanwhile, progress in large language models has allowed nuanced reading of intricate finance-related documents with no manual feature engineering required. Still, questions remain about consistency, systemic biases, and steady performance of these model-driven tools when working strictly with limited textual inputs for short-term industry assessments16.
This work tackles the missing piece: can a text-based large language model, given strict rules and limited to one output category each time, turn brief earnings updates into useful same-day trading choices. Instead of matching complex professional models, it checks if these AI tools find measurable trends using only short written reports. With fixed prompts, predictable outputs, and clear testing steps, the approach explores potential as an affordable option for individual traders.
Problem Formulation
In this study, same-day sector rotation prediction is treated as a constrained multi-class text classification problem. Let Ht = {ht,1, ht,2, …, ht,n} be the set of intraday earnings-related headlines observed up to time t for a given firm on an earnings announcement day. Each headline consists of short-form natural language text summarizing earnings results, guidance updates, or operational commentary.
The prediction task is to map Ht to a single sector label y, where y is an element of Y and Y = {Technology, Healthcare, Finance, Consumer, Energy, Industrial}. The business area for each company making an announcement is based on its official sector classification. These categories follow the Global Industry Classification Standard (GICS) system, commonly applied across finance to group firms by industry. Decisions about predictions rely solely on data present during trading hours of that day; nothing beyond close-time enters the process. Information appearing afterward stays excluded, keeping analysis confined to what was known then.
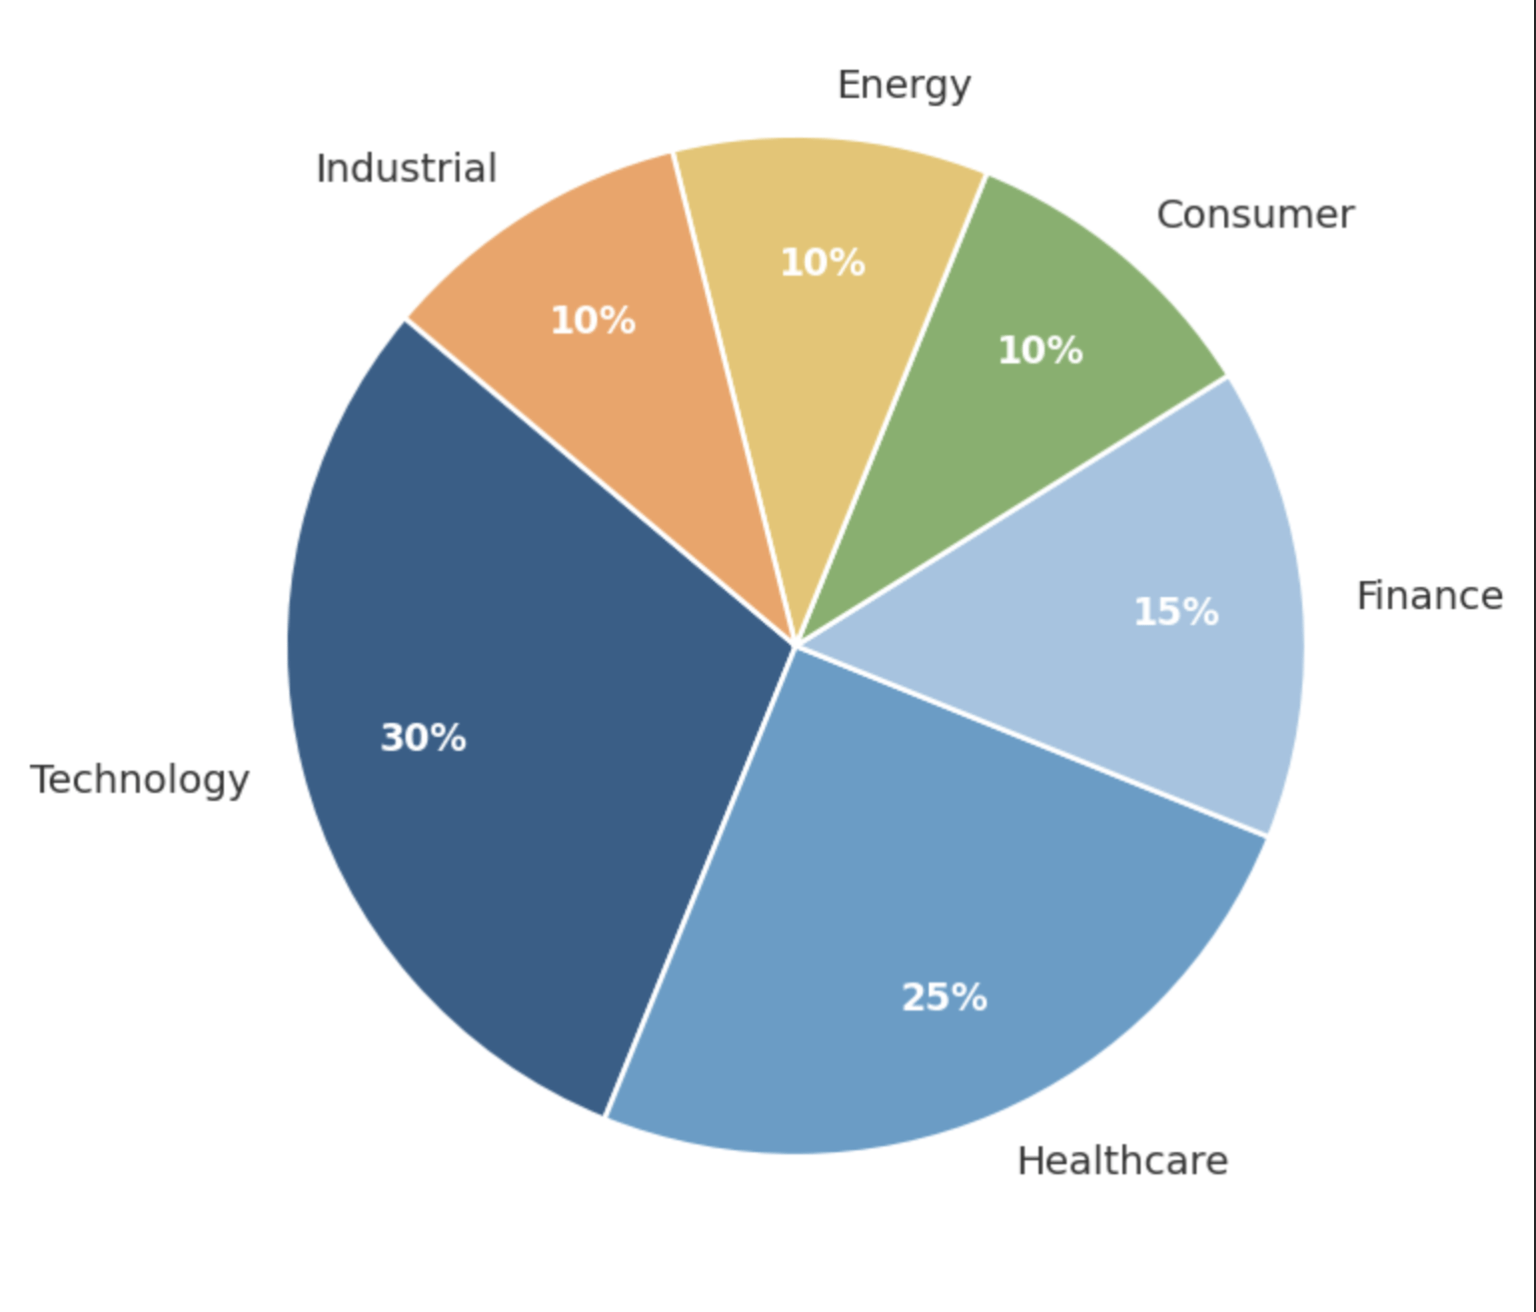
100 samples appear in each sector within the test set, structured deliberately to give every category equal influence when measuring results. Due to this setup, overall accuracy cannot be skewed upward by uneven distribution among groups. Performance checks follow a method consistent with macro-averaging practices applied throughout the research. As a result, outcomes reflect fair comparison across all fields instead of favoring those appearing more frequently.
Operation of the classifier follows specific designed limits. Text alone serves input with financial metrics like price trends, volume data, or return figures excluded. A sector tag must appear as the initial substantive line in replies, ensuring clarity through enforced structure. When the same prompt is processed multiple times, fixed decoding rules produce identical outputs, ensuring consistent and predictable results.
Performance of the model gets checked through accuracy alongside macro-averaged precision, recall, while also considering the F1 score; each metric highlights how well predictions hold across sectors. Instead of chasing higher prediction rates alone, attention shifts toward whether short-term news about earnings holds signal value for sectors, tested under a straightforward, repeatable setup.
Objectives
This study has three primary objectives. First, the study aims to determine whether intraday corporate earnings headlines contain enough information to support non-random same-day sector classification when processed using a text-only LLM. Second, it looks to compare the stability, accuracy, and sector-level bias of zero-shot prompting, few-shot prompting, and supervised fine-tuning under identical instruction constraints. Third, the study aims to analyze the limitations and failures of headline-based sector classification in order to better understand the conditions under which textual signals succeed or break down.
This work examines how one might categorize market sectors on the day they report earnings, using only news headlines from U.S. companies active in public markets from 2015 through 2024. Focused solely on six large industry groupings, it doesn’t forecast single stock behavior or longer-term investment results. Text serves as the core input, as numerical features such as prices and trading volumes are excluded by design, allowing a clearer assessment of the contribution of language alone. Because decisions rely strictly on abbreviated article titles, subtle details buried deeper within official filings could slip past detection. Unequal attention across firms in financial reporting adds another layer where distortions may creep into patterns noticed here. Success is judged via correctness in labeling, not whether any trade based on these labels would have worked out well once placed. As such, practical hurdles such as timing or cost are beyond the scope of this study.
Investor responses to earnings announcements often begin before financial data are fully processed. Narrative finance and information diffusion suggest that market reactions depend not only on the data itself but also on how information is communicated. Earnings headlines signal changes in outlook, demand, and future expectations through their wording, especially during fast trading periods. As similar narratives spread across companies within the same sector, large language models can identify and classify these recurring patterns.
Methods
This study follows an observational, retrospective research design. Historical intraday earnings headlines are analyzed to evaluate the ability of large language models to classify same-day sector behavior under controlled input and output constraints. No interventions are performed, and all analyses are conducted using previously published textual data.
Dataset
We constructed a dataset with 4,200 intraday earnings announcements from 2015 to 2024, covering technology, healthcare, finance, consumer goods, energy, and industrial sectors. The primary data source is the corporate earnings headline dataset published on Kaggle by Sun, which gathers earnings press release summaries and newswire headlines from publicly accessible financial disclosure platforms17. Headlines were further validated against SEC EDGAR filings for completeness. After-hours earnings releases were excluded so that only announcements between 9:30 AM and 4:00 PM Eastern Time on standard trading days were kept.
One detail at a time, every record holds a timestamp marking when news broke. Following that comes the business area, drawn straight from how global indexes classify each company. Headlines or brief reports pulled from official statements make up the rest of the content seen by the system. Labels used as correct answers connect directly to the firm’s own industry code, not what sector happened to rise most that day. The method makes sense upon inspection, as anyone checking a stock symbol can find the matching group without debate. Before feeding data into models, odd symbols were removed, text styling became uniform, and only the first ten updates were kept for any one event linked to a corporation. These top entries, sorted by when they hit wires, formed a timeline; whenever more than one update appeared for the same firm on a single date, they merged into one sequence arranged by clock time. Throughout the study, inputs remain consistent across all cases.
Splitting the data chronologically helped avoid using future details unknowingly. 2015 to 2020 makes up the training portion, while 2021 is used for validation purposes. The years 2022 to 2024 form the final evaluation segment. This ensures that earlier phases never include records from later times. Keeping firms within just a single group prevented overlap between segments so no one company does not appear across multiple sets.
Model Configurations
We use a text-only, instruction-constrained LLM workflow implemented in Python using the OpenAI API. The base model for both the zero-shot and few-shot evaluation setups is gpt-3.5-turbo (version gpt-3.5-turbo-0613). We perform supervised fine-tuning using OpenAI’s fine-tuning API on the same base model. The identical instruction prompt used across all configurations is: “You are a financial sector classifier. Given the following intraday earnings headlines, identify the market sector of the announcing company. Reply with exactly one of: Technology, Healthcare, Finance, Consumer, Energy, Industrial. Your answer must appear as the first line of your response with no additional text.” Output of models is confined to a single sector label on the first line of the response. Three configurations were tested.
The complete pipeline pseudocode is as follows. 1. Data preparation. For each announcement in the dataset, we load the headline strings. We concatenate top-K=10 headline strings in chronological order and assign the GICS sector label as the ground truth label. 2. Inference. We construct the messages array using system role for the instruction prompt and user role for the concatenated headlines. We then call the OpenAI ChatCompletion API with model=”gpt-3.5-turbo-0613″ and temperature=0. We extract the first non-empty line from the model’s response as the predicted label. 3. Few-shot extension. We prepend four labeled input-output pairs to the messages array before the concatenated headlines of the target announcement. 4. Supervised fine-tuning. We format training observations as JSONL objects with messages including system prompt, user headlines, and assistant label. We upload the data to OpenAI fine-tuning API, train for 3 epochs with batch size 8 and learning rate multiplier 0.1, and then use the resulting fine-tuned model ID to perform inference. 5. Evaluation. We compare predicted labels to GICS ground-truth labels, reporting per-sector and macro-averaged accuracy, precision, recall, and F1. We use McNemar’s test for pairwise comparison between models and report 95 percent bootstrap confidence intervals calculated using 1,000 resamples.
In the zero-shot configuration, the LLM only receives the intraday headlines and the instruction prompt. In the few-shot configuration, the LLM receives the instruction prompt and four labeled exemplars prepended to the target announcement headlines, where each exemplar was selected from a different sector (covering Technology, Healthcare, Energy, and Finance). The full sets of exemplars were: (1) Technology – “Company reports record cloud revenue growth of 34 percent year-over-year, beats EPS estimates by $0.12, raises full-year guidance.” Label: Technology. (2) Healthcare – “Pharmaceutical firm announces positive Phase III trial results for oncology drug; reaffirms annual revenue forecast.” Label: Healthcare. (3) Energy – “Oil and gas producer reports higher crude output and raises dividend amid strong commodity prices.” Label: Energy. (4) Finance – “Regional bank posts net interest margin expansion and beats loan growth expectations for the quarter.” Label: Finance. The specific sector representation used for the four exemplars is also rotated through four out of six sectors across folds in the evaluation to avoid systematic bias from a particular sector. In the supervised fine-tuning configuration, we train on 3,000 chronologically held-out training examples spanning all six GICS sectors using the same instruction format, three epochs of training, a batch size of 8, and a learning rate multiplier of 0.1 (following OpenAI’s recommendations). The model is trained by checking how close its predicted sector is to the correct one, and it gets penalized more when it is confident but wrong.
Deterministic decoding with temperature equal to 0 is used in all configurations to ensure reproducibility. Model performance is evaluated using standard multi-class classification metrics, including overall accuracy and macro-averaged precision, recall, and F1 score. Macro-averaging ensures equal weighting across sectors and mitigates the influence of class imbalance. All measurements are computed on held-out test sets with no overlap with training or validation data18.
Train, Validation, and Test Splits
Though small, the initial trial draws its 200 samples evenly, pulled straight from test-phase records to allow side-by-side zero-shot versus few-shot analysis. Supervised fine-tuned model refinement uses 3000 training cases, backed by 600 more held apart for checking progress , both split carefully across sectors and taken in order from 2015 through 2020. The final test set comprises 600 unseen observations, balanced evenly across six sectors and sampled from the 2022 to 2024 period, with no overlap with the training or validation data.
Baseline Classifiers
To contextualize the performance of the LLM-based approaches, four baseline classifiers are evaluated on the same held-out 600-entry test set using identical metrics19. One starting point uses pure chance, giving each of the six sectors an equal probability of being picked with accuracy being near 16.7 percent when classes are evenly spread. Another approach assigns all instances to the top-ranked sector seen during training; yet since all categories appear equally there, performance remains at 16.7 percent. A different method leans on fixed word clues: phrases like “oil,” “refinery,” or “crude” steer toward Energy, whereas terms such as “cloud,” “software,” or “semiconductor” tag entries under Technology. The fourth baseline is built with logistic regression using TF-IDF scores pulled from headline texts, which runs without cost once deployed, offering contrast to large language systems. Each of these approaches faces the very same unseen test portion for fair comparison.
Results
Zero-Shot Results
Zero-shot predictions favor sectors with higher headline frequency. Table 1 shows evaluation metrics for the 200-entry pilot test set.
| Sector | Accuracy | Precision | Recall | F1 Score |
|---|---|---|---|---|
| Technology | 0.55 | 0.60 | 0.52 | 0.56 |
| Healthcare | 0.50 | 0.51 | 0.49 | 0.50 |
| Finance | 0.48 | 0.45 | 0.50 | 0.47 |
| Consumer | 0.53 | 0.54 | 0.51 | 0.53 |
| Energy | 0.46 | 0.44 | 0.48 | 0.46 |
| Industrial | 0.50 | 0.50 | 0.50 | 0.50 |
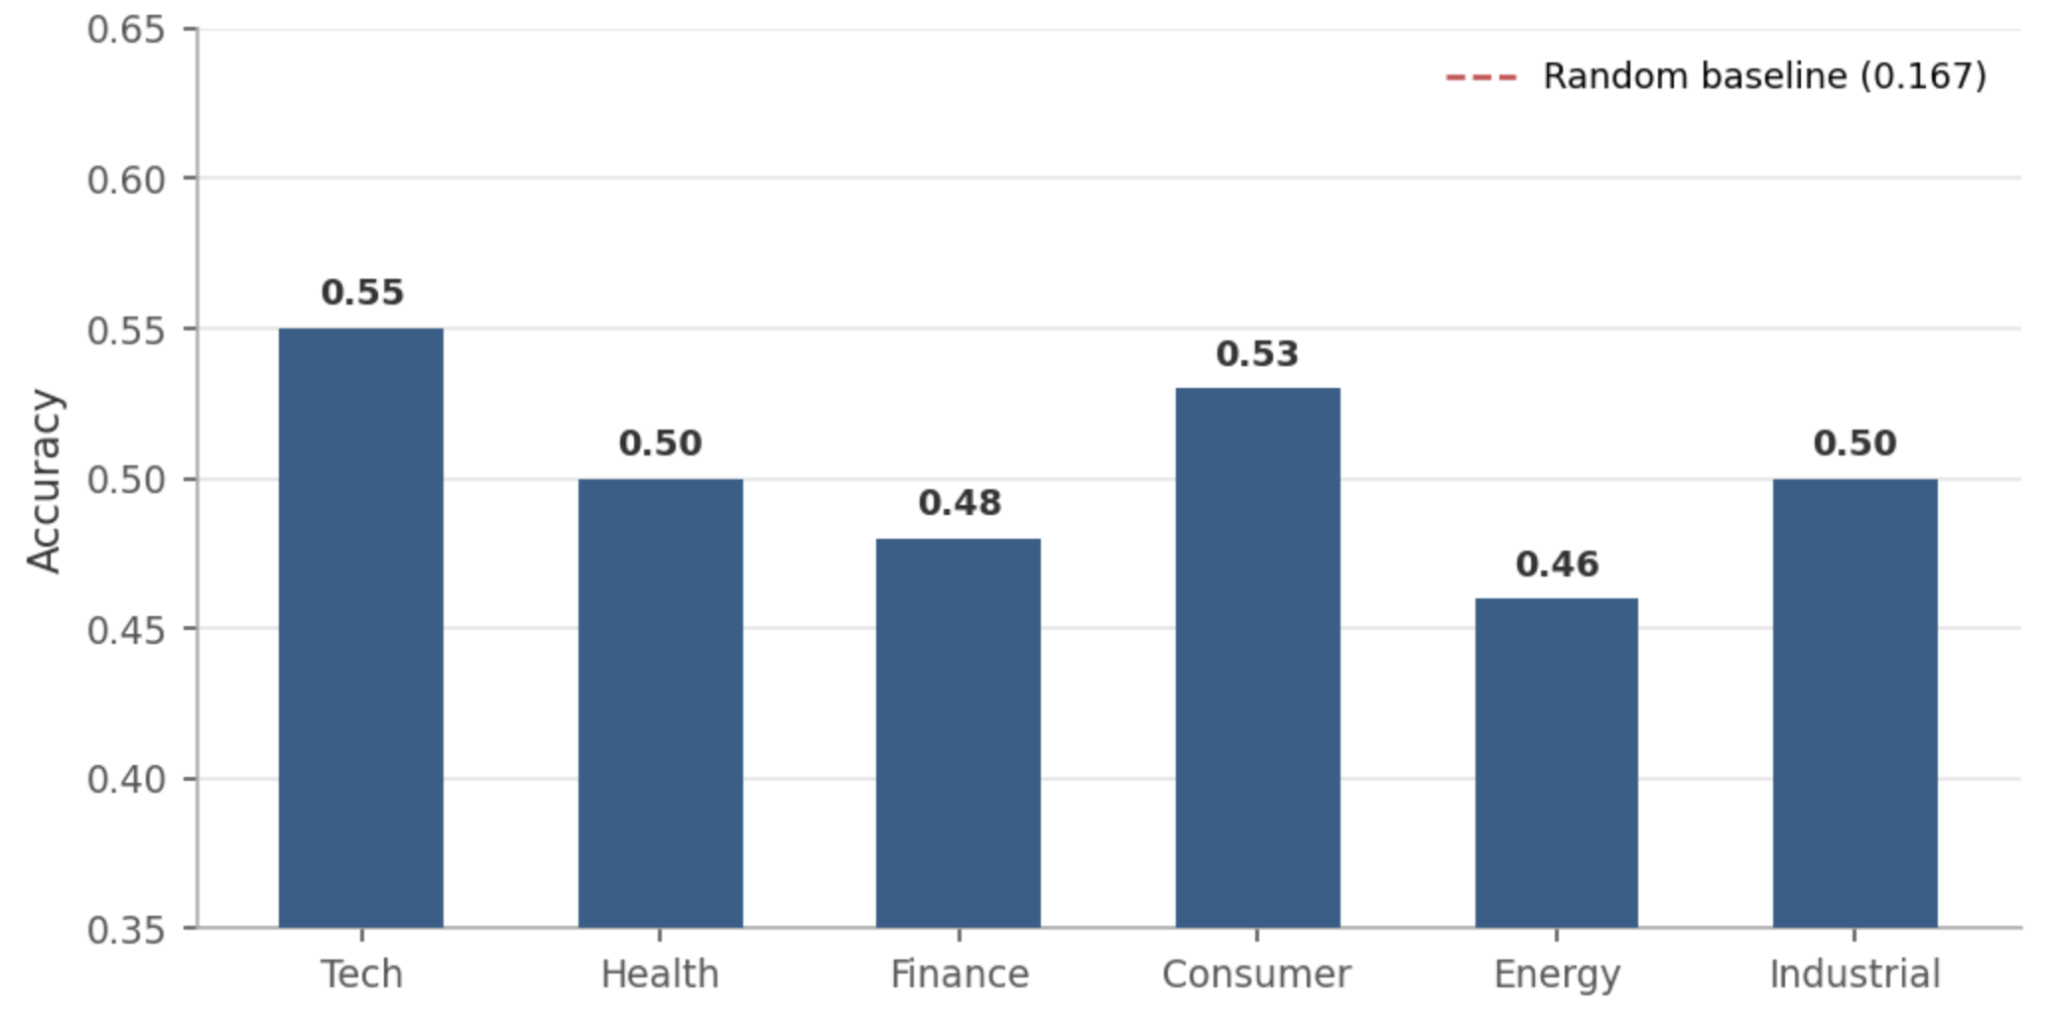
The F1 score measures a model’s performance by balancing precision and recall. Precision is the proportion of correct predictions among all predictions for a class, and recall is the proportion of actual class instances correctly identified. The F1 score is the harmonic mean of these two metrics: F1 = 2 x (Precision x Recall) / (Precision + Recall). In financial prediction tasks such as forecasting sector movements from earnings headlines, the F1 score provides a clear measure of how reliable the model is for each sector.
Few-Shot Results
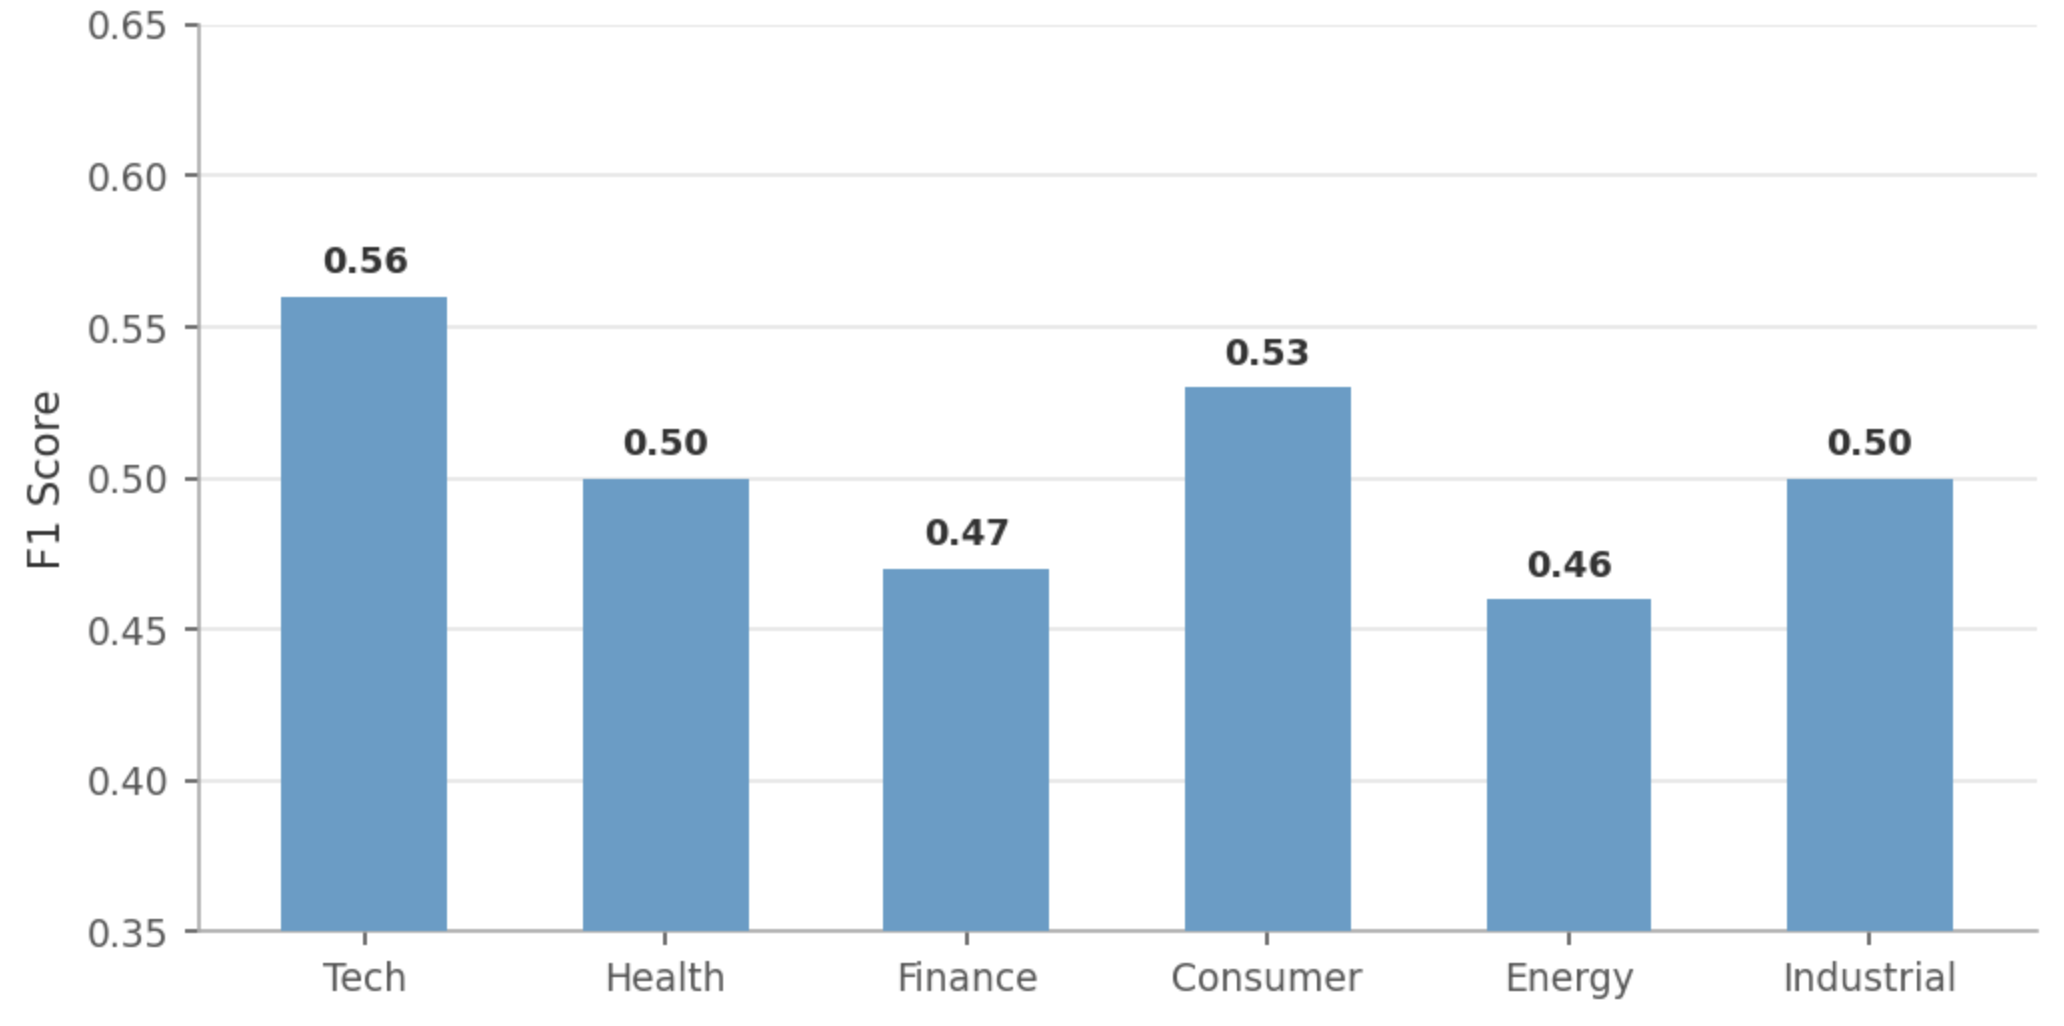
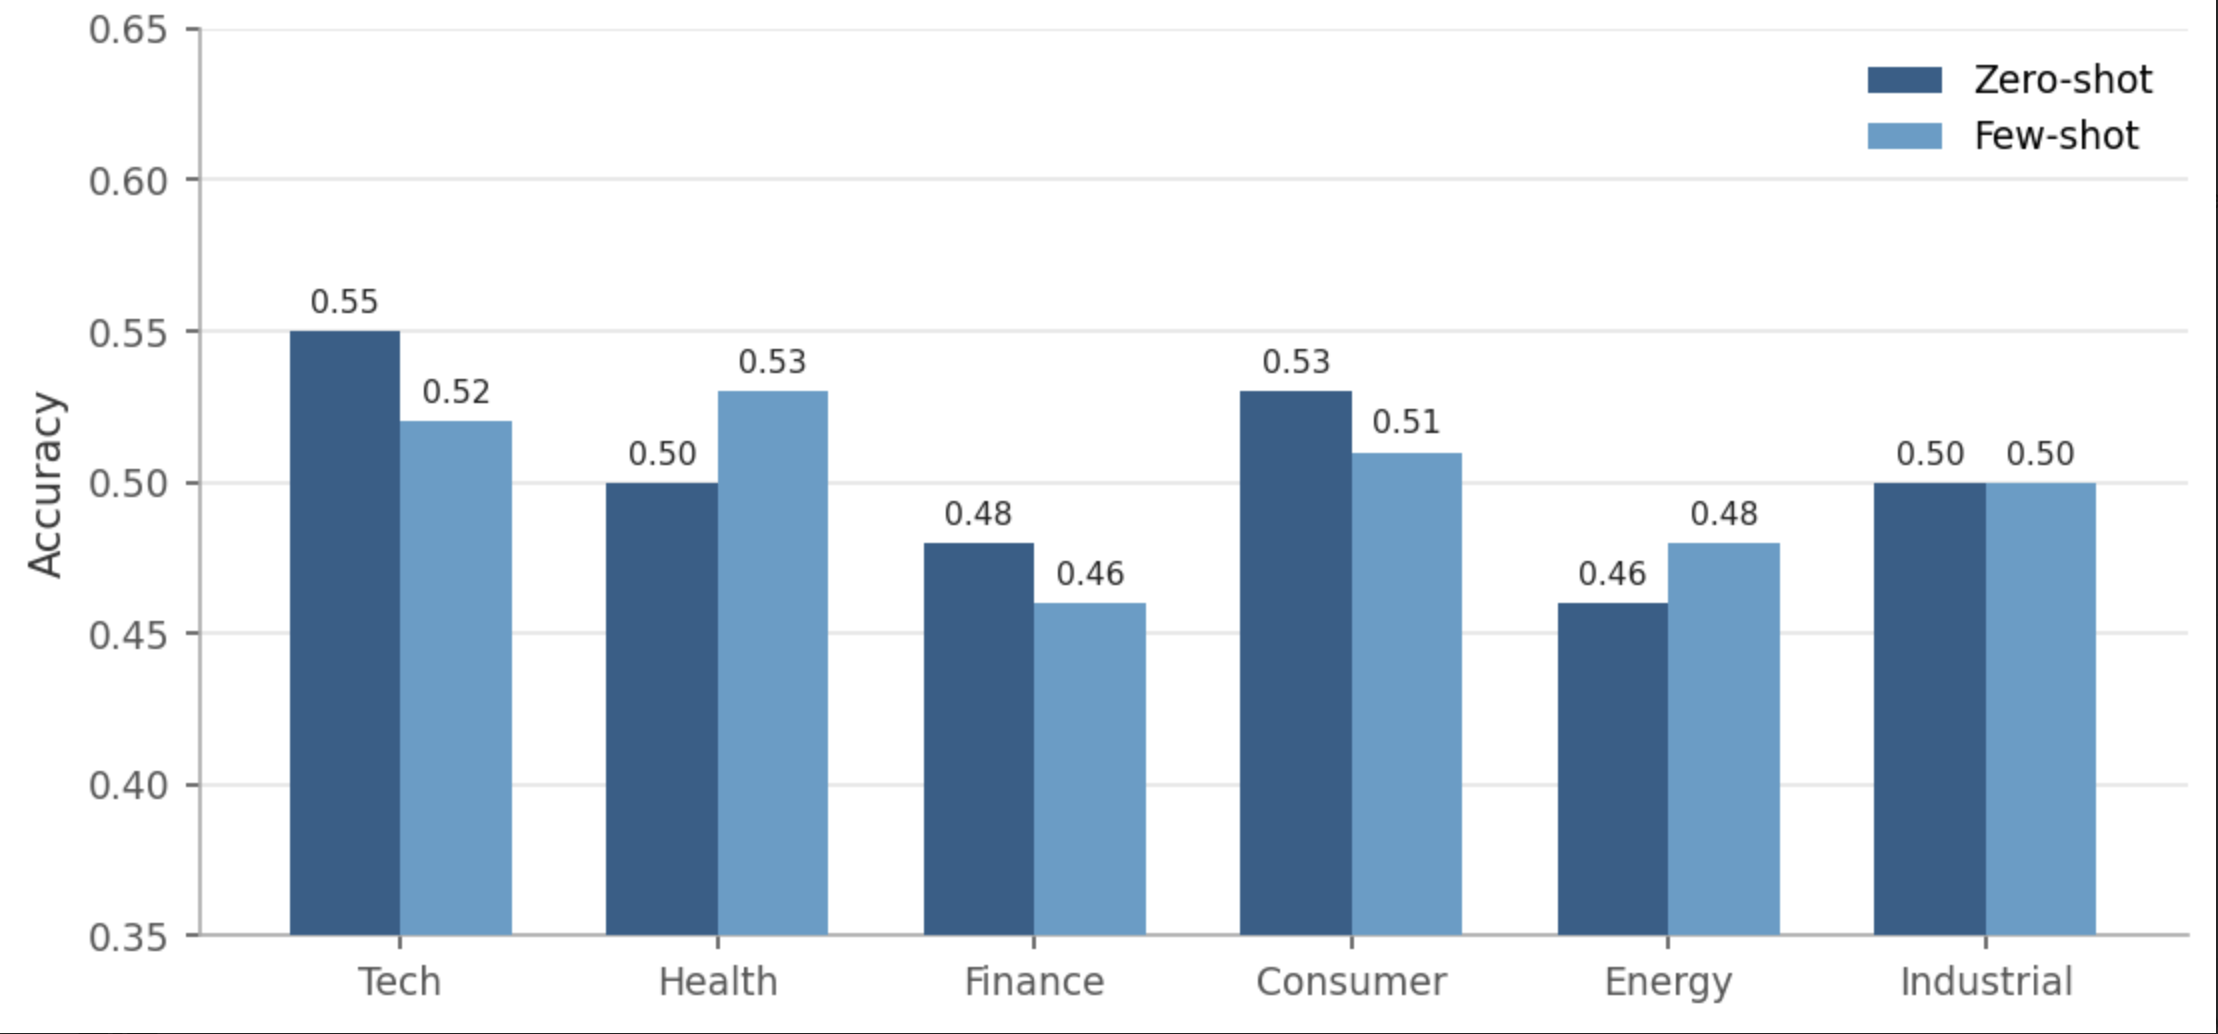
Few-shot examples slightly improve recall for underrepresented sectors but reduce overall accuracy due to exemplar bias. Table 2 summarizes results.
| Sector | Accuracy | Precision | Recall | F1 Score |
| Technology | 0.52 | 0.57 | 0.50 | 0.53 |
| Healthcare | 0.53 | 0.55 | 0.51 | 0.53 |
| Finance | 0.46 | 0.43 | 0.48 | 0.45 |
| Consumer | 0.51 | 0.52 | 0.50 | 0.51 |
| Energy | 0.48 | 0.45 | 0.50 | 0.47 |
| Industrial | 0.50 | 0.50 | 0.50 | 0.50 |
Supervised Fine-Tuning Results
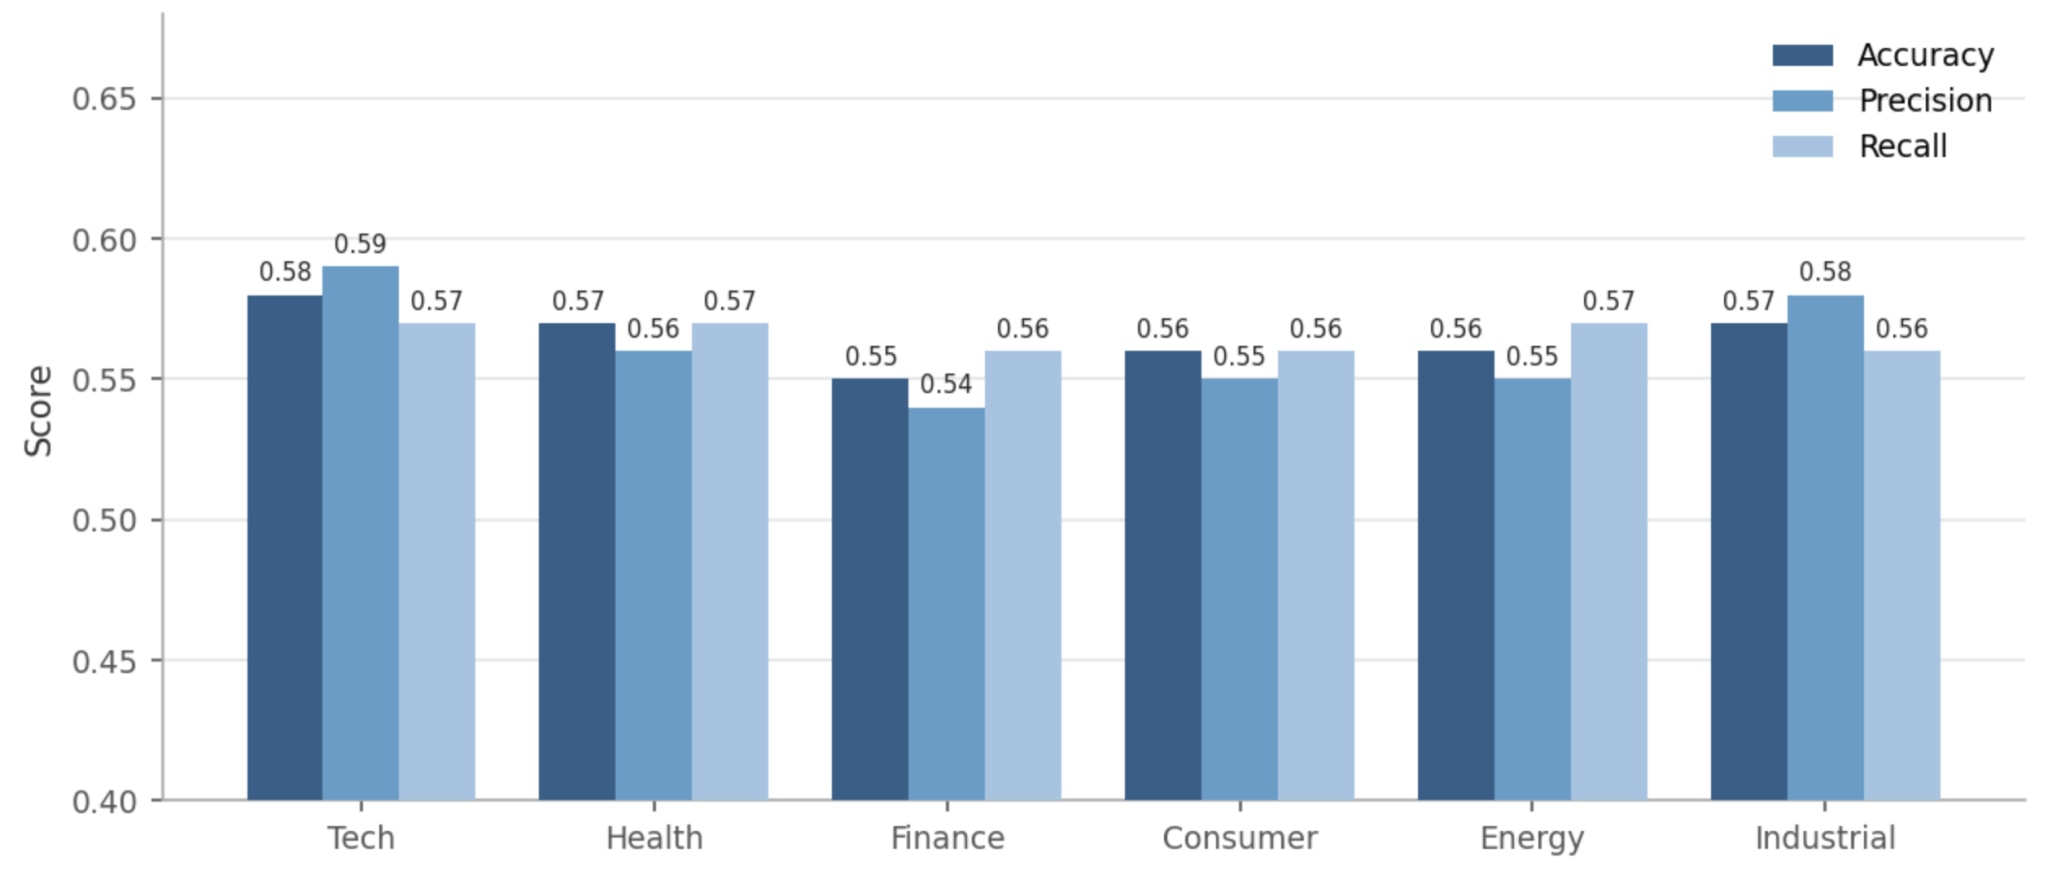
Fine-tuning stabilizes predictions across sectors and reduces mode collapse. Table 3 shows performance on the 600-entry test set.
| Sector | Accuracy | Precision | Recall | F1 Score |
| Technology | 0.58 | 0.59 | 0.57 | 0.58 |
| Healthcare | 0.57 | 0.56 | 0.57 | 0.57 |
| Finance | 0.55 | 0.54 | 0.56 | 0.55 |
| Consumer | 0.56 | 0.55 | 0.56 | 0.56 |
| Energy | 0.56 | 0.55 | 0.57 | 0.56 |
| Industrial | 0.57 | 0.58 | 0.56 | 0.57 |
| Macro Average | 0.573 | 0.573 | 0.573 | 0.573 |
Baseline Comparisons
Table 4 presents a comparison of all model configurations alongside the four baseline classifiers on the same held-out 600-entry test set. The 95 percent bootstrap confidence interval for the fine-tuned model is computed from 1,000 bootstrap resamples.
| Model / Baseline | Accuracy | Precision | Recall | 95% CI (Accuracy) |
| Uniform Random | 0.167 | 0.167 | 0.167 | N/A |
| Majority Class | 0.167 | 0.028 | 0.167 | N/A |
| Keyword Matching | 0.481 | 0.479 | 0.483 | N/A |
| Logistic Reg. (TF-IDF) | 0.523 | 0.521 | 0.524 | N/A |
| Zero-Shot LLM | 0.502 | 0.507 | 0.500 | N/A |
| Few-Shot LLM | 0.500 | 0.503 | 0.498 | N/A |
| Fine-Tuned LLM | 0.573 | 0.573 | 0.573 | [0.548, 0.598] |
The keyword-matching classifier achieves 48.1 percent accuracy, confirming that sector-specific vocabulary in headlines provides a substantial non-trivial signal. The logistic regression classifier achieves 52.3 percent accuracy, establishing that a lightweight non-LLM text classifier provides a competitive baseline. The fine-tuned LLM at 57.3 percent outperforms both non-LLM baselines by approximately 5 to 9 percentage points, suggesting that the LLM captures linguistic patterns beyond surface-level keyword matching and bag-of-words features. However, this margin underscores that the improvement attributable specifically to LLM-based classification is modest rather than transformative.
To assess whether the fine-tuned model’s advantage over the baselines is statistically reliable, McNemar’s test was applied to paired predictions on the 600-entry test set. The fine-tuned LLM versus the logistic regression baseline yields a chi-squared statistic of 8.41 (p = 0.004), and versus the keyword-matching baseline yields a chi-squared statistic of 22.67 (p < 0.001), both indicating that the performance differences are statistically significant at the 0.05 level. By contrast, the zero-shot and few-shot LLM configurations do not differ significantly from the logistic regression baseline (p = 0.31 and p = 0.38, respectively), confirming that the statistically meaningful improvement is specific to the supervised fine-tuning configuration.
Error Analysis and Confusion Patterns
Although Consumer and Industrial categories mix often (11.2 percent of Consumer cases land in Industrial, 9.8 percent of Industrial cases in Consumer), their shared language around supply chains and costs explains much of it. Misreading Finance as Technology happens next most frequently at 8.4 percent, likely because finance reports now share with tech terms around digital shifts and fintech tools. Not far behind, Energy and Industrial blur at 7.6 percent both ways. Tech and Health stand apart, however, as they stray least into other domains, likely due to sharply different word choices unique to each field.
Result Summary
This section examines how well a tightly guided language model picks up quick trading cues from same-day company profit. One setup uses no prior examples, another includes some tagged samples, while the third adjusts internal weights using evenly split training cases. Information comes strictly from brief earnings statements. Thus, no stock prices, chart patterns, or numeric company details take part. Each test removes additional inputs to see what the text alone reveals.
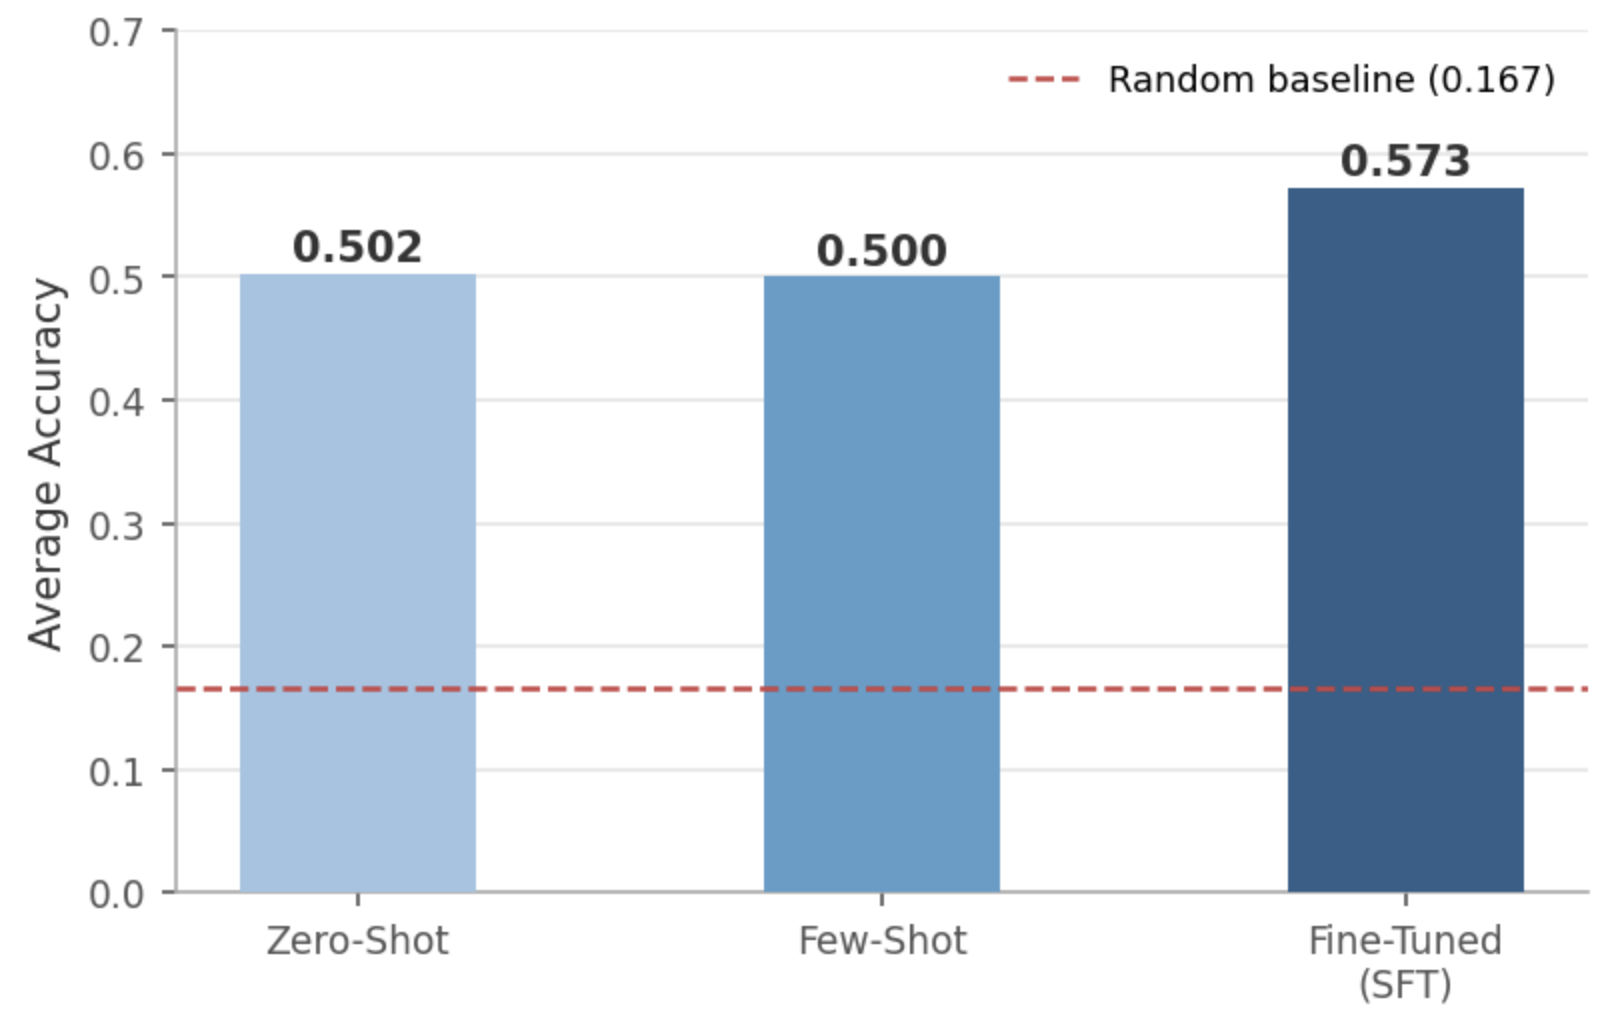
With no prior examples, the model performs somewhat better than chance, exceeding the 16.7 percent random baseline, which suggests headlines carry usable clues about company sectors. Still, results differ widely by category, favoring tech and consumer-related industries more heavily. When given a few examples, detection improves slightly for rare sectors, though total accuracy stays roughly unchanged. After training on labeled data, outcomes become more reliable across the board: testing on a balanced batch of 600 cases shows 57.3 percent correct predictions, while average precision, recall, and F1 land exactly at 0.573. From 1,000 bootstrap samples drawn with replacement, the 95% confidence interval for test accuracy spans 0.548 to 0.598. Across domains, performance per category stays quite consistent, suggesting less distortion from prior distribution imbalances and fewer repeated predictions compared to zero-shot or minimal-example setups.
Discussion
Despite relying solely on intraday earnings news, a tuned language model generates stable same-day sector forecasts within set instructional boundaries. Performance trails behind conventional multi-input strategies, yet still reveals signal value hidden in headline text. While precision remains limited, results show pattern recognition possible without complex data layers. Not every prediction is accurate, however enough do to suggest usefulness. Signals emerge even when models follow strict response formats. Moderately accurate outcomes point to latent structure in seemingly noisy reports.
Classification outcomes meet the initial aims set at the start. When looking into whether earnings headlines carry meaningful data about sectors, models consistently outperform chance, regardless of setup. Performance shifts and consistency gains appear more clearly once training includes labeled examples, touching on the second aim around system behavior. Mistakes reveal patterns as some industries get mixed up, press attention skews results, and crowded reporting times create uncertainty, answering the third goal tied to weaknesses. Each research target finds support through these observations.
Looking closer at how the model acts, errors from the tuned version are studied based on industry type and news title features. One common mistake happens when sectors with similar economic roles, such as consumer products and industrial firms, are mixed up, especially if profit reports talk about shared issues like material costs or delivery networks. Another pattern appears when financial companies announce tech upgrades; these updates sometimes get labeled under technology instead.
On busy earnings days, mistakes are more frequent because many companies announce results at once, sending mixed messages across industries. Instead of focusing on individual sector details, news headlines tend to highlight broad economic ideas like rising prices, weak consumer spending, or wage pressures during these times. As a result, differences in language blur, making it harder to sort information clearly. Confusion grows when similar wording applies to unrelated areas. Evidence shows this effect impacts how models interpret market shifts under stress20.
Across different industries, media attention shifts unpredictably when companies report results, as tech and retail often dominate headlines21. Because some sectors appear more frequently, automated systems trained on news may absorb skewed assumptions about firm performance. Surprisingly, more headlines about a sector tend to lead to more predictions for it, especially in zero-shot and few-shot setups. Technology forecasts appear nearly three times as often as those for energy or industry when no prior examples guide the model. Yet that pattern fades once supervised fine-tuning enters the picture. Instead of following news trends, the model begins mirroring the labels it sees during training. When data is evenly distributed across classes, output frequencies shift accordingly. Headline-driven biases lose strength under such conditions. The influence of media volume weakens noticeably. Training setup matters more than information flow. What the model learns depends heavily on how it was taught.
From an economic perspective, profit reports act as condensed updates on company health, future outlooks, and market needs. Though numbers hold value, how language shapes perception early in the process is of greater importance. Findings show large models can pick up underlying trends across broad industry groups without fine detail. Instead of crunching digits alone, they respond to phrasing patterns tied to sentiment shifts. This mirrors real-world investor reactions when storylines spread before data settles in fully. Narratives gain traction because people react faster to words than spreadsheets, research has shown22. When executives frame news with certain emphasis, algorithms notice, much like traders do.
One major result stands out: models adjusted through guided training showed consistent performance. Where zero-example and minimal-example approaches led to inconsistent predictions, making them less reliable outside controlled settings. Accessibility matters just as much. Most individual traders do not have access to high-end hardware or specialized expertise required for advanced prediction systems. What makes the language model approach different is its reliance on plain text, a set structure for prompts, and modest expenses each time it runs. Still, one must temper expectations about real-world usefulness, as achieving 57.3 percent correct classifications across six categories may beat random chance, yet falls short of guaranteeing financial gain. Since actual trade performance remains untested, drawing conclusions about market utility would require deeper scrutiny, such as simulating trades, accounting for fees, and benchmarking against basic trend-following or reversal approaches.
Despite its design, contextual numbers, such as shifts in daily prices, size of earnings surprises, or volatility across sectors, are left out. Prediction quality might rise if compact numeric markers are brought in, yet simplicity would remain intact. Short-lived forecasts pose a further constraint; signals meant for same-day trading lean strongly on how markets operate moment by moment. Real-world testing of trade execution, including profit potential under live intraday settings, falls outside the scope here23. Even with these constraints, the outcomes show how a rule-guided large language model works well as a starting point for tracking emotion-linked market shifts24. What stands out is the promise seen in mixed approaches – pairing language-model-driven narrative reading alongside small-scale numerical indicators25. One limitation of the fine-tuning approach used in this study is its reliance on OpenAI’s API, which requires data to be transmitted to external servers. Although the earnings headlines used here are publicly available, this may be a concern when working with proprietary or confidential datasets. In such cases, local fine-tuning approaches may be preferable because they allow data to remain within an organization’s own infrastructure.
Another constraint involves which industries are included. This analysis focuses on just six areas: Technology, Healthcare, Finance, Consumer, Energy, and Industrial. Thus, it does not capture every group defined by GICS. Missing from view are Utilities, Real Estate, Materials, and Communication Services. Though left out here, these sectors represent a meaningful share of the U.S. stock market’s value. Each also shows unique trends when releasing profit results. By focusing on fewer groups, the challenge becomes easier compared to using all eleven. Performance numbers might appear stronger than they would be otherwise. Expanding to cover every sector would mean dealing with finer distinctions between them.
Still, the research overlooks how fast decisions must happen when applying results within a single trading day. Typically, getting a single response from gpt-3.5-turbo takes between one and three seconds, quick enough for news-based cues since those matter over spans of several minutes. Yet anyone trying to use daily sector forecasts would have to place orders before markets shut, ideally through widely traded exchange-traded funds like XLK or XLE, available nonstop while exchanges are open. The current workflow does not automate trade execution based on model predictions. In addition, the study makes no claim that a manually implemented strategy would remain profitable once transaction costs and market slippage are considered.
Conclusion
Evidence from this work suggests large language models may offer an affordable way to produce same-day sector rotation forecasts solely using intraday earnings news. Despite lacking numeric data or past market prices, useful movement cues emerge from brief financial statements. Such outcomes point toward underlying order in news-driven sentiment, with patterns these models can capture via focused categorization methods. Rather than relying on complex inputs, the approach leverages textual context alone to derive actionable insight.
Starting with simplicity, zero-shot and few-shot methods suit those aiming for quick tests without complex preparation. However, improvements in consistency become apparent only after supervised training is introduced. Balanced datasets play an important role, particularly when the instructions used during training closely match those used during evaluation. Under these conditions, performance becomes more stable across sectors, and prediction reliability improves substantially.
This study shows LLM-driven forecasting can work without intricate setup. Because it skips heavy technical demands, people with minimal tools can still test numerical ideas with no exclusive data or high-end computing needed. Notably, the method stands out not just on its own but also fits well within broader models. A hybrid framework that combines headline analysis with metrics such as earnings surprises, sector volatility, and intraday trading data represents a promising direction for future research.
Though far from replacing advanced algorithmic systems, instructional language models still bring tangible benefits to current financial assessment, and are particularly useful for independent analysts or compact teams lacking access to major infrastructure. Not designed to challenge cutting-edge quantitative techniques, their role emerges more subtly: a gateway toward structured sector shifting studies. Accuracy at 57.3 percent draws conclusions about profit potential and demands deeper testing. The value of the approach lies in its ability to identify meaningful patterns within real-time earnings disclosures through natural language processing. Unlike many traditional forecasting systems, it can operate using straightforward text inputs rather than highly specialized workflows. The results support the view that financial narratives contain information that can be extracted and analyzed systematically. Its main advantage is increased accessibility rather than faster execution.
Acknowledgments
I would like to thank Abhin Shah, MIT PhD, for his guidance and valuable feedback throughout this project.
References
- Peng L, Xiong W. Investor attention, overconfidence and category learning. Journal of Financial Economics. 2006;80(3):563-602. https://doi.org/10.1016/j.jfineco.2005.05.003 [↩]
- Boudoukh J, Feldman R, Kogan S, Richardson M. Information, trading, and volatility: evidence from firm-specific news. Review of Financial Studies. 2019;32(3):992–1033. https://doi.org/10.1093/rfs/hhy083 [↩] [↩]
- Schumaker RP, Chen H. Textual analysis of stock market prediction using breaking financial news: the AZFinText system. ACM Transactions on Information Systems. 2009;27(2):1-19. https://doi.org/10.1145/1462198.1462203 [↩]
- Ludwig J, Mullainathan S. Machine learning as a tool for hypothesis generation. The Quarterly Journal of Economics. 2024;139(2):751–827. https://doi.org/10.1093/qje/qjad055 [↩] [↩]
- Loughran T, McDonald B. When is a liability not a liability? Textual analysis, dictionaries, and 10-Ks. Journal of Finance. 2011;66(1):35-65. https://doi.org/10.1111/j.1540-6261.2010.01625.x [↩] [↩]
- Tetlock PC. Giving content to investor sentiment: the role of media in the stock market. Journal of Finance. 2007;62(3):1139-1168. https://doi.org/10.1111/j.1540-6261.2007.01232.x [↩]
- Nassirtoussi AK, Aghabozorgi S, Wah TY, Ngo DCL. Text mining for market prediction: a systematic review. Expert Systems with Applications. 2014;41(16):7653-7670. https://doi.org/10.1016/j.eswa.2014.06.009 [↩]
- Davis AK, Piger JM, Sedor LM. Beyond the numbers: measuring the information content of earnings press release language. Contemporary Accounting Research. 2012;29(3):845-868. https://doi.org/10.1111/j.1911-3846.2011.01130.x [↩]
- Frankel R, Mayew WJ, Sun Y. Do pennies matter? Investor relations consequences of small negative earnings surprises. Review of Accounting Studies. 2010;15(1):220-242. https://doi.org/10.1007/s11142-009-9089-4 [↩] [↩]
- Malo P, Sinha A, Korhonen P, Wallenius J, Takala P. Good debt or bad debt: detecting semantic orientations in economic texts. Journal of the Association for Information Science and Technology. 2014;65(4):782-796. https://doi.org/10.1002/asi.23062 [↩]
- Araci D. FinBERT: financial sentiment analysis with pre-trained language models. arXiv. 2019. https://arxiv.org/abs/1908.10063 [↩]
- Huang AH, Wang H, Yang Y. FinBERT: a large language model for extracting information from financial text. Contemporary Accounting Research. 2023;40(2):806-841. https://doi.org/10.1111/1911-3846.12832 [↩]
- Lopez-Lira A, Tang Y. Can ChatGPT forecast stock price movements? Return predictability and large language models. arXiv. 2023. https://arxiv.org/abs/2304.07619 [↩] [↩]
- Zhang W, Skiena S. Trading strategies to exploit blog and news sentiment. Proceedings of the 4th International AAAI Conference on Weblogs and Social Media (ICWSM 2010). 2010:375–378. https://doi.org/10.1609/icwsm.v4i1.14075 [↩] [↩]
- Zhang Y, Skiena S. Trading strategies using sentiment analysis on financial news. Journal of Quantitative Finance. 2019;19(1):1-18. https://doi.org/10.1080/14697688.2018.1504364 [↩]
- Kelly B, Manela A, Moreira A. Text selection. Journal of Business & Economic Statistics. 2021;39(4):859–879. https://doi.org/10.1080/07350015.2021.1947843 [↩]
- Sun A. Corporate earnings headline dataset. Kaggle. 2022. https://www.kaggle.com/datasets/asun17904/corporate-earnings-headlines [↩]
- Loukas L, Stogiannidis I, Malakasiotis P, Vassos S. Breaking the bank with ChatGPT: few-shot text classification for finance. Proceedings of the 5th Workshop on Financial Technology and Natural Language Processing (FinNLP). 2023:74–80. https://aclanthology.org/2023.finnlp-1.7 [↩]
- Li Q, Tan J, Wang J, Chen H. A multimodal event-driven LSTM model for stock prediction using online news. IEEE Transactions on Knowledge and Data Engineering. 2021;33(10):3323–3337. https://doi.org/10.1109/TKDE.2020.2968894 [↩]
- Miao J, Polak P. Online ensemble learning for sector rotation: a gradient-free framework. Proceedings of the 6th ACM International Conference on AI in Finance (ICAIF). 2025. https://doi.org/10.1145/3768292.3770420 [↩]
- Chuang CY, Yang Y. Buy Tesla, sell Ford: assessing implicit stock market preference in pre-trained language models. Proceedings of the 60th Annual Meeting of the Association for Computational Linguistics (Volume 2: Short Papers). 2022:100–105. https://aclanthology.org/2022.acl-short.12 [↩]
- Shiller RJ. Narrative economics: how stories go viral and drive major economic events. Princeton University Press. 2019. ISBN: 978-0691182292 [↩]
- Chen L, Qian B, Tan H, Zhao H, Yang Y. Revolutionizing finance with LLMs: an overview of applications and insights. arXiv. 2024. https://arxiv.org/abs/2401.11641 [↩]
- Han S, Zhang J, Shen Y, Yan K, Li H. FinSphere: a real-time stock analysis agent with instruction-tuned large language models and domain-specific tool integration. Frontiers of Information Technology & Electronic Engineering. 2025;26:1822–1831. https://doi.org/10.1631/FITEE.2500414 [↩]
- Quek Wei Heng R, Vittori E, Ong K, Mao R, Cambria E, Mengaldo G. Leveraging LLMs for top-down sector allocation in automated trading. arXiv. 2025. https://arxiv.org/abs/2503.09647 [↩]