Abstract
Background and Objective: As artificial intelligence (AI) develops, data centers need more electricity and water. This review evaluated how data centers could reduce these demands by considering computing operations per unit of energy rather than peak theoretical performance.
Methods: I identified reports from peer-reviewed journals, public and standards bodies, and other sources, and excluded studies with unsubstantiated manufacturer’s claims, and evaluated conclusions in the context of the reports’ findings.
Results: The most significant processor-level improvements were achieved with specialized chips, including 30 to 80 times higher performance per watt than CPUs or GPUs in a peer-reviewed comparison of Google’s Tensor Processing Unit. Across broader categories of specialized chips, performance improvements of 100 to 1000 times were seen, while software could reduce the amount of computation the models required. Pruning reduced the number of parameters in some models by 90%, with minimal loss in accuracy, while quantization reduced the numerical precision used to represent weights and activations and knowledge distillation trained smaller models to replicate larger ones. Such methods could reduce computational work by orders of magnitude, though power consumption may not fall linearly with reductions in computation. Direct-to-chip and immersion cooling achieved power usage effectiveness of ~1.02 to 1.04, with savings of ~10 to 50% in overall energy use compared to air-cooled systems.
Conclusions: The combination of approaches, including specialized chips, optimized models, and alternative cooling, should be selected on a case-by-case basis according to the mix of workloads, climate, energy, water, and manufacturing emissions, and the risks of reduced costs accelerating overall consumption.
Keywords: Artificial Intelligence, Data Centers, Sustainable Computing, Green AI, Performance per Watt.
Introduction
Training and running large artificial intelligence (AI) models require tremendous amounts of computing power. As these models grow in size and complexity, their electricity needs skyrocket. The cost to train the most demanding AI models using the largest datasets has been rising at a 2.4x annualized rate since 20161. While investment and scale choices in upcoming years may slow this trend, public reports of large-scale model training jobs suggest that a single run at the top end of the market could exceed $1B in training costs by 20271.
The electricity usage for these activities mainly comes from data centers, which saw consumption rise to 415 TWh in 2024, accounting for 1.5% of total electricity production2. Electricity use by data centers jumped 17% in 2025, with the International Energy Agency (IEA) predicting that data centers would be responsible for half of the U.S.’s electricity demand growth through 20303. The IEA’s Base Case analysis forecasts worldwide data center electricity use at approximately 945 TWh by 20302. In the United States, data centers already account for over 4% of electricity consumption, and 56% of the electricity they used between September 2023 and August 2024 was produced by burning fossil fuels. Furthermore, between September 2023 and August 2024, the carbon intensity of electricity used in data centers was 48% higher than that of the electric grid as a whole, and total greenhouse gas (GHG) emissions from data centers exceeded 105 million tonnes4.
Electricity use is only one component of data-center resource use; water consumption is another major challenge. In 2018, the operational water footprint of data centers in the U.S. was 5×10⁸ m³, with almost 75% of that being indirect water use associated with electricity production5. This places strain on freshwater resources, with 4 billion people already experiencing severe water scarcity for at least 1 month each year6. Water, electricity, and emissions are only part of the impact of data centers, as the production and disposal of servers and accelerators, which make up data-center infrastructure, also have environmental consequences. Mining and fabrication of semiconductors used in accelerators and central processing units (CPUs) are extremely energy-intensive processes7, and end-of-life processing of discarded servers and accelerators comprises a major component of the world’s electronic waste stream, with 62 million tonnes of e-waste generated worldwide in 2022 and forecasts of 82 million tonnes by 20308.
The topics discussed illustrate three areas in which energy use, and by extension, costs, can be reduced: hardware, software, and cooling. Servers account for 60% of a data center’s electricity bill; thus, improvements in processor and memory efficiency have a major impact on electricity use2. Software and model architecture improvements dictate how much work is sent to these processors, while the cooling needed to manage their waste heat accounts for 10-30% of a data center’s electricity bill in modern facilities2. While the distribution of these components can vary significantly from facility to facility, the three areas have been shown to have major impacts on overall electricity use.
This paper will examine advancements in the aforementioned areas by reviewing improvements in computing hardware, software, and cooling, before analyzing the impact of these reductions on rebound demand9, manufacturing emissions7, and accessibility to efficient data-center computing. While improvements in all three areas reduce the amount of electricity consumed per unit of computation, these reductions can have complex downstream effects on overall electricity use.
Methods
I focused my attention primarily on peer-reviewed conference proceedings and journal articles; whenever such resources were lacking, I turned to agency reports and standardization body reports, including the IEA, ITU/UNITAR, ISO, The Green Grid, and others. Additionally, for my research, I employed non-commercial preprints, clearly distinguishing them from the peer-reviewed literature, while avoiding any commercial performance claims made by equipment vendors. For the few peer-reviewed hardware studies published by employees of the firm that manufactured the hardware, I noted their employment in the publication. I used news and popular press articles to identify primary sources, double-checking the figures in Table 1 against the claims in these sources.
| Quantity | Value used | Source | Evidence class |
| Global DC electricity, 2024 | 415 TWh (~1.5%) | 2 | Official |
| DC electricity growth, 2025 | ~+17% year-on-year | 3 | Official |
| DC electricity, 2030 (Base Case) | ~945 TWh | 2 | Official |
| US DC share / carbon intensity | >4%, +48% | 4 | Preprint |
| Training-cost growth | 2.4×/yr since 2016 | 1 | Preprint |
| TPU performance/watt | 30 to 80× (inference) | 10 | Peer-reviewed |
| ASIC energy efficiency | 100 to 1000× vs CPU | 11 | Peer-reviewed |
| Pruning model-size cut | up to ~90% (AlexNet) | 12 | Peer-reviewed |
| Quantization energy (8b vs 32b multiply) | 0.2 vs 3.7 pJ | 13 | Peer-reviewed |
| Immersion cooling PUE | ~1.02 to 1.04 | 14 | Peer-reviewed |
| E-waste, 2022 | 62 Mt, rising to 82 Mt by 2030 | 8 | Official |
To allow a fair comparison between the different approaches, I clustered the results by the source of improvement: hardware alterations affect the energy per operation, software ones affect the number of operations, and cooling-related approaches affect the energy required for cooling.
To quantify the time advantage of a performance upgrade on a given accelerator, I balanced the emissions saved by lower energy consumption against the emissions from manufacturing a better accelerator. The initial accelerator was assumed to consume 0.3 kW in continuous operation at 100% utilization. At the same time, the improved one had 1.5 times better performance per watt, thereby reducing energy consumption by one-third. The grid carbon intensity was used to calculate the emissions averted due to lower energy consumption, and these were compared to 100 to 300 kg CO2e of emissions from producing a new accelerator, which would be related to the utilization level of the new accelerator, with lower utilization rates having a longer break-even period15,16.
Results
Environmental Impacts of Data Centers
Due to the extensive nature of a data center’s impact, its environmental effects may vary drastically depending on the scale, design, location, and operating conditions. Though larger facilities such as hyperscale data centers typically report higher efficiency than enterprise-level and edge installations2, the variability in land use, water consumption, and local air quality impacts makes it challenging to identify a universal set of indicators and performance assessment standards.
Land & Water Use
Some of the most apparent local impacts stem from land appropriation and the withdrawal of water from natural ecosystems. Both factors can be severe for large-scale facilities, as their infrastructure often occupies hundreds of acres, with additional areas dedicated to road construction and other needs. At the same time, power transmission corridors may disrupt local ecology, with the overall impact varying widely depending on the project and the environment in which it is built.
Meanwhile, water use is an even more significant concern, as consumption varies widely across facilities, climate zones, cooling systems, and infrastructure technologies, ranging from approximately 1.8 to 106 m3 per MWh of electricity5. For reference, the Houston Advanced Research Center and the University of Houston have estimated that 25 billion gallons of water in Texas will be used for data centers in 2025, with an expected consumption between 29 and 161 billion gallons in 2030, depending on the adoption of new facilities and their cooling systems17,18. Overall, the nationwide average is approximately 7 m3 of water per MWh of electricity, or 7 liters of water per kWh5, though there is considerable variance across data centers.
Carbon Emissions & Local Air Quality
According to the International Energy Agency, electricity use by data centers results in approximately 180 million tonnes of carbon emissions per year, with this figure projected to reach 300 million tonnes by 2035 under the Base Case scenario. However, this estimate only includes emissions from data center operations and does not account for the effects of facility construction or IT infrastructure manufacturing, which can be substantial2. For instance, when examining corporate sustainability reports, one researcher found that “capital- and supply-chain-related emissions were on average 23 times higher than operational emissions, with manufacturing-related emissions representing 74 to 86% of total lifecycle emissions for individual product categories”7. As a result, in addition to global warming, data centers affect the local air quality of the surrounding area, as many facilities use diesel-fueled generators to provide auxiliary power. Such installations can emit considerable amounts of particulate matter and nitrogen oxides during testing or unscheduled downtime2 and continue to contribute to the local smog levels even when the facility uses cleaner electricity.
Power Usage Effectiveness (PUE)
Power Usage Effectiveness is a metric used to assess the efficiency of a data center and its infrastructure by comparing the electricity consumed to the electricity delivered to the facility’s IT equipment. A PUE of 1 indicates that the center’s overhead, including cooling, power supply operations, lighting, and other expenditures, amounts to zero. The Green Grid introduced the metric, which was later standardized as ISO/IEC 30134-2:201619. The metric is useful but only considers electricity used at the center and does not account for its source, local water stress, or manufacturing emissions. Other metrics, such as Water Usage Effectiveness (WUE)20 and Carbon Usage Effectiveness (CUE)21, can provide additional context. At the same time, the energy intensity of a building’s construction and the emissions produced by IT equipment manufacturing remain separate areas of research7,15.
| Measure | What it measures | Preferred direction | What it leaves out |
|---|---|---|---|
| PUE19 | Total facility energy ÷ IT energy | 1.0 | Ignores energy source, water, climate |
| WUE20 | Annual water use ÷ IT energy (L/kWh) | 0.0 | Site vs source water differ |
| CUE21 | Total CO₂ ÷ IT energy (kgCO₂e/kWh) | 0.0 | Operational only, excludes embodied |
| Lifecycle carbon7,15 | Embodied + operational CO₂e | lower | Data-scarce and needs die-area/LCA models |
Efficiency Opportunities Across the Stack
Table 3 below organizes the results by modality, comparing energy or performance per operation/inference for hardware studies; changes in model size or energy consumption for software studies; and energy consumption outside the computing core for cooling studies, thereby isolating these from changes in computational efficiency.
| Part of the system | Measured result | Source | Evidence class |
| Hardware | TPU 30 to 80× perf/watt and ASIC 100 to 1000× | 10,11 | Peer-reviewed |
| Software | Compressed inference ~3,400×/24,000× greater energy efficiency vs GPU/CPU and EfficientNet 8.4× smaller | 22,23 | Peer-reviewed |
| Cooling | PUE ~1.02 to 1.04 and ~10 to 50% total energy vs air | 14 | Peer-reviewed |
The same workload can be executed on a general-purpose processor (GPP) or a specialized processor, and software optimizations can reduce the computational cost by several orders of magnitude. In contrast, improved cooling can reduce the PUE of an existing facility by a factor of 2, bringing it to 1.05. Because the approaches target different aspects of energy consumption, their benefits can only be compounded when the same workload can take advantage of all of them. In such a scenario, the combination can reduce energy consumption by 100 to 1000 times compared to GPP-based data centers.
Specialized Hardware
A central processing unit (CPU) is a general-purpose processor that handles a broad range of tasks. In contrast, deep learning workloads are dominated by matrix operations that can benefit greatly from parallelization. Graphics processing units (GPUs) provide this degree of parallelism and have become the industry standard, but even more specialized hardware can offer additional benefits at the cost of flexibility. For instance, Google’s Tensor Processing Unit (TPU) was reported to provide “30 to 80x better performance per watt than the CPUs and GPUs it was benchmarked against on real-world models”10 and an independent analysis of application-specific integrated circuits (ASICs) found “efficiencies from 100 to 1,000 times better than a general-purpose processor”11. Part of the TPU’s advantage comes from reducing data movement through its 256×256 systolic array, which contains 65,536 8-bit multiply-accumulate units, along with large on-chip buffers.10. Specialized hardware can provide substantial benefits for steady, predictable workloads by focusing on a specific set of operations.
Memory, Interconnects, and Power Delivery
High Bandwidth Memory (HBM), which is placed on the same package as the processor to reduce energy consumption for data movement, significantly reduces the energy required to access memory. Specifically, the energy consumption of HBM2 was found to be 3.9 pJ/bit in a published study, whereas moving the same amount of data from an off-package GDDR5 took 14 pJ/bit and therefore used about 3.5 times as much energy24.
While distributed training benefits immensely from accelerators, the processors need to communicate to exchange weights and data. NVLink, InfiniBand, or other high-bandwidth interconnects can reduce time spent waiting for data, thereby enabling higher processor utilization than traditional Ethernet. The studies below, however, do not provide a consistent benchmark for the amount of energy saved across different scenarios. Another aspect of power delivery infrastructure is the voltage delivered to servers: at the rack level, increasing the voltage from 12 V to 48 V will decrease the required current by a factor of 4, thus reducing the power loss due to resistive heating of cables by 16 times, but the overall benefit depends on the topology and power conversion circuitry of a given infrastructure.
Reducing Computation in Software
Some NLP models evaluated in 2019 required several hundred kWh for training25. In contrast, the 176-billion-parameter BLOOM model used about 433 MWh and emitted about 24.7 tonnes of CO₂e from dynamic electricity use, or 50.5 tonnes when equipment manufacturing and other operational processes were included26. Due to differences in workload, the two workloads cannot be compared directly. However, the difference in their energy consumption reflects the increased training costs imposed by modern large language models. The difference shows growth in demand without establishing a single rate of change.
Compression Methods
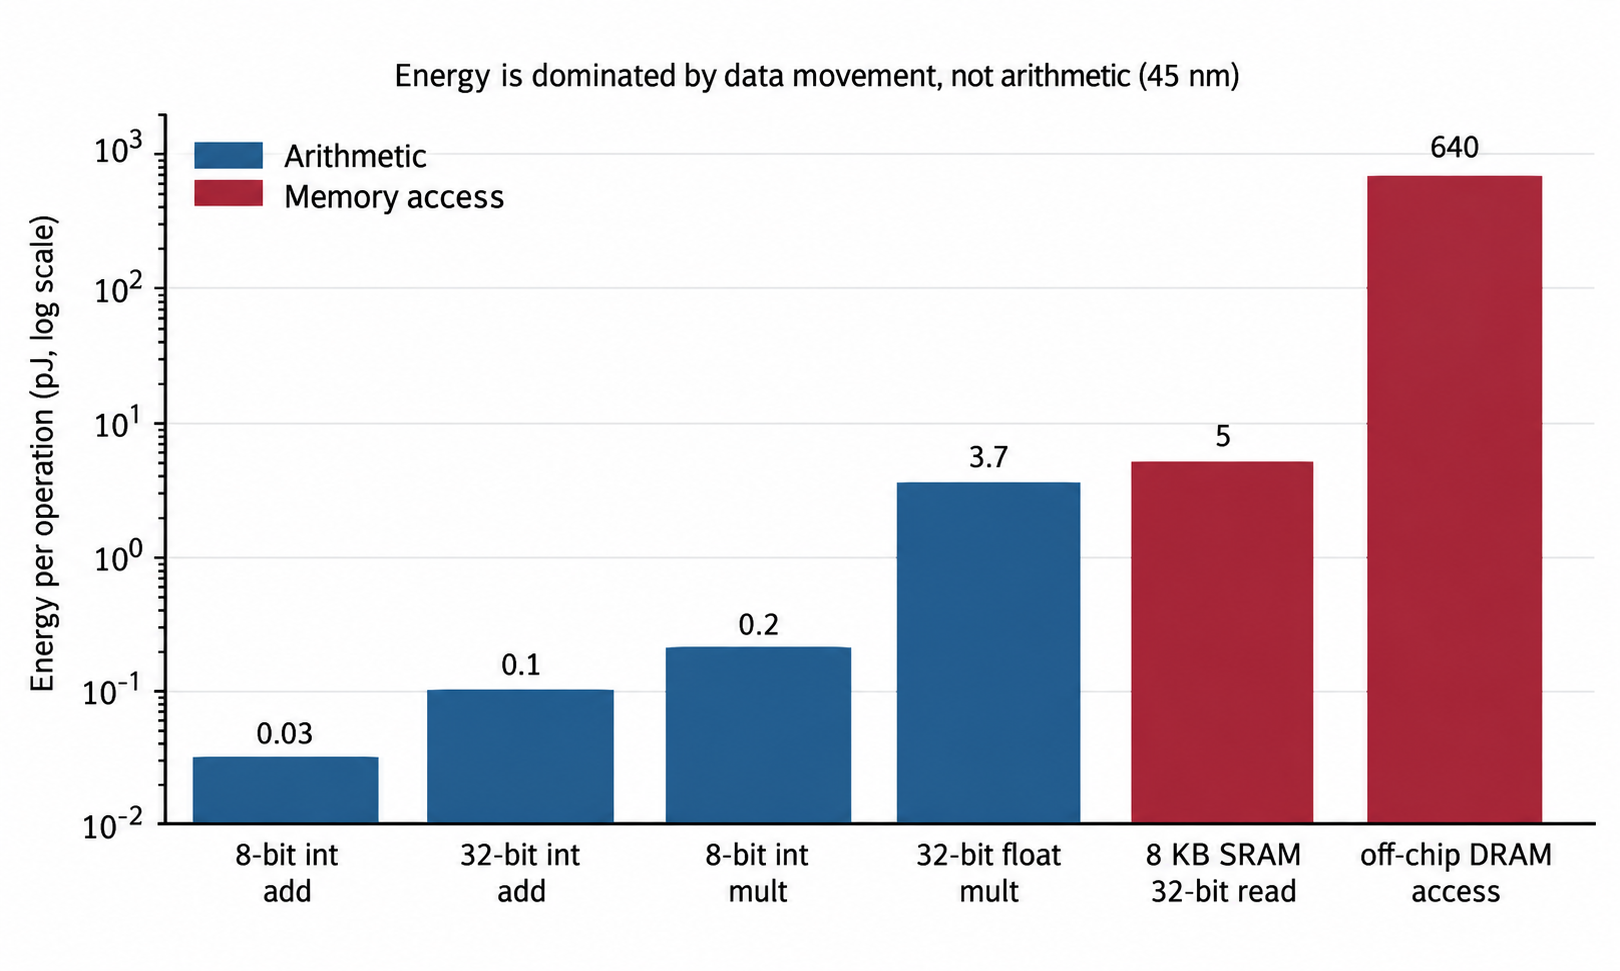
In the AlexNet study, pruning reduced the number of weights from 61 million to 6.7 million without loss of accuracy, a reduction of about 90%12. Quantization yields similar benefits by reducing the precision of weights, resulting in a lower computational footprint27. For the 45 nm process, Horowitz estimates that an integer 8-bit multiply needs 0.2 pJ, while the same operation in floating point requires 3.7 pJ13. Additionally, moving data from one type of memory to another can require even more energy: a 32-bit off-chip DRAM access would cost about 640 pJ, compared to about 5 pJ for an 8 KB on-chip SRAM access13. A combination of sparsity introduced by pruning and lower-precision weights and activations produced by quantization increased inference energy efficiency by 3,400 times versus a GPU and 24,000 times versus a CPU22. Knowledge distillation replicates the output of a larger teacher network with a smaller student network. However, its benefits need to be evaluated on a case-by-case basis, depending on the accuracy of distilled models28 and the extra training overhead.
Efficient Model Design
Variations in model architecture can drastically reduce the amount of computation required before any changes to hardware or cooling infrastructure are warranted. MobileNetV2, for example, requires 300 million multiply-add operations and 3.4 million parameters to operate on the ImageNet data set. In contrast, ShuffleNet achieved roughly 13x faster inference than AlexNet at equivalent accuracy, and EfficientNet-B7 achieved 84.4% top-1 ImageNet accuracy while being 8.4 times smaller and 6.1 times faster on inference than the best existing ConvNet used in that study29,30,23. Even so, improvements in operational count are rarely directly proportional to reductions in power or energy consumption; across several model families, operation count explained about 8% of the variation in measured inference energy consumption31, likely due in part to differences in memory traffic and utilization. As a result of these additional factors, which also affect energy budgets, computational models should be benchmarked on the target hardware on which they will be deployed, as operational counts alone do not capture differences in memory bandwidth or utilization.
Cooling Infrastructure
The cooling infrastructure affects the energy required to maintain computation. However, that relationship runs only one way: cooling affects the energy needed for computation, but savings in the former do not directly translate to reductions in the latter. Consequently, researchers should evaluate cooling options across the whole facility.
Direct-to-Chip and Immersion
In a direct-to-chip system, a pump forces liquid coolant through a cold plate connected to the processor, whereas immersion cooling involves placing the server in a dielectric liquid and eliminating many of the fans and air-conditioning systems typically found in data centers32. Peer-reviewed measurements of immersion-cooled systems report PUE between 1.02 and 1.04, implying overall savings of roughly 10-50% in total facility energy use compared to air-cooled systems; savings of 50% were achieved when immersion cooling was applied to legacy data centers with PUE near 2. Higher savings figures, up to nearly 95%, were reported for immersion cooling, but they apply only to the cooling subsystem, not the data center as a whole14. Both immersion and direct-to-chip options have advantages over air cooling; immersion cooling allows higher rack densities, while direct-to-chip cooling lets facility operators manage temperatures at the level of the individual chip32.
However, there are additional costs associated with immersion systems, including fluid management, material selection, personnel training, and fluid reclamation or disposal. Retrofitting air-cooled data centers to use liquid cooling can be more expensive than constructing new facilities designed around liquid cooling.
Water-Energy Trade-offs
The reduction in power use enabled by improvements in cooling often comes at the expense of increased water consumption, particularly in evaporative cooling systems. Roughly 1 liter of water is needed per kWh of server energy in an evaporative cooling system, but in hot, dry weather, that figure can reach as high as 9 liters of water per kWh33. At the same time, 75% of a U.S. data center’s water footprint is indirect5, reflecting the water used to generate electricity, so reductions in server power consumption will also reduce a data center’s indirect water use. Dry cooling eliminates in-facility evaporation, but it typically consumes more electricity, shifting some of the water footprint to the electric power generation sector33. Those water-energy trade-offs, in turn, need to be evaluated together with the carbon intensity of the electric power supply. In about 40% of U.S. sub-basins, reducing water-scarcity footprint requires a tradeoff with reducing carbon footprint5. Likewise, while servers cooled with liquid have the potential to recapture some waste heat, at 30-45 °C, this limits their applicability to space heating; most district or industrial heating systems would benefit from a heat pump to raise temperatures to 60-90 °C34.
Limits of an Efficiency-First Strategy
Even when improvements at the device, model, or facility level reduce energy consumption per computation, those benefits can be offset or even exceeded by increases in computation performed due to rebound demand or embodied carbon from manufacturing new hardware.
Rebound Demand
Lower costs from efficiency improvements can increase demand for a good or service, thereby raising overall energy consumption even if per-unit consumption decreases. During the growth phase of their respective AI initiatives, Microsoft, Google, and Baidu saw increases in total emissions of 29%, 48%, and 33%, respectively9. These increases cannot be attributed entirely to rebound demand, but even at the level of individual companies, improvements in operational energy efficiency did not produce immediate reductions in overall emissions. Imposing carbon budgets that penalize companies for increases in total energy consumption could mitigate the effect, but such policies may only shift computing workloads to regions with less stringent regulations.
Embodied Carbon and Time-to-Retirement
The energy consumed by a server represents only one component of a server’s overall carbon emissions; manufacturing, transport, construction, and other aspects also contribute to the carbon cost. The combination of rapidly shifting workloads and technologies causes accelerators to be retired early more often, increasing the carbon cost. One estimate of the embodied carbon of fabricated chips places it at 0.1-0.4 kg CO2e per cm2, and fabrication is the single largest contributor to a computer’s carbon emissions over its lifecycle for a number of computing devices15,7. Replacing working equipment only makes sense if lower operational emissions offset the emissions from the new equipment.
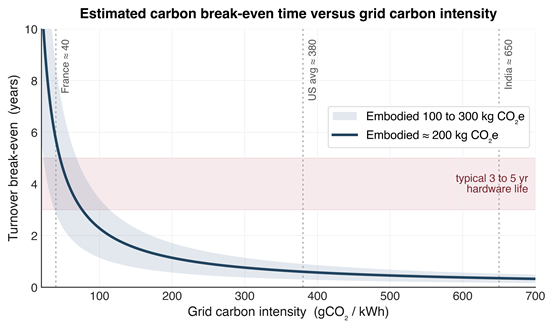
Due to variations in carbon emissions across manufacturing, transport, construction, operations, and decommissioning for different equipment, as well as the impact of the local electricity grid, the optimal timing to replace working equipment depends on several variables. Replacing a general-purpose CPU with a domain-specific accelerator offers much larger potential carbon savings than replacing one accelerator with another, newer one, so Figure 2 only considers the scenario in which the working equipment is replaced with an accelerator that is 1.5x as efficient (operations per watt). At full utilization and 200 kg CO2e in embodied emissions, the break-even point for replacing the equipment occurs after 0.6 years on a 380 gCO2/kWh electricity grid and 5.7 years on a 40 gCO2/kWh electricity grid, such as would be found in France16. With lower utilization rates (e.g., 60%), those break-even dates would be later. Consequently, on a low-carbon electricity grid, keeping existing hardware may produce less lifecycle carbon than replacing it within the usual 3-5-year equipment replacement schedule.
Access and Scale
Specialized accelerators and liquid-cooled facilities require large capital expenditures, purchasing power, and technical expertise, all of which are found primarily among hyperscale operators rather than small data centers, universities, or low-income countries. Lower-cost options such as more efficient accelerators, open source models, shared centers, extended service life, and simplified cooling standards are likely needed for broader adoption.
Discussion
Our analysis highlights the importance of deployment context in data center efficiency. The desired workload determines processor selection. At the same time, cooling choices are driven by local constraints such as water availability and climate, and accelerator replacements are influenced by utilization, grid carbon intensity, and embodied carbon of replacements. Performance metrics should be selected based on the allocation of responsibility for carbon reduction. Energy-per-unit computation describes IT hardware; PUE, the ratio of energy used by the data center to that used by IT equipment, reflects infrastructure choices; WUE and CUE indicate the water and carbon costs of operations, respectively. The embodied carbon from manufacturing and end-of-life processing should still be considered in complete lifecycle assessments. Table 4 applies these metrics to different site classes and decision factors.
| Site or operator condition | Recommended emphasis |
| Cold climate | Use outside-air or free cooling where feasible and track water use |
| Water-stressed region | Favor air cooling or a closed liquid loop and disclose WUE |
| Carbon-intensive grid | Minimize energy per useful computation, procure lower-carbon power, and disclose CUE |
| Low-carbon grid or lightly used equipment | Keep working hardware longer and include embodied carbon in upgrade decisions |
| Small operator or research group | Use efficient open models and shared computing instead of duplicating lightly used infrastructure |
Conclusion
Specialized processors, model compression, efficient architectures, and liquid cooling can all help reduce the energy consumption of computing; however, these methods have different leverage points and therefore cannot be applied indiscriminately. They should instead be evaluated in a context-specific manner based on the characteristics of the underlying workloads, facilities, and operating environments.
For instance, in the case of stable, intensive utilization, architectural specialization can yield considerable efficiency gains. At the same time, the choice of cooling technology is primarily driven by water scarcity and the carbon intensity of the electric grid. The latter factor is also a critical consideration when evaluating the optimal timing for hardware replacements. In particular, on a low-carbon grid and at relatively low utilization rates, it might be preferable to defer replacements to prolong the useful life of existing hardware and offset the carbon costs of manufacturing new servers.
Sustainable computing, therefore, requires a more comprehensive performance metric that includes the ratio of computational operations performed to energy consumed, as well as PUE, WUE, and CUE, utilization rates, hardware lifetime, carbon intensity, and lifecycle emissions. This perspective is especially relevant for computing applications that benefit from specialization, since their efficiency gains often manifest as lower energy budgets per operation, although total electricity use may still rise as demand grows. Finally, in addition to reducing the energy consumption of individual centers, such measures can indirectly reduce the system’s overall resource consumption by enabling shared hosting environments that sustainably support multiple clients.
Overall, the sustainability of AI is a multifaceted challenge that goes beyond energy efficiency and should therefore be evaluated using a comprehensive set of metrics, including hardware utilization, carbon intensity, and water consumption, alongside the traditional PUE, WUE, and CUE. In particular, while electricity is a major contributor to the environmental footprint of most computing centers, reducing energy consumption through greater efficiency must be weighed against total electricity use and the embodied carbon of replacement hardware.
Acknowledgments
The author thanks Dr. Magaly Koch (Boston University) for mentorship, guidance, and feedback during the development of this manuscript
References
- B. Cottier, R. Rahman, L. Fattorini, N. Maslej, T. Besiroglu, D. Owen. The rising costs of training frontier AI models. arXiv:2405.21015, 2024. https://arxiv.org/abs/2405.21015. [↩] [↩] [↩]
- International Energy Agency. Energy and AI. IEA, Paris, 2025. https://www.iea.org/reports/energy-and-ai. [↩] [↩] [↩] [↩] [↩] [↩] [↩] [↩] [↩]
- International Energy Agency. Electricity 2026. IEA, Paris, 2026. https://www.iea.org/reports/electricity-2026. [↩] [↩]
- G. Guidi, F. Dominici, J. Gilmour, K. Butler, E. Bell, S. Delaney, F. J. Bargagli-Stoffi. Environmental burden of United States data centers in the artificial intelligence era. arXiv:2411.09786, 2024. https://arxiv.org/abs/2411.09786. [↩] [↩]
- M. A. B. Siddik, A. Shehabi, L. Marston. The environmental footprint of data centers in the United States. Environ. Res. Lett. Vol. 16, 064017, 2021, https://doi.org/10.1088/1748-9326/abfba1. [↩] [↩] [↩] [↩] [↩]
- M. M. Mekonnen, A. Y. Hoekstra. Four billion people facing severe water scarcity. Sci. Adv. Vol. 2, e1500323, 2016, https://doi.org/10.1126/sciadv.1500323. [↩]
- U. Gupta, Y. G. Kim, S. Lee, J. Tse, H.-H. S. Lee, G.-Y. Wei, D. Brooks, C.-J. Wu. Chasing carbon: the elusive environmental footprint of computing. Proc. IEEE Int. Symp. High-Performance Computer Architecture (HPCA), 2021, arXiv:2011.02839. [↩] [↩] [↩] [↩] [↩] [↩]
- C. P. Baldé, R. Kuehr, T. Yamamoto, R. McDonald, E. D’Angelo, S. Althaf, G. Bel, O. Deubzer, E. Fernandez-Cubillo, V. Forti, V. Gray, S. Herat, S. Honda, G. Iattoni, D. S. Khetriwal, V. Luda di Cortemiglia, Y. Lobuntsova, I. Nnorom, N. Pralat, M. Wagner. The Global E-waste Monitor 2024. ITU/UNITAR, Geneva/Bonn, 2024. https://ewastemonitor.info/the-global-e-waste-monitor-2024/. [↩] [↩]
- A. S. Luccioni, E. Strubell, K. Crawford. From efficiency gains to rebound effects: the problem of Jevons’ paradox in AI’s polarized environmental debate. Proc. ACM Conf. Fairness, Accountability, and Transparency (FAccT), 2025, https://doi.org/10.1145/3715275.3732007. [↩] [↩]
- N. P. Jouppi, C. Young, N. Patil, D. Patterson, G. Agrawal, R. Bajwa, S. Bates, S. Bhatia, N. Boden, A. Borchers, R. Boyle, P.-L. Cantin, C. Chao, C. Clark, J. Coriell, M. Daley, M. Dau, J. Dean, B. Gelb, T. V. Ghaemmaghami, R. Gottipati, W. Gulland, R. Hagmann, C. R. Ho, D. Hogberg, J. Hu, R. Hundt, D. Hurt, J. Ibarz, A. Jaffey, A. Jaworski, A. Kaplan, H. Khaitan, D. Killebrew, A. Koch, N. Kumar, S. Lacy, J. Laudon, J. Law, D. Le, C. Leary, Z. Liu, K. Lucke, A. Lundin, G. MacKean, A. Maggiore, M. Mahony, K. Miller, R. Nagarajan, R. Narayanaswami, R. Ni, K. Nix, T. Norrie, M. Omernick, N. Penukonda, A. Phelps, J. Ross, M. Ross, A. Salek, E. Samadiani, C. Severn, G. Sizikov, M. Snelham, J. Souter, D. Steinberg, A. Swing, M. Tan, G. Thorson, B. Tian, H. Toma, E. Tuttle, V. Vasudevan, R. Walter, W. Wang, E. Wilcox, D. H. Yoon. In-datacenter performance analysis of a tensor processing unit. Proc. 44th Int. Symp. Computer Architecture (ISCA), 2017, https://doi.org/10.1145/3079856.3080246. [↩] [↩] [↩] [↩]
- R. Hameed, W. Qadeer, M. Wachs, O. Azizi, A. Solomatnikov, B. C. Lee, S. Richardson, C. Kozyrakis, M. Horowitz. Understanding sources of inefficiency in general-purpose chips. Proc. 37th Int. Symp. Computer Architecture (ISCA), 2010, https://doi.org/10.1145/1815961.1815968. [↩] [↩] [↩]
- S. Han, H. Mao, W. J. Dally. Deep compression: compressing deep neural networks with pruning, trained quantization and Huffman coding. Proc. Int. Conf. Learning Representations (ICLR), 2016, arXiv:1510.00149. [↩] [↩]
- M. Horowitz. Computing’s energy problem (and what we can do about it). Proc. IEEE Int. Solid-State Circuits Conf. (ISSCC), 2014, https://doi.org/10.1109/ISSCC.2014.6757323. [↩] [↩] [↩] [↩]
- K. Haghshenas, B. Setz, Y. Blösch, M. Aiello. Enough hot air: the role of immersion cooling. Energy Inform. Vol. 6, 14, 2023, https://doi.org/10.1186/s42162-023-00269-0. [↩] [↩] [↩]
- U. Gupta, M. Elgamal, G. Hills, G.-Y. Wei, H.-H. S. Lee, D. Brooks, C.-J. Wu. ACT: designing sustainable computer systems with an architectural carbon modeling tool. Proc. 49th Int. Symp. Computer Architecture (ISCA), 2022, https://doi.org/10.1145/3470496.3527408. [↩] [↩] [↩] [↩] [↩]
- Our World in Data, Ember. Carbon intensity of electricity per kWh. 2024. https://ourworldindata.org/grapher/carbon-intensity-electricity. [↩] [↩] [↩]
- Houston Advanced Research Center, University of Houston. Powering Texas’ digital economy: data centers and the future of the grid. HARC, 2025. [↩]
- Houston Advanced Research Center, University of Houston. Thirsty data and the Lone Star State. HARC, 2026. [↩]
- ISO/IEC 30134-2:2016. Information technology, data centres, key performance indicators, Part 2: power usage effectiveness (PUE). International Organization for Standardization, 2016. [↩] [↩]
- The Green Grid. Water usage effectiveness (WUE): a Green Grid data center sustainability metric, White Paper #35. The Green Grid, 2011. [↩] [↩]
- The Green Grid. Carbon usage effectiveness (CUE): a Green Grid data center sustainability metric, White Paper #32. The Green Grid, 2010. [↩] [↩]
- S. Han, X. Liu, H. Mao, J. Pu, A. Pedram, M. A. Horowitz, W. J. Dally. EIE: efficient inference engine on compressed deep neural network. Proc. 43rd Int. Symp. Computer Architecture (ISCA), 2016, arXiv:1602.01528. [↩] [↩]
- M. Tan, Q. V. Le. EfficientNet: rethinking model scaling for convolutional neural networks. Proc. 36th Int. Conf. Machine Learning (ICML), 2019, arXiv:1905.11946. [↩] [↩]
- M. O’Connor, N. Chatterjee, D. Lee, J. Wilson, A. Agrawal, S. W. Keckler, W. J. Dally. Fine-grained DRAM: energy-efficient DRAM for extreme bandwidth systems. Proc. 50th IEEE/ACM Int. Symp. Microarchitecture (MICRO), 2017, https://doi.org/10.1145/3123939.3124545. [↩]
- E. Strubell, A. Ganesh, A. McCallum. Energy and policy considerations for deep learning in NLP. Proc. 57th Ann. Meeting Assoc. Computational Linguistics (ACL), 2019, arXiv:1906.02243. [↩]
- A. S. Luccioni, S. Viguier, A.-L. Ligozat. Estimating the carbon footprint of BLOOM, a 176B parameter language model. J. Mach. Learn. Res. Vol. 24, 2023, arXiv:2211.02001. [↩]
- B. Jacob, S. Kligys, B. Chen, M. Zhu, M. Tang, A. Howard, H. Adam, D. Kalenichenko. Quantization and training of neural networks for efficient integer-arithmetic-only inference. Proc. IEEE Conf. Computer Vision and Pattern Recognition (CVPR), 2018, arXiv:1712.05877. [↩]
- J. Gou, B. Yu, S. J. Maybank, D. Tao. Knowledge distillation: a survey. Int. J. Comput. Vis. Vol. 129, pg. 1789-1819, 2021, arXiv:2006.05525. [↩]
- M. Sandler, A. Howard, M. Zhu, A. Zhmoginov, L.-C. Chen. MobileNetV2: inverted residuals and linear bottlenecks. Proc. IEEE Conf. Computer Vision and Pattern Recognition (CVPR), pg. 4510-4520, 2018, arXiv:1801.04381. [↩]
- X. Zhang, X. Zhou, M. Lin, J. Sun. ShuffleNet: an extremely efficient convolutional neural network for mobile devices. Proc. IEEE Conf. Computer Vision and Pattern Recognition (CVPR), 2018, arXiv:1707.01083. [↩]
- P. Henderson, J. Hu, J. Romoff, E. Brunskill, D. Jurafsky, J. Pineau. Towards the systematic reporting of the energy and carbon footprints of machine learning. J. Mach. Learn. Res. Vol. 21, pg. 1-43, 2020, arXiv:2002.05651. [↩]
- K. Zhou, X. Yu, B. Xie, H. Xie, W. Fu. Immersion cooling technology development status of data center. Sci. Technol. Energy Transit. Vol. 79, 41, 2024, https://doi.org/10.2516/stet/2024022. [↩] [↩]
- P. Li, J. Yang, M. A. Islam, S. Ren. Making AI less “thirsty”: uncovering and addressing the secret water footprint of AI models. Commun. ACM, 2025, arXiv:2304.03271, https://arxiv.org/abs/2304.03271. [↩] [↩]
- P. Wang, S. Kowalski, Z. Gao, J. Sun, C.-M. Yang, D. Grant, P. Boudreaux, S. Huff, K. Nawaz. District heating utilizing waste heat of a data center: high-temperature heat pumps. Energy Build., 2024, https://www.osti.gov/biblio/2372986. [↩]