Abstract
India’s maritime shipping sector is a major contributor to greenhouse gas emissions due to its use of carbon-based fuels, which could jeopardize the country’s commitment to reach net-zero emissions by 2070. Given limited knowledge around decarbonizing the sector within India, particularly domestic fuel production, this paper investigates the most cost-effective and sustainable marine fuels for India’s shipping sector. To fulfill this aim, this study conducts a literature review of six marine fuels: Methanol, Hydrotreated Vegetable Oil, Liquified Natural Gas, Ammonia, Biomethane, and Nuclear Propulsion. Each is assessed against a well-to-wake baseline for heavy fuel oil of 91.16 gCO2e/MJ. The findings suggest implementing low-emission fuels directly would be difficult, and a gradual transition using multiple fuels may be needed. Biofuels such as HVO and biomethane are most suitable in terms of production, due to India’s vast agricultural sector. LNG and LPG, although popular alternatives, offer only limited decarbonization, and LNG’s cost advantage is smaller than it appears once the delivered price of imported LNG is used rather than the regulated domestic gas price. This paper recommends that India may encourage LNG as a transition fuel, on the basis of its existing infrastructure and technological maturity rather than its price, and then replace it with biomethane, which acts as a drop-in fuel for the same engines. Alternatively, India may encourage HVO production directly and convert diesel vessels to store it. Finally, India may introduce policies similar to Fuel EU, the ETS and the ETD to ensure the sector decarbonizes.
Introduction
Status quo of international shipping
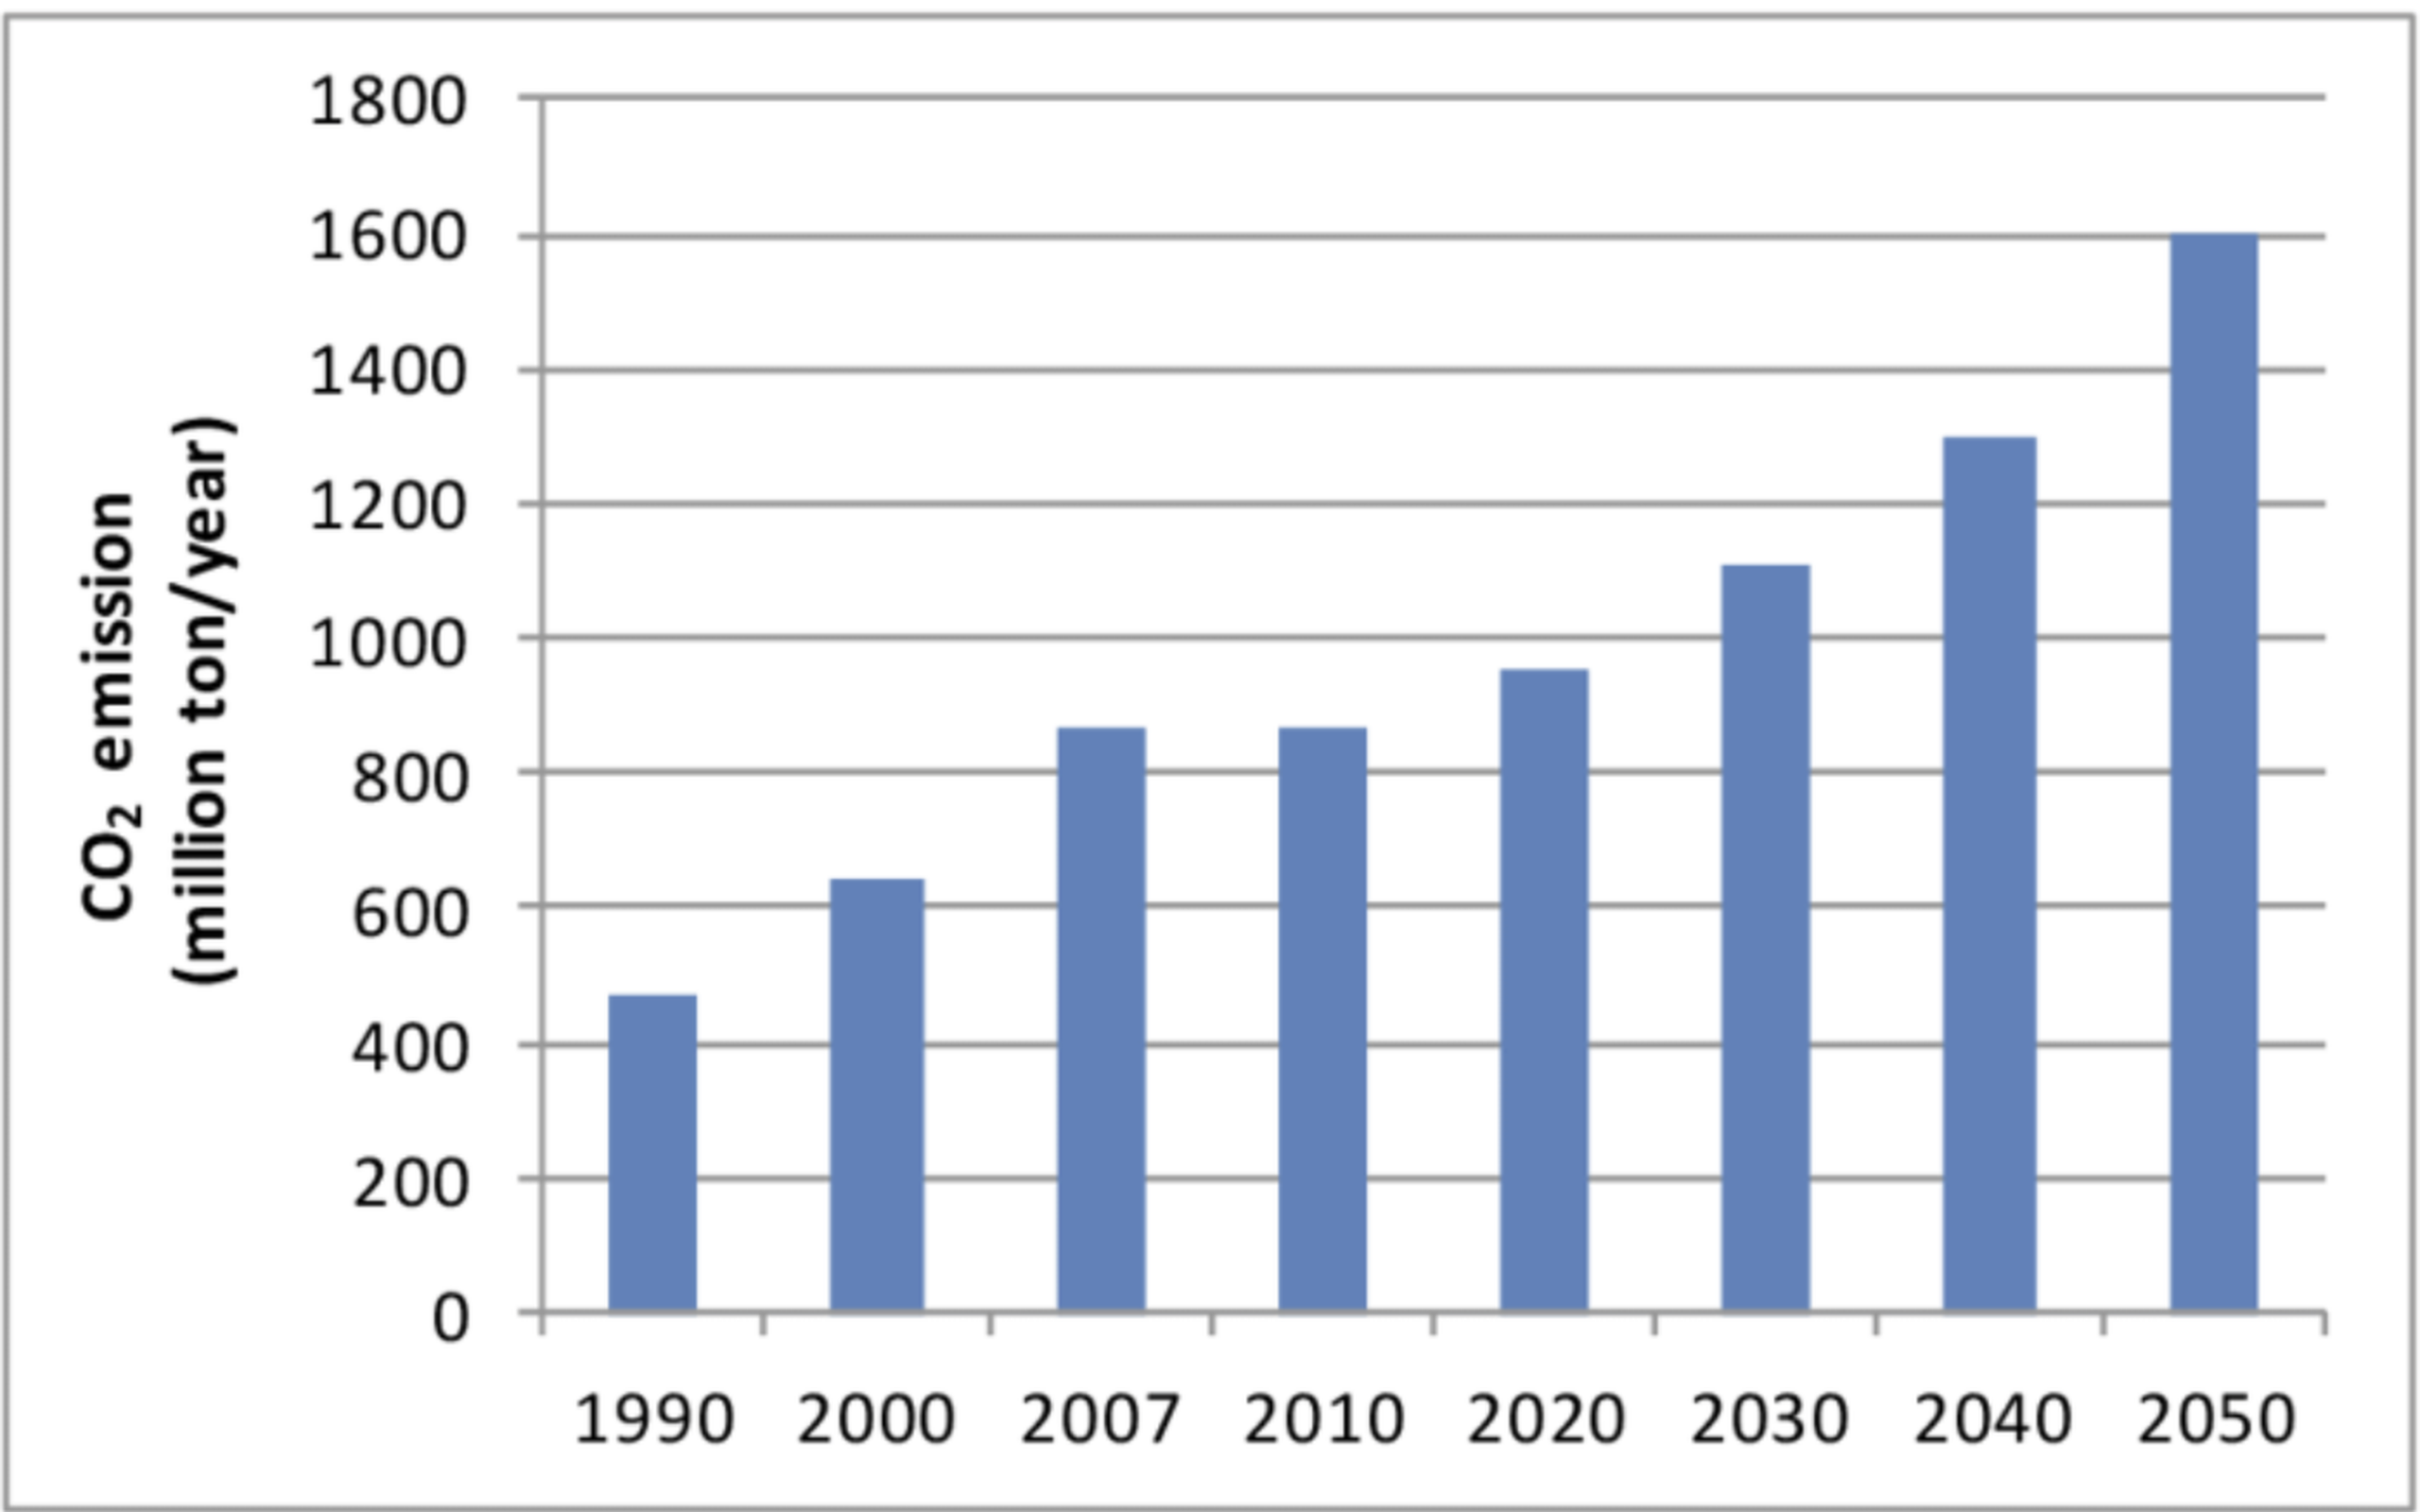
More than 80% of international trade relies on maritime shipping, making it essential for the economy1,2. Most ships depend on carbon-based fuels, contributing to global warming potential. Despite being more environmentally friendly to transport goods via the sea than via the air, the sheer size of the maritime industry leads to high global greenhouse gas (GHG) emissions. The shipping industry emits around 1.1 Gt of CO2 (3% of global greenhouse emissions), as well as 2.3 Mt of Sulphur dioxide and 3.2 Mt nitrogen oxides per year3,4. Figure 1 shows the trend in CO2 emissions from global shipping since 1990, illustrating that absolute emissions from the sector have continued to rise despite improvements in vessel efficiency.
This is why the International Maritime Shipping Organization (IMO) (the UN agency for shipping) established a target to decarbonize global shipping by at least 50% from 2008 levels by 2050 as well as carbon neutral vessels being used commercially by 20306. This environmental impact of shipping is set to rise as world seaborne trade is anticipated to grow by around 3% per year into the early 2020s7. As with other sectors, there is no single pathway to decarbonization. For reducing carbon emissions, a range of options is required, including alternative fuels, increasing technical or operational efficiencies (retrofitting) and reducing demand. Shipping has seen shifts in fuel usage before, such as coal to diesel in the 1920s or from diesel to heavy fuel oil (HFO) in the 1950s8. Liquefied natural gas (LNG) is the most used alternative fuel to liquid fossil fuels, by offering reduced air quality impacts and direct CO2 emissions, although methane emissions have been shown to reduce the GHG benefit9. Other alternatives include biofuels, methanol, hydrogen, ammonia, electric propulsion or even nuclear fuels, which offer differing levels of decarbonization and have different economic costs along with air pollutants. But the impact on efficiency depends on various factors such as the class of vessel and its application.
Status quo of the Indian shipping sector
The Paris agreement, signed in 2015, is a legally binding international treaty on climate change adopted by 196 parties at COP21(21st Conference of the Parties to the United Nations Framework Convention on Climate Change). Its main objective is to keep the global temperature rise well below 2 degrees Celsius as compared to pre-industrial levels10 India has the aim to reach net-zero emissions by 2070 as a signatory to the Paris agreement11.
The Maritime India Vision 2030 has the aim to make India within the top 10 countries for shipbuilding and the top country for ship recycling12. India is currently second in the world for ship recycling and 21st in the world for shipbuilding13. China, South Korea and Japan together contribute to 90% of the world’s shipbuilding capacity, yet India accounts for less than 0.045% of the capacity today13. Additionally, India is among the top five countries in supplying trained manpower for shipping, with about 12% of all seafarers in the world coming from India14. The clear aim of the Ministry of Shipping is to encourage the use of technologies, particularly the creation of vessels that use alternative fuels14. Thus, we explore the feasibility of using various alternative fuels in medium and small shipping vessels used in inland water transport (IWT) and coastal shipping. The reduced involvement of international bodies, such as the International Maritime Organization (IMO), creates some leeway for the Ministry of Ports, Shipping and Waterways (MoPSW) and the Inland Waterways Authority of India (IWAI) to explore the potential of deploying clean fuel technologies in small and medium vessels. The scope of the waterways sector transcends state boundaries. So, we must view the clean fuel transition from a national perspective.
Scope of the Paper
In this study we will conduct a literature review on the alternative marine fuels and investigate the most cost-effective and sustainable decarbonization pathway for India’s shipping sector. This aim of the paper will be addressed by assessing different fuels based on their volumetric and mass density, their production emissions (well-to-tank emissions), their emissions when used (tank-to-wake emissions), total emissions (well-to-wake emissions), the capital cost of implementing, safety and more. Then based on India’s shipping sector, this paper will assess and recommend the best fuel type or range of types for the region. This paper’s scope will explore the most promising marine fuels: Ammonia, Hydrotreated Vegetable Oil, Biomethane, Liquefied Natural Gas, Nuclear Propulsion and Methanol; based on the examined literature.
Methodology
This paper conducts a literature review to explore the scope. Google Scholar was used as the search engine, with keywords including, but not limited to: Indian shipping sector, marine fuels, green shipping, and decarbonization of shipping. Searches were conducted in two stages, an initial search and an updated search carried out during revision to obtain baseline emissions, fuel property and price data from primary institutional sources. These keywords generated multiple results out of which papers were filtered based on recency. The more recent results were then verified as peer-reviewed sources before they were filtered for relevance. Relevance differed between sections and selections were made based on the type of data that was meant to be extracted.
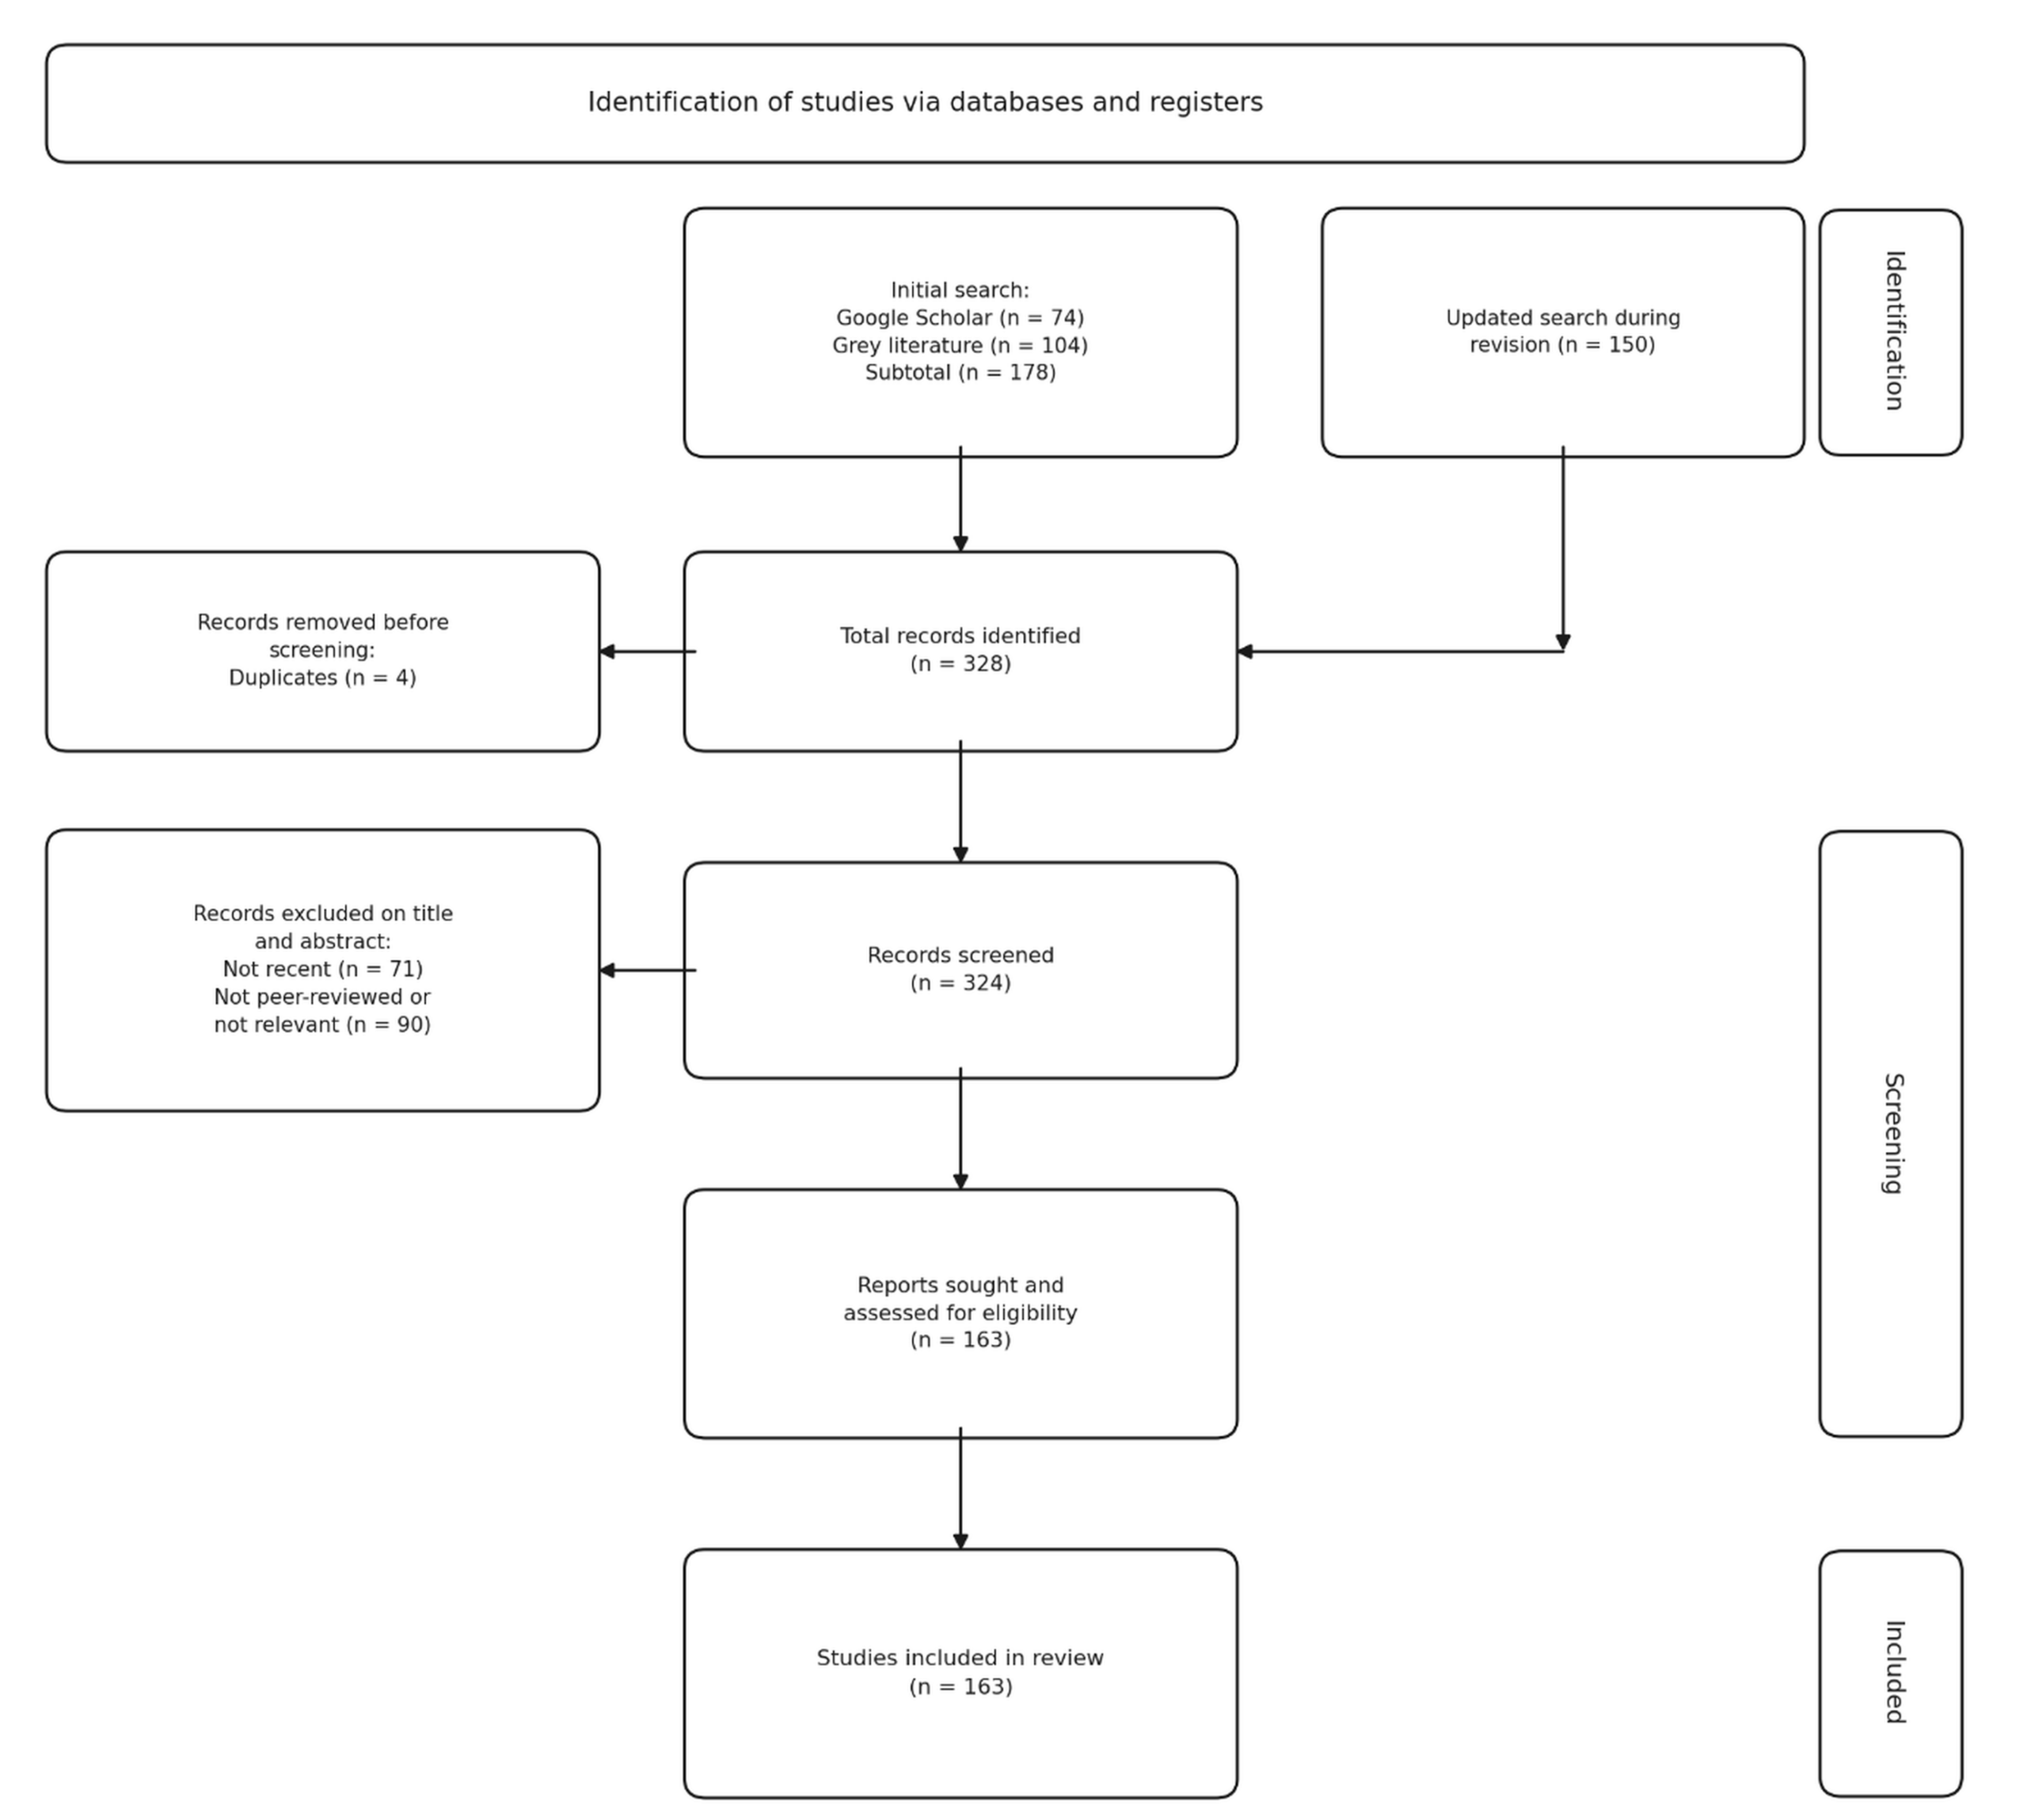
For example, using the keywords “decarbonization”, “fuels”, and “ship” gives us 28,500 results. Filtering the results to include articles since 2024 gives us 16,900 results. The specific usage of this article was to obtain data on methane as an alternative fuel. Thus, the keyword “methane” was used, resulting in 7,460 articles. Results were limited to those with the initial keywords in the title (“decarbonization”, “fuels”, and “ship”) and the word methane within the article. This left us with 1 article, The future of ship engines: Renewable fuels and enabling technologies for decarbonization. This same methodology was applied to other keywords such as Hydrogen, Nuclear Propulsion, LNG, and more. The figures above are the number of results returned by the database, not the number of records examined. Because Google Scholar ranks results by relevance, only the leading results of each search were screened by title, and Figure 2 reports the number of records screened at each stage rather than the total returned by the database.
Alternative clean fuels for the shipping sector
Various alternative fuels exist for the shipping sector. However, none of the prominent examples: liquified natural gas (LNG), methanol, biofuels, ammonia, methane, hydrogen, etc.; stand out as perfect alternatives to the current heavy fuel oil (HFO). Each one of these fuels has drawbacks that may or may not be significant depending on the type of ship being used, thus a variety of fuels for various vessels seems ideal. An analysis adapted from a DNV study15 investigates the various important parameters for alternative marine fuels and based on these parameters, they have produced ratings as illustrated in Table 1. These alternative fuels are Heavy Fuel Oil (HFO), Low Sulphur Fuel Oil (LSFO), Liquefied Natural Gas (LNG), Methanol, Liquefied Petroleum Gas (LPG), Hydrotreated Vegetable Oil (HVO), Biomethane, Hydrogen, Electric Propulsion, Nuclear Propulsion, and Ammonia. Heavy fuel oil is included in this section not as an alternative clean fuel but as the incumbent marine fuel against which all alternatives are assessed. Section 2.1 therefore establishes HFO as the reference case for all other fuels.
| Fuel | |||||||||||
| Fossil Fuels | Biofuels | Renewables | |||||||||
| HFO15 | LSFO15 | LNG15,16 | Methanol17,18,19,20,16 | LPG16 | HVO21,22,23,16 | Biomethane24,25,26,27 | Hydrogen21,17,28,20,16 | Fully Electric29,21,30,16 | Nuclear31,32,33,34 | Ammonia21,35,17,20,16 | |
| High Priority Parameters | |||||||||||
| Volumetric Energy Density36,37 | |||||||||||
| Specific Energy Density36,37 | |||||||||||
| Technological Maturity | |||||||||||
| Well-to-tank emissions | |||||||||||
| Tank-to-wake emissions | |||||||||||
| Energy Cost | |||||||||||
| Cost of conversion | N/A | ||||||||||
| Cost of storage | |||||||||||
| Bunkering availability (supply)38 | |||||||||||
| Commercial readiness | |||||||||||
| Other Key Parameters | |||||||||||
| Flammability | |||||||||||
| Toxicity | |||||||||||
| Regulations and Guidelines12 | |||||||||||
| Global product capacity and locations | |||||||||||
Note: The colored version of the table is available in the PDF.
Heavy Fuel Oil (HFO): the reference case
Heavy fuel oil is the conventional fuel currently used across shipping and is not itself an alternative clean fuel. In table 1, the main advantages of Heavy Fuel Oil are its high energy density in terms of both mass and volume, its cheaper cost and high technological maturity, and convenience (ships already use it). Additional advantages include its relative safety compared to some alternative fuels, and ease of production. However, the resource also presents disadvantages, namely its high well-to-wake GHG emissions. Thus, its replacement in India’s shipping is vital and would have major effects on overall air pollution in the region as around 3% of global GHG emissions can be pointed towards shipping majority of which uses HFO.
HFO-fueled shipping is the baseline for emissions in this paper. The fleet-average well-to-wake intensity in 2020 for the fuel was 91.16 gCO2e/MJ and every alternative fuel measures against this baseline39.
The tank-to-wake carbon factors used throughout are the values adopted by the IMO: 3.114 gCO2 per gram of fuel for HFO, 2.750 for LNG and 1.375 for methanol40. Well-to-wake intensity is then derived in four steps. Tank-to-wake emissions in gCO2/MJ are found by dividing the carbon factor by the fuel’s lower calorific value. Well-to-tank emissions are taken from the sources cited in Section 4. The two are added together to give the well-to-wake figure, which is then expressed as a percentage change against the baseline. Where the carbon in a fuel is biogenic or recycled from captured carbon dioxide, tank-to-wake emissions are counted as zero, as that carbon was absorbed from the atmosphere rather than released from underground.
Applying this method to HFO itself returns 90.4 gCO2e/MJ, within 1% of the baseline. Thus, the method reproduces the figure it is measured against. Table 2 sets out the derivation for every fuel pathway. Methanol has the widest range of any fuel covered: 74% above the baseline by the coal route and 95% below it by the renewable route. Thus, the production route matters more than the choice of fuel itself, a point returned to in the conclusion.
| Fuel / pathway | Cf (gCO2/g) | LCV (MJ/g) | TtW (gCO2/MJ) | WtT (gCO2e/MJ) | WtW (gCO2e/MJ) | Change vs baseline |
| HFO (reference case) | 3.114 | 0.0405 | 76.9 | 13.5 | 90.4 | — |
| LNG (fossil) | 2.750 | 0.0500 | 55.0 | 12.6 – 27.0 | 67.6 – 82.0 | 10 – 26% lower |
| Biomethane | 2.750 | 0.0500 | 0 (biogenic) |  14.9 | 14.9 | 83.7% lower |
| Methanol (coal route) | 1.375 | 0.0200 | 68.8 | 90.0 | 158.8 | 74% higher |
| Methanol (renewable) | 1.375 | 0.0200 | 0 (recycled) | 4.6 | 4.6 | 95% lower |
| HVO | — | 0.0440 | 0 (biogenic) | 6.9 | 6.9 | 92% lower |
| Green ammonia | 0 | 0.0186 | 0 | 0 | 0 | 100% lower |
Hydrogen
H2 is one of the most preferred energy carriers to decarbonize engine power and propulsion. Most hydrogen that is produced from natural gas41 via methane steam reforming, is called grey hydrogen. Using Carbon Capture, Utilization and Storage (CCUS), it would transform grey hydrogen to blue hydrogen. Green hydrogen, however, is produced mainly via electrolysis of water or photolytic (direct solar water splitting) processes42. It can also be produced through other routes such as biomass pyrolysis and microwave pyrolysis43, and processes like HyPr-RING where water reacts with hydrocarbons to form H2 and CO244. Merits include an extremely high specific energy density which reduces overall weight of the ship which reduces extra fuel required for propulsion due to added weight of the fuel45. The absence of carbon allows for hydrogen combustion, in theory, to only yield water as a product, eliminating GHG emissions like CO2, CO and HC (Hydrocarbons). Challenges associated with H2 fuel include low volumetric energy density at 10.7 MJ/m346 leading to higher rates of storing fuel. Additionally, its low boiling point at 20K increases chance of pre-ignition due to possible hot spots in its vicinity.
Ammonia
The commercial method of producing ammonia is the Haber-Bosch process that uses hydrogen and nitrogen at certain conditions47. Using renewable energy sources to replicate conditions for the Haber-Bosch process creates green ammonia with little to no well-to-wake emissions47. However, producing green ammonia is much more expensive than conventional ammonia, where 90% of its production relies on fossil fuels increasing well-to-tank emissions47. Ammonia, unlike liquified hydrogen, enables more hydrogen storage in liquid form without needing to use cryogenic storage (−33.4 ◦C for ammonia compared to−252.9 ◦C for hydrogen), making NH3 a suitable hydrogen carrier47. The capital cost required to store ammonia, although not as expensive as other alternatives like hydrogen, is still more than HFO47. Ammonia can be used as drop-in fuel in diesel engines, gas turbines and as a primary fuel in fuel cells, making ammonia a suitable alternative to HFO47. Other advantages include a decent energy density, as well as low capital costs for storage and conversion. However, other disadvantages include safety concerns as ammonia is extremely toxic to humans and wildlife, thus lots of safety measures are required48.
Biomethane
Methane is a fuel of tremendous interest in terms of shipping since it has the shortest carbon chain paraffin. Its potential to reduce GHG emissions by as much as 25% when considering its single carbon structure which results in lower tank-to-wake CO2 emissions alongside the benefit of minimal retrofitting/ easy implementation49. Biofuel Methane is produced the same as biogas with the addition of a carbon capture process at the end which separates the Methane from the Carbon Dioxide. This process involves the usage of anaerobic digestion to process any kind of organic matter (e.g. Food, agricultural crop, sewage wastes) through microbial decomposition in a “digester” to give out a combination of methane and Carbon Dioxide50. The biggest challenge for the fuel is the untimely release of unburnt methane into the atmosphere known as methane slip, occurring during combustion if methane particles in the crevices between the piston and cylinder wall did not ignite due to slow flame distribution51,52. The solution to this is direct fuel injection into the cylinder which would increase retrofitting costs but be safer. Its other main disadvantage is a greater energy cost and lack of global product capacity.
Nuclear Propulsion
Nuclear propulsion represents one technology that could decarbonize shipping, as it is the only technology for ocean-going ships where propulsion power generation emits zero CO2, CH4, NOx, SOx and PM31. However, nuclear propulsion is still at its early stages for shipping and the cost of a nuclear-powered ship is about 7 times that of an oil powered alternative. Currently, the operational costs of a nuclear-powered ship such as maintenance, insurance and security are higher than the alternative32. The ship works on the fission of Uranium atoms which releases heat for the primary coolant that passes heat to boiling water to create steam that drives turbines connected to propeller shafts giving propulsion. This means that nuclear ships can be used for extremely long extended ranges without need for refueling33 and it takes up less storage and mass33. These ships, however, do have the risk of accidents and they have practically no global capacity34,31.
Hydrotreated Vegetable Oil
Green diesel/ hydrotreated vegetable oil is obtained from triglycerides by the process of hydrogen treating vegetable oils together with waste and fat residue fractions. It has a density of around 780kg/m3 which allows for lower storage costs. It also has a high calorific value which lowers energy costs53. Although HVO does have a substantial amount of well-to-tank emissions, it is significantly lower than diesel and the emissions stem from renewable feedstock that absorbs carbon dioxide as it grows, thus its net greenhouse emissions are still extremely low54. HVO can operate easily on existing diesel engines, reducing conversion costs and increasing technological maturity. However, its main disadvantage remains with its lack of supply as shown in the table. This can be combatted with more investment into the fuel type as India’s large agricultural sector presents lots of feedstocks, agricultural crops and more whose resources can be redirected towards the production of this fuel. This initiative, however, requires governmental intervention via policies which will be discussed later. In terms of safety, the fuel is adequate as shown in the table and poses no major concerns.
Liquefied Natural Gas (LNG)
Liquified Natural Gas can be considered a reliable alternative for our current situation as it has lower energy costs compared with HFO or LSFO. Additionally, it is significantly less in GHG emissions when compared to HFO or coal. As technology matures, the amount of GHG emissions is expected to be significantly reduced. Its similarity in density properties to HFO makes it extremely attractive as an immediate replacement. Disadvantages, however, include a high upfront cost for conversion (not as high compared to other fuels) and high cost of storage55.
Liquified Petroleum Gas (LPG)
LPG is a mixture of gases produced from petroleum and stored under pressure and at low temperatures to keep it in a liquid state. The boiling point of LPG varies from 229 K to 273 K so that the pressure required to liquefy it is considerable and the containers for it must be heavy steel. LPG has a mean octane value (a fuel’s resistance to premature ignition) of 104, which is higher than gasoline’s value. The LPG vapor is odorless, colorless, and heavier than air, so it requires wind or ventilation to disperse. Its ignition temperature is high, igniting at around 755 K. LPG is flammable in concentrations between 2 and 10% in air, which is risky if the engine is not built to prevent this56. It only has capacity to decarbonize shipping by 20%, which is its main disadvantage as it isn’t a permanent alternative.57
Methanol
Short-chain alcohols are of interest among alternative fuels owing to the mature production technology, available feedstock, and distribution infrastructure. Methanol is one of the alcohols of highest interest. Its specific energy density is around 20 MJ/kg (half of diesel)19. Thus, the fuel injection system must be modified to accommodate an adequate fuel flow rate for obtaining adequate power. The fuel is toxic and has a low flash point, which requires guidelines and regulations to be followed for its storage and transmission. In Table 1 its toxicity is rated as acceptable rather than poor because methanol’s hazard arises primarily through ingestion and prolonged exposure, whereas ammonia is acutely toxic by inhalation at low concentrations and is therefore rated more severely51. Methanol is produced using processes that involve obtaining synthesis gas from feedstocks like natural gas/ captured CO2 and hydrogen, followed by catalytic conversion to methanol58.
Non-greenhouse-gas emissions
The fuels also vary in Sulphur Oxides (SOx), Nitrogen Oxides (NOx) and Particulate Matter (PM) emissions, which have a severe impact on ports and coastal areas. Sulphur oxide emissions are entirely dependent on the Sulphur content of the fuel. LNG, biomethane, methanol, ammonia, and hydrogen don’t contain any Sulphur, so there are no SOx emissions. HVO also has negligible SOx emissions due to its desulphurisation during hydrotreatment. Particulate matter forms as a result of incomplete combustion of heavy hydrocarbons, and from sulphate condensation. The simpler, sulphur-free fuels produce far less PM as compared to the alternative. LNG and methanol particularly have large reductions in PM emissions. HVO also reduces PM emissions significantly. NOx emissions form thermally from nitrogen in the combustion air, so it depends on the peak combustion temperature. LNG and methanol have low peak temperatures for differing reasons, so they achieve substantial reductions. Ammonia, however, contains Nitrogen and thus, it can produce NOx and Nitrous Oxide. Nuclear propulsion does not produce any of these pollutants.
The fuels explored further were not chosen by simply counting how many factors were ranked poor or very poor. A fuel may perform poorly on factors that are expected to improve over time, while still offering decarbonization potential that mature fuels cannot match. Thus, three criteria were used in order of importance. The first is well-to-wake emissions reduction compared to the HFO reference case, as decarbonization is the aim of this paper. The second is how feasible production of the fuel is within India, since the scope of this paper is domestic. The third is the time period in which the fuel can realistically be used, so that both immediate transition fuels and long-term replacements are covered. Based on these criteria, six fuels are explored further. LNG and biomethane are both included as biomethane is a drop-in fuel for LNG infrastructure, making them a near-term and long-term pair. HVO is included due to its high decarbonization potential and its compatibility with existing diesel engines. Ammonia and methanol are included as both can reach almost zero well-to-wake emissions when produced via renewable routes, despite their high energy-equivalent cost and, in the case of ammonia, its toxicity. Nuclear propulsion is included only as a long-term option. It performs poorly in terms of technological maturity, bunkering availability, cost of conversion and regulations, and it cannot be deployed within the period of India’s current targets. However, it is the only option that emits zero CO2, CH4, NOx, SOx and PM at the point of use. LPG is not included despite performing well on most factors, as it only has the capacity to decarbonize shipping by 20%. Hydrogen and fully electric propulsion are not included due to their volumetric energy density, which is too low for the vessels considered here. LSFO is not included as it is a fossil fuel with only marginal emission reductions, and HFO is treated as the reference case rather than an alternative throughout this paper. Thus, the fuels explored in the following sections are ammonia, hydrotreated vegetable oil, biomethane, liquefied natural gas, nuclear propulsion and methanol.
Indian Shipping Sector
The Chairman of the National Shipping Board, Dr Sanjeev Ranjav, described India’s shipping sector through the following key aspects. India has all building blocks for a vibrant shipping industry. However, it has not been competitive enough. Some nations have been able to strike the right balance; India has some distance to go. COVID-19 did not impact the Indian shipping industry much due to the pro-active approach of the Government of India. India always understood the strategic nature of the shipbuilding industry. The Indian Navy ship design and construction is a clear indication. Many shipyards have developed infrastructure and competence/ capabilities courtesy Indian naval orders. The Maritime India Vision provides a clear roadmap for India’s shipping industry59.
Size of the Shipbuilding Sector
India’s shipping sector is significant not only in terms of its various ports but also its shipbuilding with 28 shipyards (8 public sector and 20 private sector). Yet, its recent shipbuilding contributions have declined to less than 1% of global contributions dropping from its place on the Top 10 shipbuilding countries in the world in the early 2000s59. However, the government of India has come out with a Rs 25000-crore (approximately 2.8 billion USD) Maritime Development Fund, with up to 49% government contribution. The fund will help to expand India’s shipbuilding and repair capabilities as well as possible retrofitting jobs60. In 2018, the Indian shipyards have the orders for 231 vessels with 69 for the public sector and 162 for the private sector61, giving them a 6.3% market share in the global economy. DWT refers to deadweight tonnage which is a measure of the total weight a ship can safely carry. Table 3 shows the order book position of Indian shipyards in 2018, indicating the domestic capacity available to build new vessels and therefore the extent to which India could construct alternative-fuel-capable ships domestically rather than relying on retrofits or foreign yards.
| Yard Types | Vessels | Tankers | Dry Cargo | Bulk Cargo | Passengers | Others | Total |
| Public Sector | No. | 5 | 0 | 1 | 7 | 56 | 69 |
| DWT | 3280 | 0 | 53000 | 10320 | 82030 | 148630 | |
| Private Sector | No. | 3 | 16 | 23 | 4 | 116 | 162 |
| DWT | 3700 | 58580 | 644000 | 2530 | 144020 | 852830 | |
| Total | No. | 8 | 16 | 24 | 11 | 172 | 231 |
| DWT | 6980 | 58580 | 697000 | 12,850 | 226050 | 1001460 |
Size of the Trading Sector
India’s Maritime trade has grown rapidly with an annual growth of 6-8% in container volumes, driven by increasing imports and exports, improved port capacities, and strategic policy measures. It currently sits at 12.28 (‘000 TEU) in FY24. Major ports like Jawaharlal Nehru Port Trust (JNPT), Mundra and Chennai serve as critical gateways for trade with JNPT being the largest container62. Table 4 lists India’s major ports and their maximum draft depths. Draft depth determines the largest class of vessel a port can receive and therefore sets an upper bound on the cargo volume that can move through each gateway.
| Location | Name of Port63,64 | Draft (mts), max65,66,67 | |
| 1 | Kolkata | Syama Prasad Mookerjee Port | 8.0 |
| 2 | Paradip | Paradip Port | 14.5 |
| 3 | Visakhapatnam | Visakhapatnam Port | 14.5/ 18.1 |
| 4 | Chennai | Chennai Port | 15 – 16.5 |
| 5 | Ennore | Kamarajar Port Limited | 1538,68 |
| 6 | Tuticorin | V.O. Chidambaram Port | 14.2 |
| 7 | Kochi | Cochin Port | 12.5 |
| 8 | New Mangalore | New Mangalore Port | 14.069 |
| 9 | Mormugao | Mormugao Port | 14 |
| 10 | Mumbai | JNPT | 15 |
| 11 | Mumbai | Mumbai Port | 12 |
| 12 | Kandla | Deendayal Port | 14.1 |
Between April-July 2025, India had 149.2 billion dollars’ worth of merchandise exports and 244.01 billion dollars’ worth of merchandise imports. Compared to April-July 2024, where merchandise imports were around 144.76 billion dollars and merchandise exports were around 231.59 billion dollars70. In terms of inland water transport, a record breaking 145.5 million tonnes of cargo was moved during the fiscal year 2024-2025. Additionally, there was an additional 5 national waterways that became operational71.
Alternative Fuels
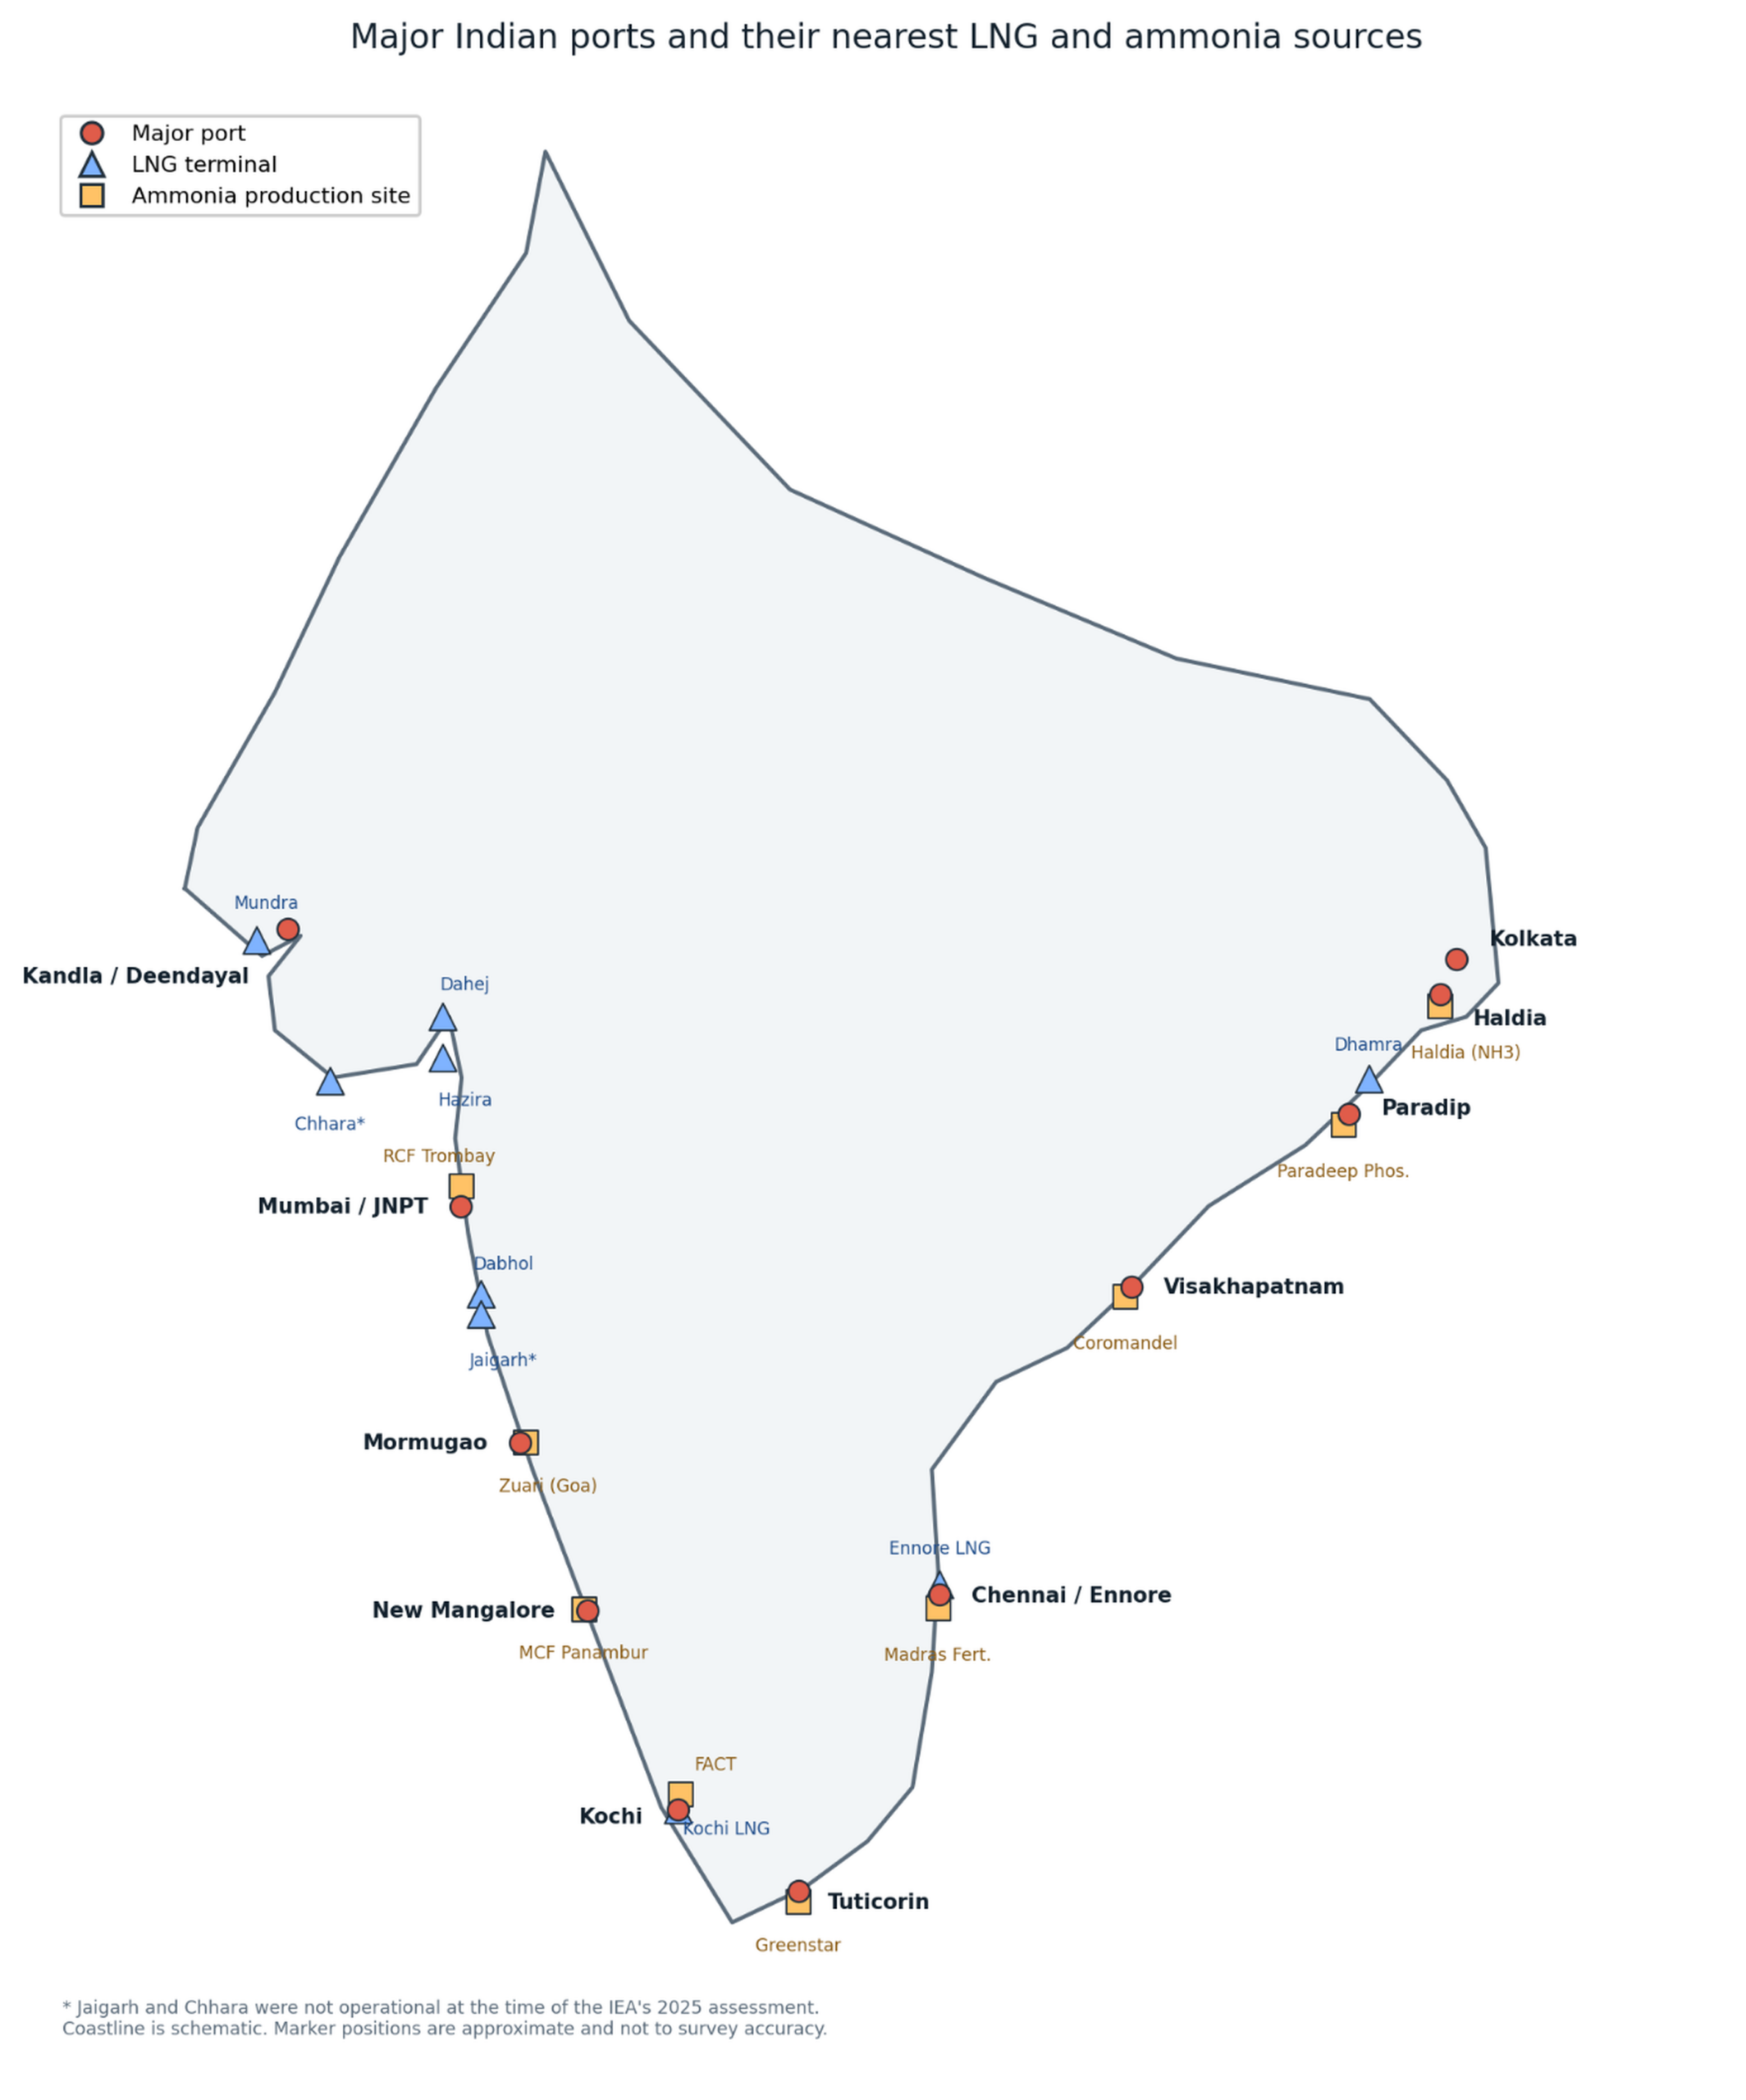
Currently there are no fully developed Methanol, HVO and Nuclear facilities close to any major ports. Nuclear energy for shipping is still in development within the region of India and major ports aren’t remotely close to its sources. This may be a problem that can’t even be solved soon as nuclear plants are usually kept extremely far from densely populated areas (ports) due to the risk of leakages or explosions. HVO, however, as a fuel is not invested into much by the Indian government and its lack of supply prevents India from investing heavily into it. Methanol has initiatives to bring it near major ports, but nothing has been fully executed yet72. However, LNG, methane and ammonia have sources that are in a reasonable proximity of major ports. Table 5 summarises the distance between each major Indian port and the nearest production or import source for LNG, ammonia and methane, indicating where bunkering infrastructure could be established with the least additional transport burden. Figure 3 presents this data on a map of India.
| Port | LNG Source | Ammonia Source | Methane source |
| Kandla/Deendayal (Gujarat) | Mundra: 65-80km | Hazira: 270-300km | Gas grid is widely available in Gujarat |
| Mumbai Port (Maharashtra) | Dabhol: 230-250km | RCF Trombay: 25km | Dense City-gas and trunk pipelines in/around Mumbai |
| JNPT (Maharashtra) | Dabhol: 230-250km | RCF Trombay: 35-40km | Dense City-gas and trunk pipelines in/around Mumbai |
| Mormugao (Goa) | Dabhol: 180-220km | Zuari: 10-20km | Goa CGD developing |
| New Mangalore (Karnataka) | Kochi: 250-300km | MCP Panambur: 0-10km | CGD present |
| Kochi (Kerala) | Kochi: 0-15km | FACT Udyogamandal 15-30km | Kochi is on the gas grid (RLNG) |
| Chennai (Tamil Nadu) | Ennore: 20-30km | Madras Fertilizers: 10-15km | Chennai CGD tied to RLNG |
| Ennore (Tamil Nadu) | Ennore: On site | Madras Fertilizers: 10-15km | RLNG originates here |
| Tuticorin (Tamil Nadu) | Ennore: 260-320km | TLF/Greenstar: 0-10km | CGD developing |
| Visakhapatnam (Andhra Pradesh) | Dhamra: 500-600km | Coromandel International: port adjacent | CGD in Vizag |
| Paradip (Odisha) | Dhamra: 110-130km | Paradeep Phosphates: 0-10km | Eastern India gas grid expansion benefits Odisha coast |
| Kolkata (West Bengal) | Dhamra: 280-320km | Haldia: 120km | Eastern India gas grid expansion targets Kolkata |
| Haldia (West Bengal) | Dhamra: 250-290km | Haldia: 0-10km | Eastern India gas grid expansion targets Haldia |
Operational measures
Fuel substitution isn’t the only route to decarbonizing India’s shipping sector. A variety of vessel-level measures are also capable of achieving this effect.
Engine load management: Marine engines have a specific fuel consumption curve that is minimized over a small load band. If operated outside of the band, it would raise fuel burn for the same work which is less efficient. Thus, matching engine loading to the vessel’s operating profile would cut emissions directly.
Route optimisation: Fuel consumption depends on weather and sea state, not just the distance traveled. By avoiding adverse conditions during the shipping route, vessels will consume significantly less fuel than what would be the shortest path77.
Speed reduction: Propulsion power of a fuel rises with a cube of the speed. Thus, a modest speed cut could give a disproportionate saving of fuel consumption. This is an easy fix to be implemented on an individual level.
Power management: By controlling auxiliary loads, there can be smaller gains: shore power in port, waste heat recovery, etc. These small gains on a larger scale across the shipping sector could result in vital decarbonization to comply with goals.
These measures apply to the current fleet and no new bunkering infrastructure is needed for its implementation. Every fuel in this paper would need considerable investment in production, distribution and storage first. Thus, these measures would play a significant role in starting the decarbonization process immediately.
Alternative Marine Fuels Production Pathways
This section will focus particularly on how these fuels are produced within India: sourcing of raw materials, manufacturing of the fuel, distribution to ports and how to store near ports. It evaluates how feasible each fuel is as an alternative for decarbonizing India.
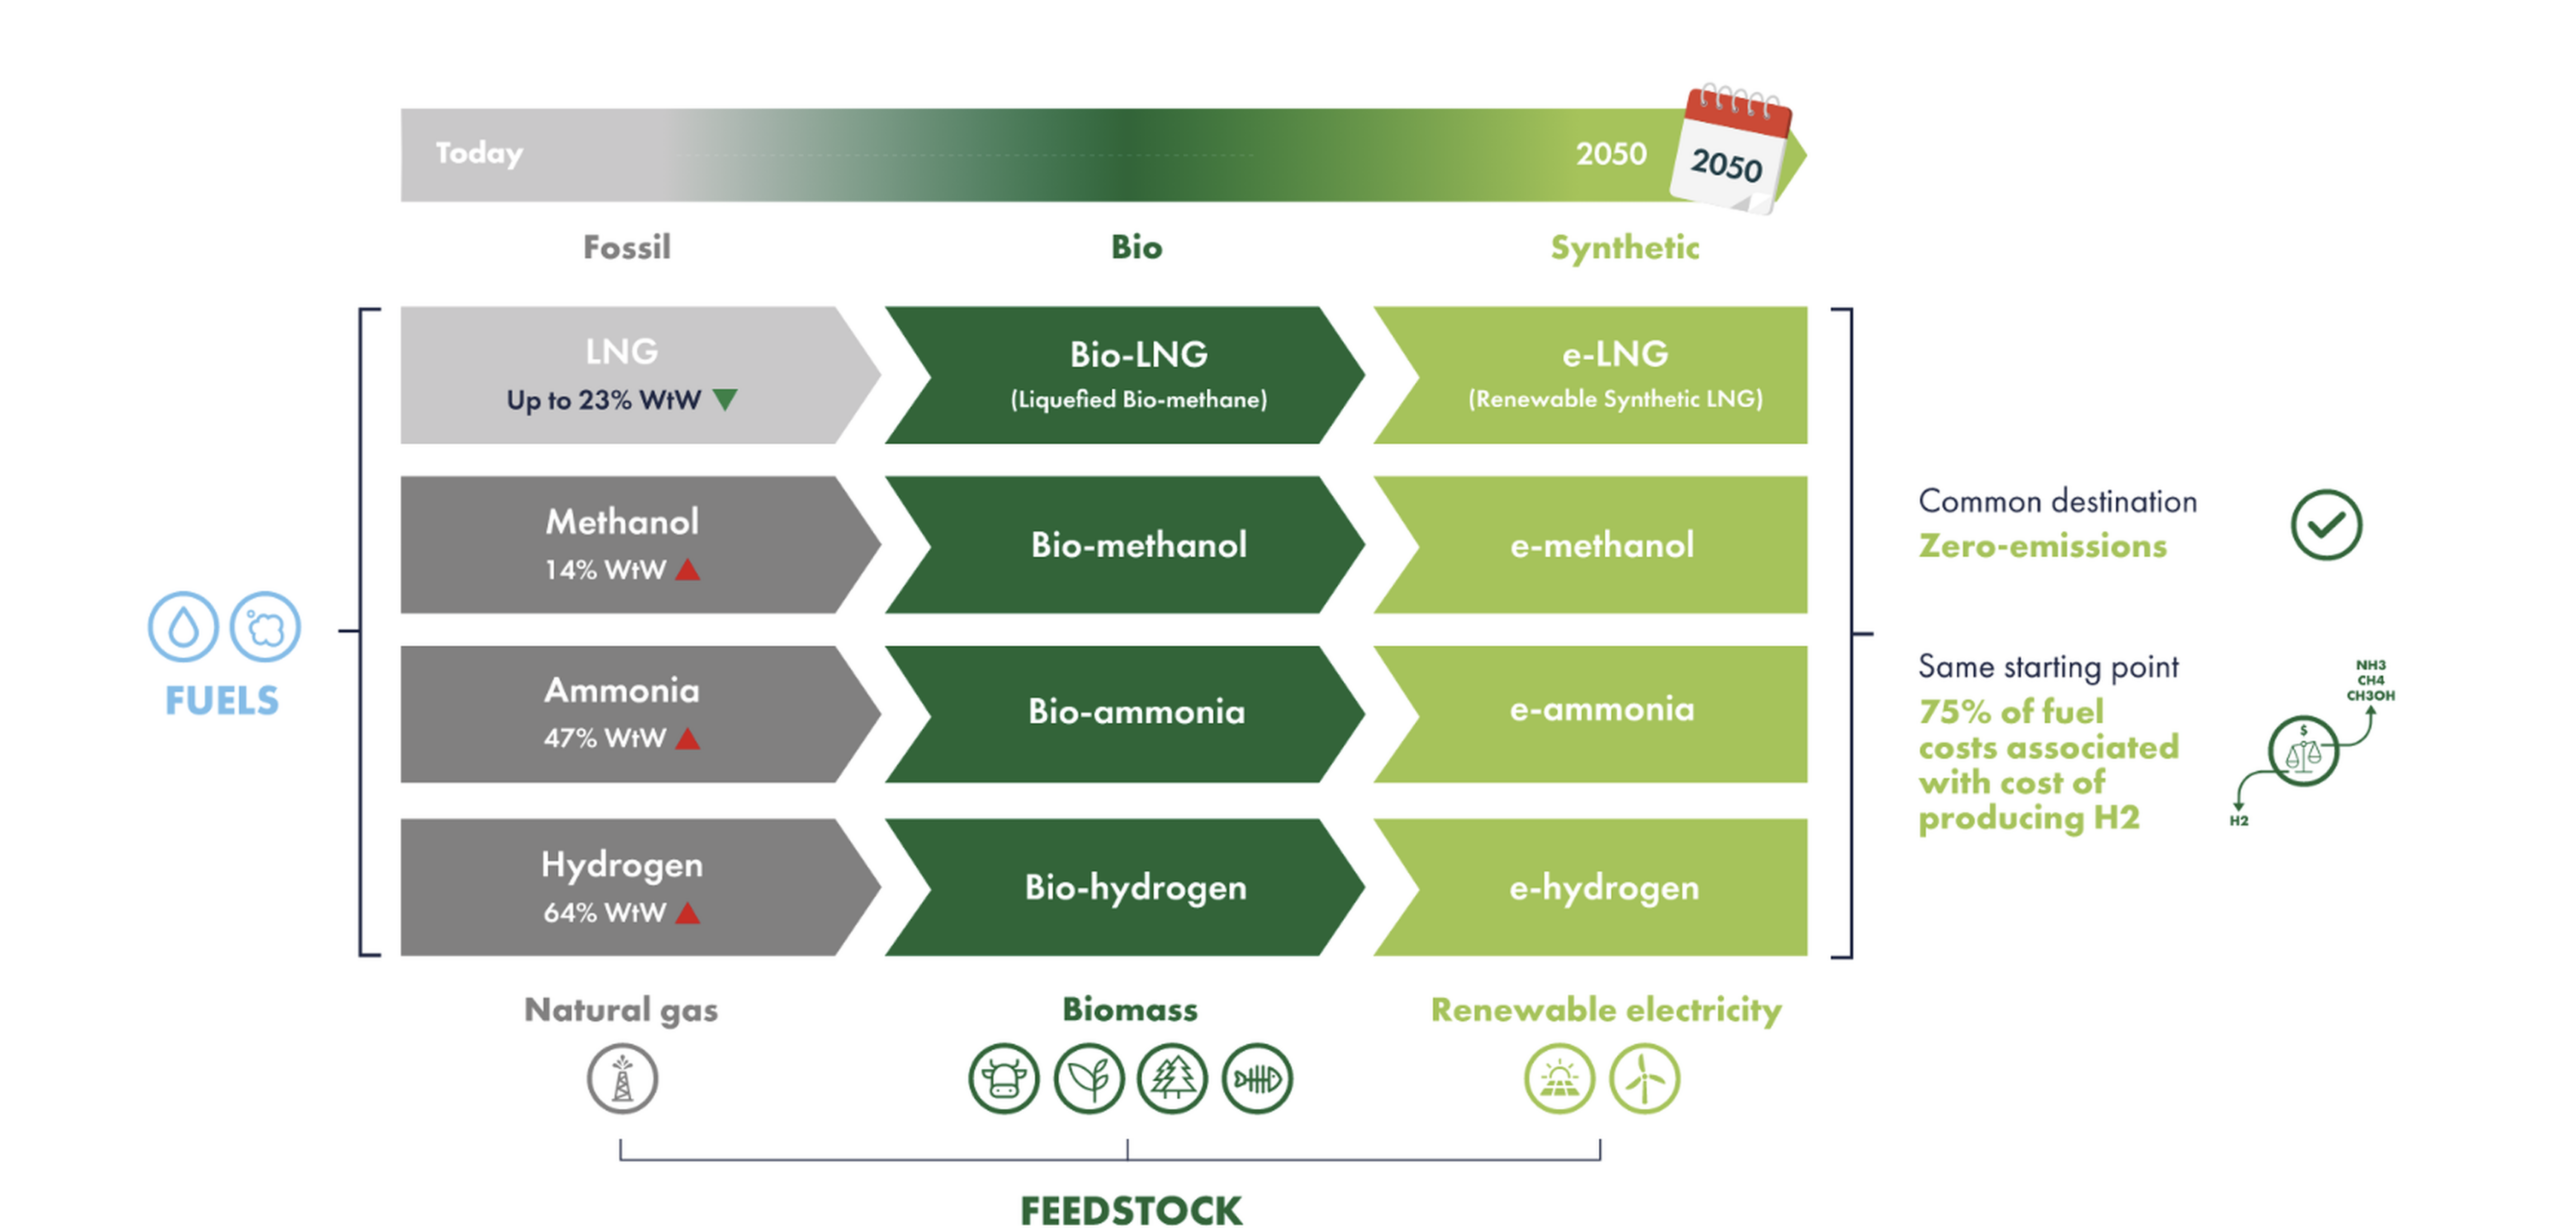
Figure 4 presents the decarbonization pathways available to each major alternative fuel by 2050 — that is, the successive production routes by which a given fuel can be manufactured at progressively lower emissions, moving from fossil-derived production through bio-based feedstocks to fully renewable synthetic routes. Each fuel is therefore not a single option but a family of pathways whose well-to-wake emissions depend on how it is produced. This is why the following sections assess each fuel by its production route within India rather than by the fuel alone.
Biomethane
Biogas is produced by anaerobic digestion of agricultural wastes and undergoes clean combustion to emit only Carbon Dioxide and water vapor25. Biomethane, however, is obtained via purification of the biogas to remove Carbon dioxide. In India, the agricultural sector is massive, thus obtaining raw materials wouldn’t be a problem. The IOC (Indian Oil Corporation) GPS Renewable Private Limited (IGRPL), for example, more often uses paddy straws as feedstock which are usually burned in the country. Thus, the process prevents useless GHG emissions79. Alternatively, rice husk, wheat husk and straw, sugarcane bagasse, cotton stalk, corn cob, maize stalk, millet straw and more are used for feedstock in the process26. This can easily be sourced from local farmers, ideally small and marginal farmers to improve their productivity. The purification of biomethane from biogas happens via four main techniques: water scrubbing, membrane separation, pressure swing adsorption, and chemical absorption to remove impurities. Water scrubbing refers to the compression of biogas that get passed through water for impurities to be absorbed80. Membrane separation uses a membrane to separate the biogas stream81. Pressure swing adsorption uses adsorbent materials that selectively capture CO₂ under high pressure, allowing purified methane to pass through. Chemical absorption uses chemical solvents, such as amines, to absorb CO₂ from the biogas82. After purification, the methane is compressed and kept in high pressure cylinders. Currently, in India, the gas is mixed with natural gas grids and distributed, however, in the future the grids could be replaced entirely by biomethane83.
In India, compressed biogas is procured by oil marketing companies under the SATAT scheme at a notified price of Rs46 per kg plus applicable taxes, which includes the costs of obtaining the waste, anaerobic digestion, transforming biogas to biomethane, compression and delivery to the retail outlet. This price applied from October 2018 to March 2024 and is subject to periodic revision from April 2024, though it cannot fall below Rs46 per kg until March 202984. However, the India Biogas Association currently demands that fixed price be raised to Rs90 per kg due to its environment significance85. At Rs46 per kg the fuel corresponds to roughly Rs0.9 per MJ, which is comparable to heavy fuel oil, whereas an increase to Rs90 per kg would raise this to about Rs1.8 per MJ and make the fuel considerably more expensive than the conventional alternative. Thus, cost of production must decrease, instead, allowing manufacturers to maintain hefty profits. This can happen via an increase in scale which will happen with the government target of 5,000 Compressed biogas plants by 203086. However, as of April 14, 2025, only 876 plants are active and operational in India, so the goal is quite ambitious. Additionally, most of the costs for Biogas come from the upfront capital investment so profits are bound to increase as time goes on. In terms of sustainability, the well-to-wake emissions of biomethane are extremely low and close to zero. It has around 83.7% decarbonization potential and its displacement of naturally occurring emissions of waste into productive uses makes it a viable alternative27. India’s large agricultural sector also makes this fuel viable in terms of the supply of feedstock. Thus, biomethane can be considered a sustainable and cost-effective alternative for the near future.
Hydrotreated Vegetable Oil (HVO)
HVO is produced when feedstocks like waste cooking oil or vegetable oils are combined with hydrogen at high temperatures and pressures to remove oxygen and other impurities, resulting in biodiesel. The CO2 emissions associated with it can come from the production of hydrogen depending on whether it’s green, blue or grey87. Well-to tank emissions of grey hydrogen are high; however, addition of carbon capture technologies offers a transition from grey to blue hydrogen, reducing well-to-tank emissions. The used cooking oils for production of the fuel can be obtained from the hospitality sector and through clean points where citizens deposit their used oil. The National Green Hydrogen Mission, targeting 5 million metric tons per annum (MMTPA) capacity of green hydrogen by 2030, will be required to obtain the hydrogen necessary to produce HVO and reduce well-to-tank emissions88.
HVO isn’t a readily available fuel in India, so costs will be high to bring it in as it requires large capital investment89. However, a common setback in terms of price in other regions is limited supply, but India’s large agricultural sector, particularly vegetable oils, being the biggest importer in the world for it, will greatly reduce this issue and keep prices low90. In terms of sustainability, HVO has 0.304kg of CO2 emissions for 1kg of HVO while producing (well-to-tank emissions), if used cooking oil is the feedstock, energy source is renewable and green hydrogen is used91. Such conditions are easily replicated in India and thus the well-to tank emissions are quite sustainable. In terms of Tank-to-wake emissions, around 0.24 kg of CO2 per 1kg of HVO is emitted when burned for usage92. This is also extremely sustainable and in total Well-to-Wake emissions pose 95% decarbonization potential93. Thus, HVO can be seen as a fuel to be implemented in the distant future when infrastructure catches up.
Liquified Natural Gas (LNG)
LNG production in India is greatly increasing via transportable modules for liquefaction. Natural gas in India is produced by drilling wells into underground rock formations, called reservoirs, to release gas. Most of India’s reserves are offshore. This extracted gas is then processed to separate its components from water vapor and other impurities94. The gas is compressed and then cooled by a propane refrigeration cycle, resulting in LNG95. Key locations for drilling onshore include Assam and Rajasthan whereas offshore locations include South Bassein fields94. In India, distribution of the fuel occurs via cryogenic trucks as pipelines are limited and mainly used for CNG, not LNG96. Currently, ports have the capacity to store LNG and under Harit Sagar guidelines are set to increase to all ports by 203097. As an intermediary fuel LNG is well placed from both a production and applicability standpoint.
In May 2025, India’s regulated domestic natural gas price was Rs568.67/MMBtu, or around Rs25.19 per kg. However, this is the administered price for domestically produced gas, not the price of imported LNG. As India imports a large share of its natural gas, the relevant price for bunkering is the delivered cost of imported LNG. This has averaged over USD 11/MMBtu compared to the domestic gas price of USD 6.5/MMBtu98. At USD 11/MMBtu the delivered cost is around Rs935/MMBtu or Rs 44 per kg. In other words, this is around Rs0.89 per MJ, against approximately Rs 0.52 per MJ for domestic gas. Thus, although domestic gas is inexpensive, the marginal cost of LNG for shipping is set by imports and is far closer to that of HFO than the domestic price alone would suggest99. However, this price can decrease further as currently India relies on Imports for natural gas, but the future could hold an increase in domestic natural gas production100. In terms of sustainability, approximately 12.57 to 27 g of CO2 is emitted per MJ when looking at Well-to-Tank emissions and a tank-to-wake carbon factor of 2.750 g of CO2 per g of fuel. Applying the method set out in Section 2.1, this corresponds to a well-to-wake reduction of between 10 and 26 per cent relative to the HFO baseline, before methane slip is accounted for, which is lower than the figure of up to 30 per cent often reported39. Thus, LNG is an immediate transition fuel for India101.
Ammonia
Ammonia in India is produced in 2 ways: Haber-Bosch method and the green ammonia route. The usual Haber-Bosch uses an iron catalyst to combine hydrogen and nitrogen at around 400-450°C and 15-25MPa. Hydrogen in this case is produced from methane steam reforming which has major GHG emissions. Nitrogen, however, is obtained via Air Separation Units which have no emissions. The green ammonia production process adds 2 major changes. Firstly, the conditions for the reaction are created via electricity from a renewable source such as solar or wind energy. Secondly, the hydrogen that is obtained is green hydrogen102. Green hydrogen will become easier to obtain with the National Green Hydrogen Mission mentioned earlier, so green ammonia production pathways will be more common88. States like Rajasthan, Gujarat, Tamil Nadu, Karnataka and especially Himachal Pradesh make significant progress in renewable energy production and will be ideal for providing electricity for Green Ammonia103. Ammonia distribution in India works via pipelines, rail and road transport networks that are fairly developed104.
Green ammonia in India costs between Rs50.75 to 55.75 per kg, a range established by the reverse auction conducted by the Solar Energy Corporation of India under the National Green Hydrogen Mission, which awarded thirteen green ammonia projects within this band105. The weighted average price from these auctions is below the five-year weighted average import price of grey ammonia, meaning green ammonia produced in India is now cost-competitive with the conventional imported product. On a mass basis this appears low, but ammonia’s specific energy density of approximately 18.6 MJ/kg means the energy-equivalent cost is roughly Rs 3.1 per MJ, around three times that of heavy fuel oil. This per-mass cost is supported by India’s SIGHT program that provides financial incentives for green hydrogen and electrolyzer manufacturing. Additionally, transporting ammonia is easy compared to other alternatives so the overall price is lower104. For reducing prices in the future, factors like scale, efficiency, renewable energy costs and government support must be tackled. Scale and efficiency are bound to increase with technological and financial advancements of the industry. Lower renewable energy costs are bound to happen especially with India at the forefront, supplying the cheapest solar power in the world106. Government policies like SIGHT are already in place and the future would hold more to be implemented. In terms of sustainability, green ammonia has zero Well-to-Tank emissions. However, in terms of Well-to-wake emissions, although CO2 won’t be released, Nitrous Oxide may be released if not properly managed by engine design and DeNOx (Selective Catalytic Reduction) systems106. Thus, with increases in technological maturity, Ammonia can be a fuel to be used in India in the distant future.
Nuclear
India has its own nuclear propulsion for military vessels in which they build their own Pressurized Heavy Water Reactors (PHWRs). However, this technology isn’t commercial, and no signs currently point towards it becoming commercial soon107. Such ships run on a compact nuclear reactor that is only refueled using uranium pellets108. This uranium is mined from its ore and leached via sulfuric acid to create a liquid uranium oxide. Then ammonia is used to extract the uranium from the solution, giving a yellow powder called yellowcake which is purified and turned into uranium hexafluoride gas. Centrifuges then spin to separate U-235 and U-238. The U-235 concentration is increased and then by addition of calcium turns back into its solid uranium oxide form. The solid form is heated and extruded into pellets109,110. Uranium can be found in Jharkhand, Andhra Pradesh and Meghalaya111. With sustainable mining practices and usage of green ammonia, well-to-tank emissions will be completely minimized, and the fuel becomes a great alternative for the future.
Nuclear fuel in India for propulsion isn’t used currently on a commercial scale. Thus, no price can currently be given for the specific ship building costs. However, forecasts suggest that pellets cost around $90-100 per pound of uranium which may seem expensive, but the energy provided makes it reasonable33,112. In terms of sustainability, nuclear propulsion has virtually zero emissions provided that the waste management, nuclear fuel cycle and energy efficiency have no flaws113. This is very much possible within India if engines are built properly and a closed fuel cycle is used. However, the lack of technological maturity makes this fuel a permanent alternative for the very distant future when safety regulations can be met.
Methanol
Traditional production of methanol in India used coal-to chemical processes where coal is turned to syngas, a hydrogen and carbon monoxide mixture and then via a certain catalytic process is converted to methanol114. This method has serious emissions due to the water-gas shift reaction that is used to adjust the hydrogen-carbon ratio for methanol production making it unsustainable115. However, India is working on developing a greener process in which captured carbon dioxide is reacted with hydrogen that is produced via green processes and under certain conditions like a catalyst of copper, zinc and aluminum oxides along with 210-270°C temperature and pressures of 1.5-5 MPa116. The national green hydrogen mission makes sourcing hydrogen easier and the introduction of carbon capture units in India will aid in sourcing carbon dioxide88. Methanol in India is distributed within India via a network of pipelines, tankers and trucks for chemical manufacturers and for transportation the same method can be applied117.
Methanol fuel in India costs around Rs45.3 per Liter or Rs58.08 per kg118. On a per-kilogram basis this is comparable to heavy fuel oil, but methanol’s specific energy density of approximately 19.9 MJ/kg gives an energy-equivalent cost of roughly Rs 2.9 per MJ, close to three times that of heavy fuel oil118. The fuel is expensive due to Import reliance on the middle east, linkage of the fuel to rising crude oil prices and current cost of production119,120. The cost of methanol production is high mainly due to high green hydrogen costs and capital/operational expenses121. The issue of green hydrogen can be mitigated via an increase in scale which can happen via the National Green Hydrogen Movement88. Capital/operational expenses will only be reduced in terms of margins by increasing scale. For sustainability, Well-to-Tank emissions of Methanol (when produced via coal to syngas methods) are around 90g of CO2 emissions per MJ which is considerably high122. Tank-to-Wake emissions, however, are 1.375 g of CO2 per g of fuel, the value adopted by the IMO, which isn’t too high122. If methanol uses renewable sources like biomass/renewable electricity, it has CO2 emission potential up to 95%123. Thus, methanol should be a transition fuel for coal methods and a permanent fuel in the future when using green methods.
Figure 5 consolidates Sections 4.1 to 4.6, tracing the best production pathway identified for each fuel from primary energy source through processing to the energy carrier delivered to the vessel and the on-board converter used.
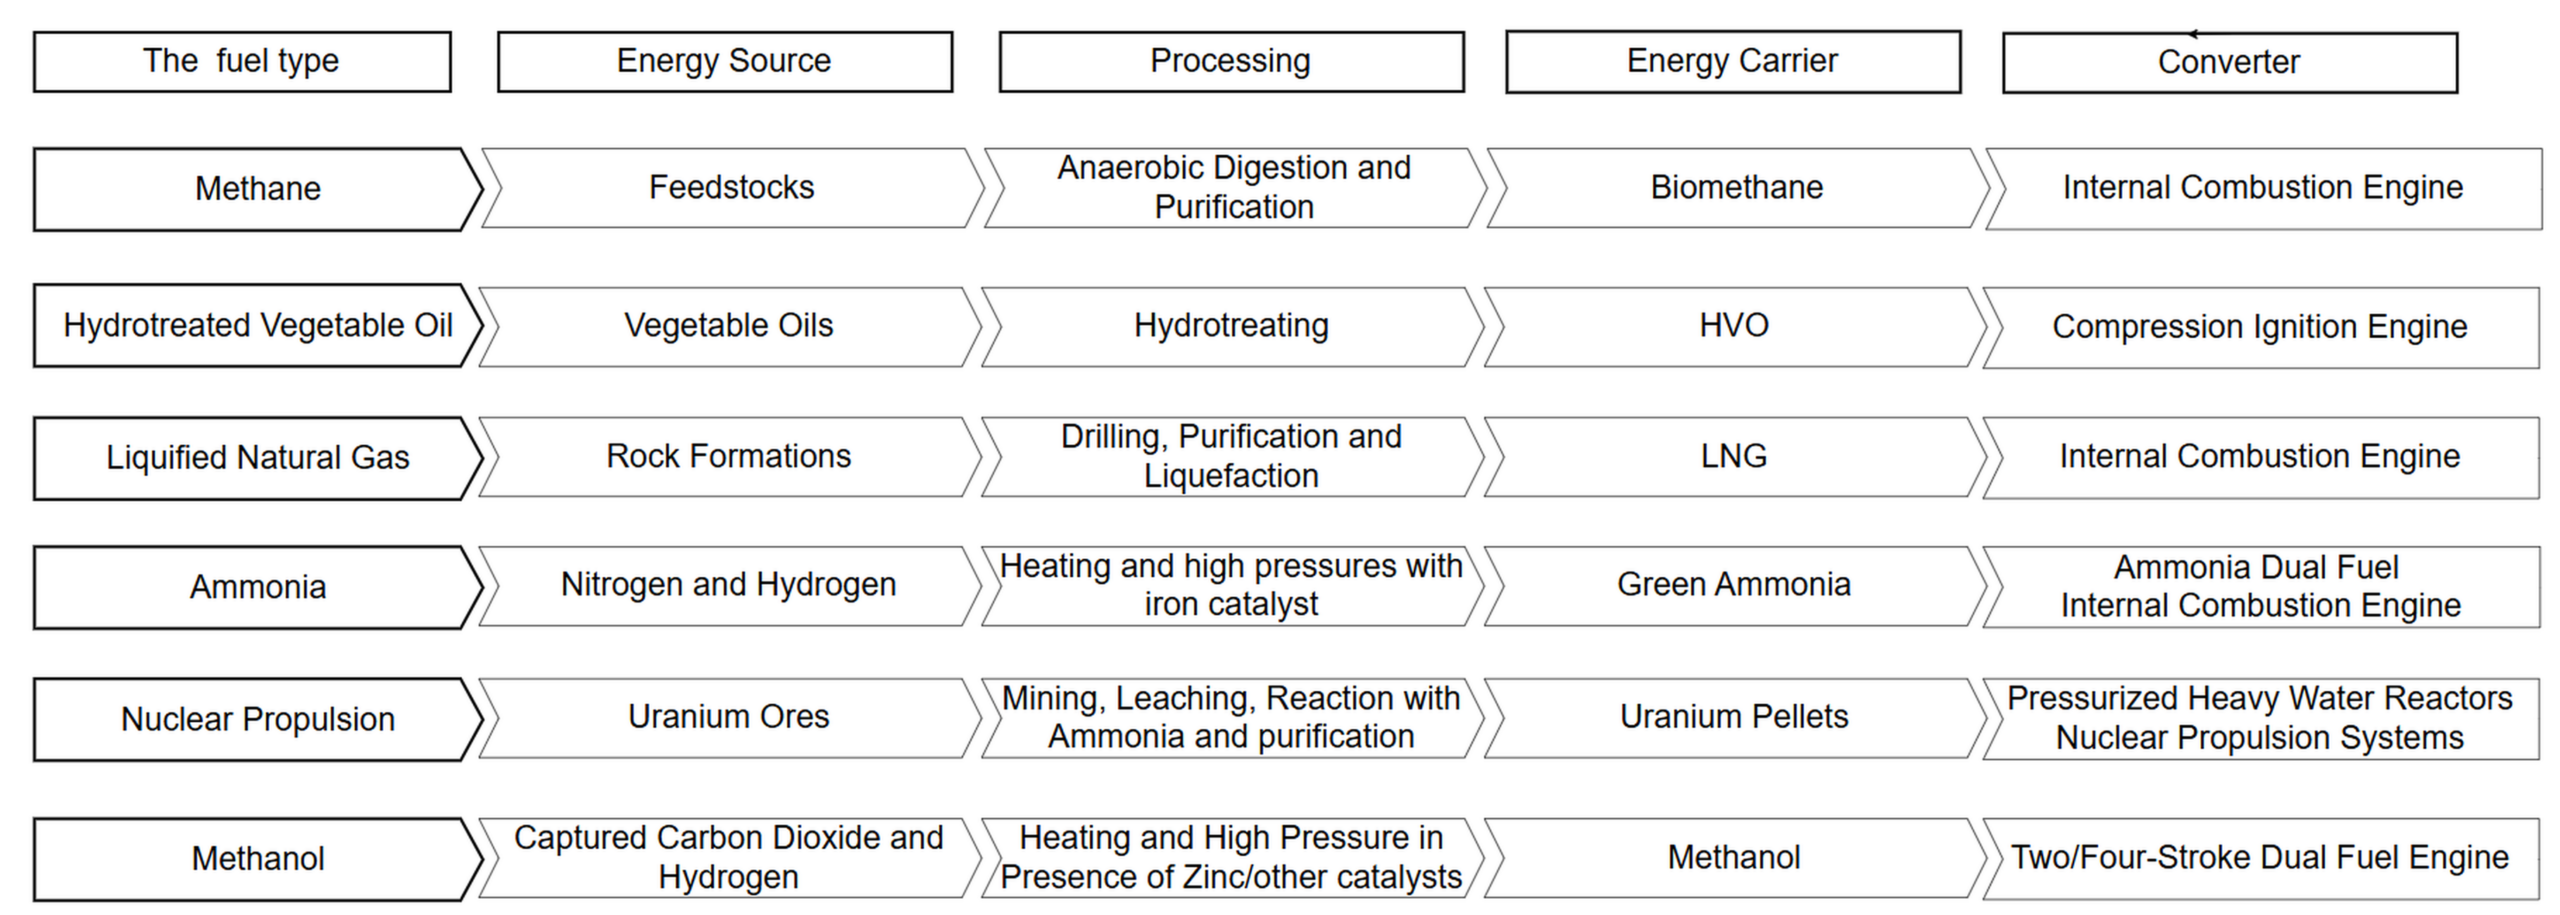
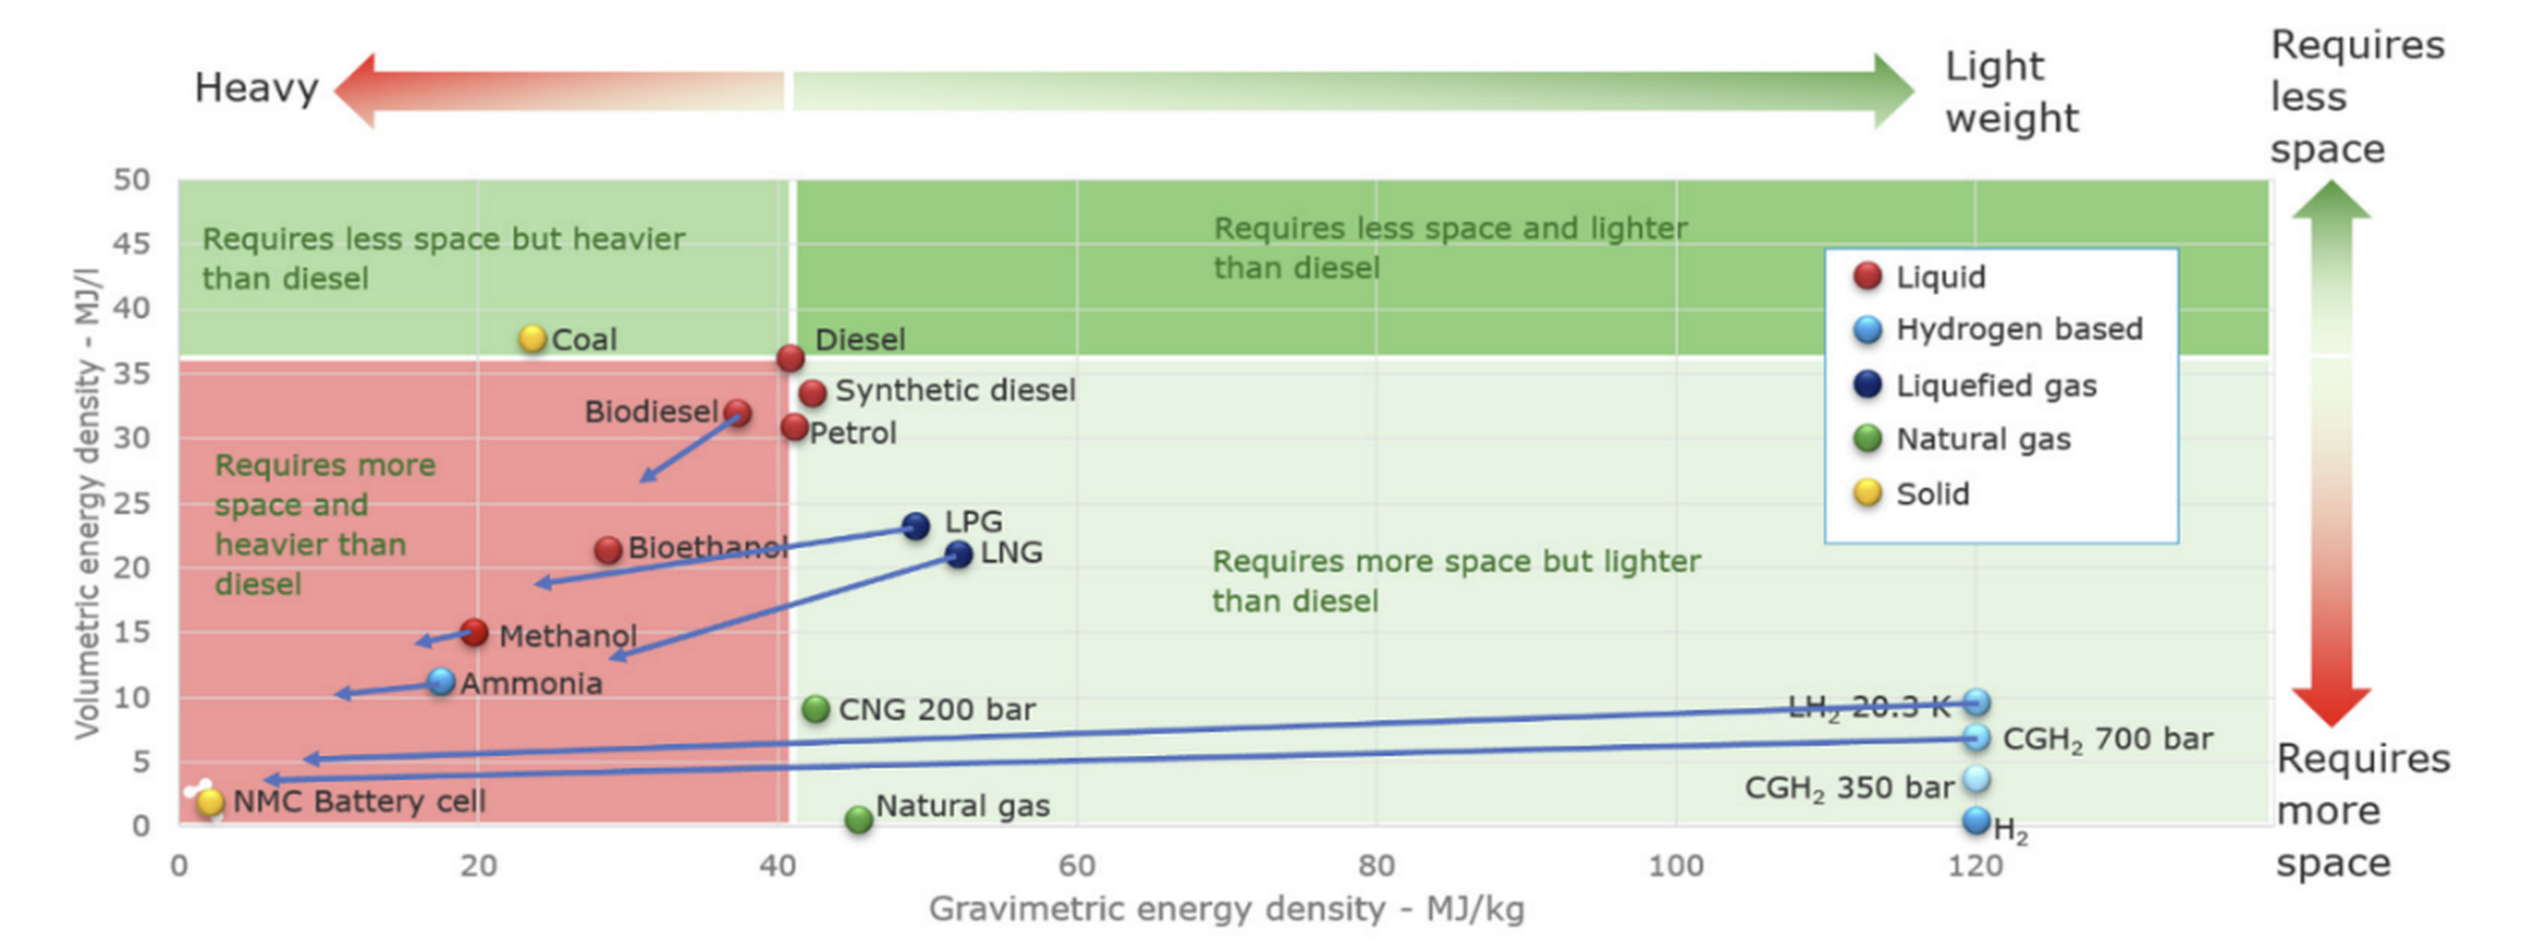
Figure 6 compares the gravimetric and volumetric energy densities of the fuels considered. The arrows indicate the effect of including the storage system in the comparison, which is the more operationally relevant measure, since storage penalties determine the cargo volume displaced by fuel on board.
India’s shipping decarbonization targets compare to other major countries or regions
India
India’s overarching goal is to reach net-zero emissions in shipping sector by 2050 in line with the IMO131. Their strategy seems to involve a change in fuels by starting with a transition fuel such as LNG and then eventually moving on to permanent fuel like ammonia, nuclear, methanol, etc.131. Current initiatives within the region include Maritime India Vision which provides a network for development of the region till 2030 including port development, increased shipbuilding, waterways expansion, green ports and improved safety132. Port development will be vital for adapting to modern technological requirements of ships (especially those running on alternative fuels)132. Additionally, increased shipbuilding will provide leeway for India to easily transition between fuels when the time comes132. In terms of green ports, renewable energy usage and waste management are the most important aspects along with air emission reduction which will happen by switching fuels. Another initiative is the great focus on green ammonia and hydrogen production132. Although hydrogen is a very expensive alternative fuel, it still has value in producing other fuels via green methods making its production necessary.
European Union
The EU has various initiatives that all relate to the Fuel EU Maritime proposal that makes it compulsory for ships to improve their GHG intensity of the energy used133. It applies to commercial vessels above 5000 GT133. The GHG reductions work in 5-year increments from -2% in 2025 to -6% in 2030, -13% in 2035, -26% in 2040, -59% in 2045 and -75% in 2050133. The shipping companies report specified voyage information as well as Well-to-Wake emissions and submit them to verifiers133. Companies that don’t comply are forced to pay penalties. However, leeway is given in the sense that companies can trade allowances for emissions among themselves (i.e. if a company has emissions left over for the time period, it can be sold via a particular contract to another company for them to use the allowance)133. This is called the Emissions Trading System (ETS). When travelling within the EU, all emissions are counted, but when travelling to and from the EU, only 50% are counted133. However, for the ‘phase in’ period (2023-2026) only a portion of emissions are counted, the percentage increasing every year133. The EU has also proposed a minimum tax rate as a part of the EU ETD based on energy content (EUR/GJ) on various fuels with the rate increasing for more polluting fuels133. In this regard, it seems that the EU has a significant advancement compared to India.
The United States of America
The US remains a member of the IMO but has stepped back from its greenhouse gas negotiations. It withdrew from the MEPC 83 negotiations in April 2025 and opposed the IMO Net-Zero Framework at the extraordinary MEPC session in October 2025, where adoption was adjourned for a year134. In March 2026, it submitted a position paper to the IMO calling for consideration of the Framework to be discontinued in favour of non-punitive measures134. At a federal level, the US hasn’t set a single decarbonization target for shipping. However, it has supported legislation like the proposed clean shipping Act which would implement a carbon intensity standard for fuels, aiming to reduce emissions by 30% by 2030, 58% by 2034, 83% by 2040, 92% by 2045, and 100% by 2050135. Additionally, the white house has supported Project Climate Action which aims to create a sustainable transportation sector, unofficially hinting at the idea of decarbonization136. Another legislation known as the International Maritime Pollution Accountability Act aims to impose a pollution fee on large marine vessels to finance decarbonization initiatives within the US136. Thus, India has set an explicit decarbonization target for its shipping sector, whereas US policy remains at the level of proposed legislation.
Japan
Japan has the goal for net-zero emissions in shipping by 2050, just like the IMO137. It has many initiatives, namely the Shipping Zero Emission project created by the Ministry of Land, Infrastructure, Transport and Tourism (MLIT) which aims to achieve decarbonization in international shipping by a 40% reduction in carbon intensity by 2030 and a 50% reduction in total GHG emissions by 2050137. The Carbon Neutral Ports initiative by the MLIT aims to have all ports become carbon neutral by 2050, including low-emission equipment and zero-emission fuels137,138. Japan’s focus seems to be leaning towards clean fuel as well as vessel design/technology (to maintain a fleet that adapts to these changes)138. In this sense, Japan seems to be slightly ahead of India with its goals.
Conclusion
This paper aims to identify which fuels would be the most cost-effective and sustainable for India to develop their shipping sector and reach their decarbonization goals. This paper reviewed various literatures and answered the objectives of what fuels are available; how sustainable and cost-effective are such fuels from both a production and usage point of view within India’s shipping sector; how does India’s decarbonization goals compare to other major countries. The findings of this paper have many policy implications for India, which are as follows:
- India may encourage LNG as a transition fuel, due to its existing import and bunkering infrastructure, its technological maturity and its compatibility with biomethane, and ships should build their engines and storage units around that. Its cost advantage over HFO is limited once the delivered price of imported LNG is used rather than the domestic gas price, so the case for LNG rests on readiness rather than on price. After this they can switch to biomethane which acts as a drop-in fuel for the same engine while reducing emissions significantly. As biomethane is a drop-in fuel for LNG ships, it has no conversion cost, and performs well on both sustainability and cost (lower price per unit of energy and lower well-to-wake emissions), making it a suitable final alternative.
- India should encourage HVO production directly and the conversion of diesel vessels to support storage of the fuel. HVO is a drop-in fuel for diesel engines, and it also performed very well in terms of the costs and sustainability assessment, thus it may be a great option for decarbonization.
- India should introduce a similar proposal to the Fuel EU to ensure decarbonization of shipping by the private sector. Additionally, introducing a trading system like the ETS would make the system profitable for some and easier to adapt to for others. As a failsafe mechanism, introducing a similar proposal to the ETD would ensure the sector decarbonizes itself, but it would be recommended that complete subsidies be provided for net-zero emitting fuels. Therefore, this paper recommends that India follow the EU’s system, as the EU has advanced goals and effective mechanisms.
- Finally, a growing number of alternative-fuel-capable ships will not by itself deliver a proportional reduction in emissions. Production routes also play an important role in determining decarbonization potential as evident with methanol. Thus, green methods are a must for fuels like methanol and in this case, methane. Additionally, the rate of fleet renewal has major significance and retrofitting these existing vessels or building new fuel-ready fleets is a necessary step in achieving the transition. Port infrastructure can also have a major role and updating this infrastructure is vital in the success of all other measures.
Thus, decarbonizing India’s shipping sector requires more than a change of fuel. The most effective approach combines a phased fuel transition, beginning with LNG and moving to biomethane and HVO, with operational measures applied to the existing fleet, investment in bunkering infrastructure at major ports, and a regulatory framework that makes low-emission fuel commercially viable. No single one of these is sufficient on its own.
References
- Miola A, Ciuffo B. Estimating air emissions from ships: Meta-analysis of modelling approaches and available data sources. Atmos Environ. 2011;45(13):2242-2251. doi:10.1016/j.atmosenv.2011.01.046 [↩]
- A.P. Moller – Maersk. Maersk sets net zero CO₂ emission target by 2050. Maersk. December 4, 2018:1-1. [↩]
- Energy Technology Perspectives 2017 : Catalysing Energy Technology Transformations. IEA; 2017. [↩]
- World Resources Institute (WRI). CAIT – Historical Emissions Data. WRI. WRI. Preprint posted online 2017. [↩]
- Luo X, Wang M. Study of solvent-based carbon capture for cargo ships through process modelling and simulation. Appl Energy. 2017;195:402-413. doi:10.1016/j.apenergy.2017.03.027 [↩]
- International Maritime Organization (IMO). Adoption of the initial IMO strategy on reduction of GHG emissions from ships and existing IMO activity related to reducing GHG emissions in the shipping sector. Note to the UNFCCC Talanoa Dialogue. International Maritime Organization (IMO). International Maritime Organization (IMO). Preprint posted online 2018. [↩]
- United Nations Conference on Trade and Development (UNCTAD). Review of Maritime Transport 2017. 2017. [↩]
- International Bunker Industry Association (IBIA). Test data for 2017 show limited share of low sulphur residual fuels. IBIA. 2018. [↩]
- Lowell D WHLN. Assessment of the Fuel Cycle Impact of Liquefied Natural Gas as Used in International Shipping. 2013. [↩]
- United Nations Framework Convention on Climate Change (UNFCCC). The Paris Agreement. 2015. [↩]
- Institute and Faculty of Actuaries. India: The Road to Net Zero by 2070. IFoA Blog. 2021. [↩]
- Ministry of Ports S and W (MoPSW). Maritime India Vision 2030. 2021. [↩] [↩]
- Prakash A. Shipbuilding Is Our Maritime Sector’s ‘Missed Opportunity’. It Needs Its Own Ministry. ThePrint. July 23, 2021. [↩] [↩]
- Directorate General of Shipping (India). D.G Shipping-INMARCO Green Shipping Conclave. 2022. [↩] [↩]
- thinkstep AG. 2nd Life Cycle GHG Emission Study on the Use of LNG as Marine Fuel (Executive Summary). 2021. [↩] [↩] [↩] [↩]
- Anders J. Comparison of Alternative Marine Fuels SEA\LNG Ltd. Published online July 5, 2019. www.dnvgl.com [↩] [↩] [↩] [↩] [↩] [↩] [↩]
- Manias P, McKinlay C, Teagle DAH, Hudson D, Turnock S. A wind-to-wake approach for selecting future marine fuels and powertrains. Int J Hydrogen Energy. 2024;82:1039-1050. doi:10.1016/j.ijhydene.2024.07.377 [↩] [↩] [↩]
- Cheng Y, Zhang J, Lu S, Jiang SP. Significantly enhanced performance of direct methanol fuel cells at elevated temperatures. J Power Sources. 2020;450:227620. doi:10.1016/j.jpowsour.2019.227620 [↩]
- ICF International. How e-methanol can enable the hydrogen economy while adding value to captured carbon. ICF International Insights. February 22, 2023. [↩] [↩]
- Hieminga G, Luman R. Synthetic Fuels Could Be the Answer to Shipping’s Net-Zero Goals, but Don’t Count on Them yet. 2023. [↩] [↩] [↩]
- Lloyd’s Register, UMAS. Zero-Emission Vessels 2030: How Do We Get There? 2018. [↩] [↩] [↩] [↩]
- Bortel I, Vávra J, Takáts M. Effect of HVO fuel mixtures on emissions and performance of a passenger car size diesel engine. Renew Energy. 2019;140:680-691. doi:10.1016/j.renene.2019.03.067 [↩]
- Jekayinfa S, Adebayo A, Sulaiman MA, Ayoola V. PREDICTION OF DENSITY AND VISCOSITY OF BIODIESEL FUEL FROM FATTY ACID METHYL ESTER (FAME) COMPOSITION. 2019;15(3):519-534. www.azojete.com.ng [↩]
- Curran S, Onorati A, Payri R, et al. The future of ship engines – Renewable fuels and enabling technologies for decarbonization. International Journal of Engine Research. 2024;25(1):85-110. doi:10.1177/14680874231187954 [↩]
- Dey A, Thomson RC. India’s biomethane generation potential from wastes and the corresponding greenhouse gas emissions abatement possibilities under three end use scenarios: electricity generation, cooking, and road transport applications. Sustain Energy Fuels. 2023;7(1):209-241. doi:10.1039/D2SE01028C [↩] [↩]
- Kulkarni A, Shastri Y, Kumar M. Compressed biogas production from agricultural residues in India: A techno-enviro-economic overview. Renewable and Sustainable Energy Reviews. 2025;219:115888. doi:10.1016/j.rser.2025.115888 [↩] [↩]
- Adams PWR, McManus MC. Characterisation and variability of greenhouse gas emissions from biomethane production via anaerobic digestion of maize. J Clean Prod. 2019;218:529-542. doi:10.1016/j.jclepro.2018.12.232 [↩] [↩] [↩]
- Panigrahi P, Desai M, Talari MK, et al. Selective decoration of nitrogenated holey graphene (C2N) with titanium clusters for enhanced hydrogen storage application. Int J Hydrogen Energy. 2021;46(10):7371-7380. doi:10.1016/j.ijhydene.2020.11.222 [↩]
- Thandasherry. Sandith, R. SR. Economic of ADITYA – India’s First Solar Ferry. IEEE. 2018;13(3). [↩]
- Wang R, Li G, Ming M, Wu G, Wang L. An efficient multi-objective model and algorithm for sizing a stand-alone hybrid renewable energy system. Energy. 2017;141:2288-2299. doi:10.1016/j.energy.2017.11.085 [↩]
- Wang Q, Zhang H, Zhu P. Using Nuclear Energy for Maritime Decarbonization and Related Environmental Challenges: Existing Regulatory Shortcomings and Improvements. Int J Environ Res Public Health. 2023;20(4). doi:10.3390/ijerph20042993 [↩] [↩] [↩]
- Schøyen H, Steger-Jensen K. Nuclear propulsion in ocean merchant shipping: The role of historical experiments to gain insight into possible future applications. J Clean Prod. 2017;169:152-160. doi:10.1016/j.jclepro.2017.05.163 [↩] [↩]
- Australian Nuclear Science and Technology Organization. Nuclear propulsion systems. ANSTO. [↩] [↩] [↩] [↩]
- Bhattacharyya R, El-Emam RS, Khalid F. Climate action for the shipping industry: Some perspectives on the role of nuclear power in maritime decarbonization. e-Prime – Advances in Electrical Engineering, Electronics and Energy. 2023;4:100132. doi:10.1016/j.prime.2023.100132 [↩] [↩]
- MAN Energy Solutions. Ammonia – Decarbonization Glossary. MAN Energy Solutions. [↩]
- Wang W, Liu Y, Shi C, Pan L, Zhang X, Zou JJ. High energy density renewable fuels based on multicyclic sesquiterpene: Synthesis and performance. Fuel. 2022;318:123665. doi:10.1016/j.fuel.2022.123665 [↩] [↩]
- Layton BE. A Comparison of Energy Densities of Prevalent Energy Sources in Units of Joules Per Cubic Meter. Int J Green Energy. 2008;5(6):438-455. doi:10.1080/15435070802498036 [↩] [↩]
- Kamarajar Port Limited. Korkai Newsletter. Kamarajar Port Limited. 2021. [↩] [↩]
- Ilic G. Guide: How to Calculate GHG Intensity under FuelEU Maritime. BetterSea. October 7, 2024. [↩] [↩]
- International Maritime Organization. Resolution MEPC.308(73): 2018 Guidelines on the Method of Calculation of the Attained Energy Efficiency Design Index (EEDI) for New Ships. 2018. [↩]
- Bains P et al. Global Hydrogen Review 2023. 2023. [↩]
- U.S. Department of Energy. Hydrogen Production Processes. U.S. Department of Energy. 2025. [↩]
- Vuppaladadiyam AK, Vuppaladadiyam SSV, Awasthi A, et al. Biomass pyrolysis: A review on recent advancements and green hydrogen production. Bioresour Technol. 2022;364:128087. doi:10.1016/j.biortech.2022.128087 [↩]
- Lin SY, Suzuki Y, Hatano H, Harada M. Developing an innovative method, HyPr-RING, to produce hydrogen from hydrocarbons. Energy Convers Manag. 2002;43(9-12):1283-1290. doi:10.1016/S0196-8904(02)00014-6 [↩]
- Sharma V, Panesar A, de Sercey G, Begg S. A Review of Ammonia Combustion and Emissions Characteristics in Spark-Ignition Engines and Future Road Map. Energies (Basel). 2024;18(1):41. doi:10.3390/en18010041 [↩]
- Yip HL, Srna A, Yuen ACY, et al. A Review of Hydrogen Direct Injection for Internal Combustion Engines: Towards Carbon-Free Combustion. Applied Sciences. 2019;9(22):4842. doi:10.3390/app9224842 [↩]
- International Transport Forum (ITF). Decarbonising Maritime Transport: Pathways to Zero-Carbon Shipping by 2035. 2018. [↩] [↩] [↩] [↩] [↩] [↩]
- Englert D, Losos A, Raucci C, Fricaudet M, Smith T. The Potential of Zero-Carbon Bunker Fuels in Developing Countries. World Bank, Washington, DC; 2021. doi:10.1596/35435 [↩]
- Curran S, Onorati A, Payri R, et al. The future of ship engines: Renewable fuels and enabling technologies for decarbonization. International Journal of Engine Research. 2024;25(1):85-110. doi:10.1177/14680874231187954. [↩]
- Vasan V, Sridharan NV, Feroskhan M, et al. Biogas production and its utilization in internal combustion engines – A review. Process Safety and Environmental Protection. 2024;186:518-539. doi:10.1016/j.psep.2024.04.014 [↩]
- Curran S, Onorati A, Payri R, et al. The future of ship engines: Renewable fuels and enabling technologies for decarbonization. International Journal of Engine Research. 2024;25(1):85-110. doi:10.1177/14680874231187954 [↩] [↩]
- Tripathi G, Dhar A. Performance, emissions, and combustion characteristics of methane-diesel dual-fuel engines: A review. Frontiers in Thermal Engineering. 2022;2. doi:10.3389/fther.2022.870077 [↩]
- Ushakov S, Lefebvre N. Assessment of Hydrotreated Vegetable Oil (HVO) Applicability as an Alternative Marine Fuel Based on Its Performance and Emissions Characteristics. SAE Int J Fuels Lubr. 2019;12(2):04-12-02-0007. doi:10.4271/04-12-02-0007 [↩]
- Di Blasio G, Ianniello R, Beatrice C. Hydrotreated vegetable oil as enabler for high-efficient and ultra-low emission vehicles in the view of 2030 targets. Fuel. 2022;310:122206. doi:10.1016/j.fuel.2021.122206 [↩]
- Agarwala N. Is LNG the solution for decarbonised shipping? Journal of International Maritime Safety, Environmental Affairs, and Shipping. 2022;6(4):158-166. doi:10.1080/25725084.2022.2142428 [↩]
- Demirbas A. Fuel Properties of Hydrogen, Liquefied Petroleum Gas (LPG), and Compressed Natural Gas (CNG) for Transportation. Energy Sources. 2002;24(7):601-610. doi:10.1080/00908312.2002.11877434 [↩]
- DNV. LPG carriers stepping up to the decarbonization challenge. DNV. 2021. [↩]
- U.S. Department of Energy AFDC. Methanol (Alternative Fuel). U.S. Department of Energy. [↩]
- International Journal of Scientific Research and Technology. Indian Shipping Industry: Vital for The India Story. IJSRT. [↩] [↩]
- Ministry of Ports Shipping & Waterways. India Ramps Up Shipbuilding Capability to Realise PM Modi’s Vision of Viksit Bharat. Press Information Bureau. August 1, 2025. [↩]
- Dr. A.Mourougane. Present Scenario of Ship Building Industry in Indian. Journal of Development Economics and Management Research Studies. 2020;6(6):29-38. [↩] [↩]
- India Brand Equity Foundation, Ministry of Commerce and Industry (Government of India). India’s Container Traffic Boom: Implications for Trade and Economy. IBEF. April 25, 2025. [↩]
- Government of India. India. Government of India. [↩]
- Government of India. Sagarmala Project Update. [↩]
- Indian Ports Association. Operating Performance Profile. Indian Ports Association. [↩]
- Indian Ports Association. Port Performance 2021–22. 2022. [↩]
- Ministry of Ports S and W. Annual Report 2021-2022. 2022. [↩]
- Kamarajar Port Limited. Performance Indicators. [↩]
- New Mangalore Port Authority (NMPA). New Mangalore Port: Performance Highlights. [↩]
- Department of Commerce M of C& I. PIB Release — India’s Foreign Trade Highlights (July 2025). Press Information Bureau (Government of India). August 12, 2025. [↩]
- Gupta S. India Achieves Record-Breaking Cargo Movement in Inland Water Transport. Angel One . April 25, 2025. [↩]
- Ship & Bunker News Team. Southern Indian Port Takes Lead in Methanol Bunkering Push. Ship & Bunker News Team. March 3, 2025. [↩]
- Petroleum & Natural Gas Regulatory Board. City Gas Distribution and Pipeline Network. Petroleum & Natural Gas Regulatory Board. 2023. [↩]
- GAIL (India) Limited. Pradhan Mantri Urja Ganga Project. 2022. [↩]
- International Energy Agency. India Gas Market Report: Outlook to 2030. 2025. [↩]
- Indo-German Energy Forum. Market Study & Location Assessment for Green Ammonia Production in India. 2023. [↩]
- Prpić-Oršić J, Vettor R, Faltinsen OM, Guedes Soares C. The influence of route choice and operating conditions on fuel consumption and CO2 emission of ships. J Mar Sci Technol. 2016;21(3):434-457. doi:10.1007/s00773-015-0367-5 [↩]
- SEA-LNG. Compare apples with apples to cut emissions and costs. SEA-LNG. July 2022. [↩]
- Argus Media. Japan’s Sojitz to enter biomethane production in India. Argus Media. April 3, 2025. [↩]
- Tuset S. Biogas Purification, Enrichment and Utilization. Condorchem Enviro Solutions. [↩]
- Hasan MM, Álvarez JFG, Kim J, Othman MR. Biomethane purification from biogas by methane selective membrane: Effects of different biofuel grades on electricity generation from natural gas turbine. Process Safety and Environmental Protection. 2025;198:107161. doi:10.1016/j.psep.2025.107161 [↩]
- Adnan AI, Ong MY, Nomanbhay S, Chew KW, Show PL. Technologies for Biogas Upgrading to Biomethane: A Review. Bioengineering. 2019;6(4):92. doi:10.3390/bioengineering6040092 [↩]
- TotalEnergies Gas Mobility. CNG & bioCNG. TotalEnergies. [↩]
- Indian Oil Corporation Limited. Compendium of Frequently Asked Questions on Compressed Bio Gas (CBG) and the SATAT Scheme. 2026. [↩]
- Press Trust of India. Indian Biogas Association demands Rs 90 per kg fixed rate for procurement of compressed biogas. The Economic Times. June 16, 2024. [↩] [↩]
- Mittal S, Ahlgren EO, Shukla PR. Barriers to biogas dissemination in India: A review. Energy Policy. 2018;112:361-370. doi:10.1016/j.enpol.2017.10.027 [↩] [↩]
- Perkins. Unlocking Flexibility in Fuel Choices: A Detailed Comparison of HVO and Diesel. Perkins (Caterpillar Inc.). [↩] [↩]
- Ministry of New and Renewable Energy. National Green Hydrogen Mission. 2023. [↩] [↩] [↩] [↩] [↩]
- Squadrin G. NWE HVO, SAF at records on feedstocks prices, demand. Argus Media. June 1, 2021. [↩] [↩]
- Minton L, Koh R. India’s vegetable oil imports to hit 14 million tonnes in 2022-23. Fastmarkets. September 27, 2022. [↩] [↩]
- Ajeeb W, Gomes DM, Neto RC, Baptista P. Life cycle analysis of hydrotreated vegetable oils production based on green hydrogen and used cooking oils. Fuel. 2025;390:134749. doi:10.1016/j.fuel.2025.134749 [↩] [↩]
- Hydrotreated Vegetable Oil (HVO) Fuel-Briefing. [↩]
- Inpro Group. Advantages of HVO Compared to Conventional Diesel and B100. Inpro Group. 2025. [↩]
- U.S. Energy Information Administration. Country Analysis Brief: India. 2025. [↩] [↩] [↩]
- Galileo Technologies. CryoboxTM LNG Production Station. Galileo Technologies. 2025. [↩] [↩]
- GlobalData Strategic Intelligence. India’s ONGC plans to establish mini-LNG plants for stranded gas. Offshore-Technology.com. 2024. [↩] [↩]
- Ministry of Ports S& W. Harit Sagar – Green Port Guidelines 2023. 2023. [↩] [↩]
- Jain P, Reynolds S. A Bridge to Nowhere: Economic Reality Check for LNG as a Transition Fuel in India. 2025. [↩]
- Ghosh. Rituparna. India lowers domestic natural gas price in March. Argus Media. April 3, 2025. [↩]
- Quadros J. Industrial demand, shrinking production fuel rise in Indian LNG import. Wood Mackenzie. 2025. [↩]
- Ejder E, Dinçer S, Arslanoglu Y. Decarbonization strategies in the maritime industry: An analysis of dual-fuel engine performance and the carbon intensity indicator. Renewable and Sustainable Energy Reviews. 2024;200:114587. doi:10.1016/j.rser.2024.114587 [↩]
- Partner Nayantara Nag, Counsel Ipshita Ahuja. Green Ammonia Production in India. Norton Rose Fulbright. January 2025. [↩] [↩]
- Sansad TV. In-Depth: India’s Renewable Energy Capacity. Published online March 2, 2025. [↩] [↩]
- Pawar ND, Heinrichs HU, Winkler C, et al. Potential of green ammonia production in India. Int J Hydrogen Energy. 2021;46(54):27247-27267. doi:10.1016/j.ijhydene.2021.05.203 [↩] [↩]
- Press Information Bureau G of I. SECI Conducts First-Ever Auction for Procurement of Green Ammonia under National Green Hydrogen Mission. 2025. [↩]
- Wood J. India is now producing the world’s cheapest solar power. World Economic Forum. 2019. [↩] [↩]
- Wang Q, Zhang H, Zhu P. Using Nuclear Energy for Maritime Decarbonization and Related Environmental Challenges: Existing Regulatory Shortcomings and Improvements. Int J Environ Res Public Health. 2023;20(4):2993. doi:10.3390/ijerph20042993 [↩]
- Emirates Nuclear Energy Corporation. Fueling the Barakah Nuclear Energy Plant. [↩] [↩]
- U.S. Nuclear Regulatory Commission. Fuel Cycle Facilities. U.S. Nuclear Regulatory Commission. [↩] [↩]
- Nuclear Energy Institute. Nuclear Fuel. Nuclear Energy Institute. [↩] [↩]
- Gupta R, Sarangi AK. Emerging Trend of Uranium Mining: The Indian Scenario. In: IAEA Symposium on “Uranium Production and Raw Materials for the Nuclear Fuel Cycle – Supply and Demand, Economics, the Environment and Energy Security.” Uranium Corporation of India Ltd; 2005. [↩] [↩]
- Mirkhusanov UT, Semenova DYu, Kharitonov V V. Forecasting the cost and volume of uranium mining for different world nuclear energy development scenarios. Nuclear Energy and Technology. 2024;10(2):131-137. doi:10.3897/nucet.10.130485 [↩]
- Safety4Sea. Exploring Nuclear as an Option for the Maritime Industry. Safety4Sea. July 15, 2024. [↩]
- Pandey S, Srivastava VC, Kumar V. Comparative assessment of different grades of coal for methanol production: Simulation, optimization, environmental and economic analysis. Energy. 2023;284:129146. doi:10.1016/j.energy.2023.129146. [↩]
- Wang D, Meng W, Zhou H, et al. Novel coal-to-methanol process with near-zero carbon emission: Pulverized coal gasification-integrated green hydrogen process. J Clean Prod. 2022;339:130500. doi:10.1016/j.jclepro.2022.130500 [↩] [↩]
- Srikanth J, Dr. Sakthivel. Green Methanol: A Sustainable Future. Tata Consulting Engineers. October 15, 2024. [↩] [↩]
- Argus Media. India methanol touches four-year low on lockdown. April 3, 2020. [↩] [↩]
- A S Chemicals. Methyl Alcohol Liquid. A S Chemicals. 2025. [↩] [↩]
- Argus Media. India methanol touches four-year low on lockdown. Argus Media. April 3, 2020. [↩]
- Argus Media. India seeks methanol, DME output from three plant. Argus Media. February 6, 2024. [↩]
- Dr. NS S, NC T. A Methanol Makeover for India: Opportunities & Challenges. Energy Watch. February 25, 2025. [↩]
- Wärtsilä. Methanol as marine fuel – is it the solution you are looking for? Wärtsilä. February 20, 2023. [↩] [↩]
- PEPR Spleen. E-methanol: A Decarbonisation Vector in the Chemical Industry. PEPR Spleen. April 8, 2025. [↩]
- Mohd Tamam MQ, Dansoh C, Panesar A. The roadmap to carbon neutrality for the maritime industry: an insight into various routes to decarbonise ship engines. Energy Conversion and Management: X. 2025;27:101184. doi:10.1016/j.ecmx.2025.101184 [↩]
- Galileo Technologies. India Produces LNG for the First Time with Galileo Technologies Equipment. Galileo Technologies. [↩]
- Pandey S, Srivastava VC, Kumar V. Comparative assessment of different grades of coal for methanol production: Simulation, optimization, environmental and economic analysis. Energy. 2023;284:129146. doi:10.1016/j.energy.2023.129146 [↩] [↩]
- Pawar ND, Heinrichs HU, Winkler C, et al. Potential of green ammonia production in India. Int J Hydrogen Energy. 2021;46(54):27247-27267. doi:10.1016/j.ijhydene.2021.05.203. [↩]
- Ammonia Energy Association. Emission Performance of Ammonia-Fueled, Two-Stroke Marine Engines. Ammonia Energy Association. [↩]
- Partner Nag N, Counsel Ahuja I. Green Ammonia Production in India. Norton Rose Fulbright. January 2025. [↩]
- Wang Q, Zhang H, Zhu P. Using Nuclear Energy for Maritime Decarbonization and Related Environmental Challenges: Existing Regulatory Shortcomings and Improvements. Int J Environ Res Public Health. 2023;20(4):2993. doi:10.3390/ijerph20042993. [↩]
- The Hindu. How is Global Shipping Trying to Decarbonize? The Hindu. 2025. [↩] [↩]
- PTI. Maritime Vision 2030 envisages ₹3 tn investment in port projects, 20 lakh jobs. Mint. March 2, 2021. [↩] [↩] [↩] [↩]
- Solakivi T, Paimander A, Ojala L. Cost competitiveness of alternative maritime fuels in the new regulatory framework. Transp Res D Transp Environ. 2022;113:103500. doi:10.1016/j.trd.2022.103500 [↩] [↩] [↩] [↩] [↩] [↩] [↩] [↩]
- Report of the Extraordinary Session of the Marine Environment Protection Committee (MEPC/ES.2). 2025. [↩] [↩]
- Sen. Padilla A. Clean Shipping Act of 2025. 119th Congress; 2025. [↩]
- Safety4Sea. U.S. Senators Propose Clean Shipping Act to Advance Decarbonization. Safety4Sea. July 21, 2025. [↩] [↩]
- Ministry of Land IT and TJ. Roadmap to Zero Emission from International Shipping. 2020. [↩] [↩] [↩]
- Charge. How Japan is tackling stringent emissions targets in the maritime industry. Accelleron. July 20, 2020. [↩] [↩]