
Abstract
Cancer is a noncommunicable disease characterized by the uncontrolled growth and spread of abnormal cells in the body. Metastasis is described as the spread of cancer cells between a primary site and to other organs, creating a secondary tumor. The potential for cancer cells to metastasize can vary greatly across tissue and tumor types. However, metastatic potential and mRNA haven’t been directly connected. Here, the metastatic potential of distinct cancer cell lines are predicted from their global mRNA profile using a random forest model. This can help find natural biomarkers that are associated with a tumor’s ability to metastasize. In this study, between global mRNA and metastatic potential, there was a moderate predictive performance established (r = 0.55, 95% CI: [0.494, 0.617]). Additionally, the model is shown to learn biological signals past the tumor type, and learn biologically relevant information, bolstering support for the predictiveness of global mRNA regarding metastatic potential. These results demonstrate the ability for global mRNA to predict metastatic potential, allowing for further research to establish biomarkers. These results aid in the prediction of motility rates of cancer in the future.
Introduction
Cancer affects millions of humans globally, with 20 million new cases every year1. While discussing cancer, it is important to understand the factors which cause its danger. What is commonly known as stage 4 cancer is the stage where cancer metastasizes, effectively developing a secondary tumor at a distance from a primary site of cancer.
As cancer cells continue to proliferate, they also migrate due to Epithelial-Mesenchymal Transition (EMT)2 and nutrient availability, to grow and reproduce3. As this process gains traction, different cancer cells reach secondary tumors at different rates. This cell motility contributes to metastatic spread, and it varies across the tumor microenvironment and cell lines4,5. Motility rates are associated with metastasis, a key phenotype indicating cancer progression. This gives rise to different potentials for cancer cells to metastasize across cell lines. Additionally, cancer is difficult to generalize due to its intra-tumoral and inter-patient heterogeneity, making it very difficult for medical specialists to treat cancer.
A primary goal of systems biology is to understand how complex cell phenotypes such as migration emerge from their underlying molecular state6. For example, by leveraging the global measurements provided by high-throughput omics technologies in parallel with phenotypic measurements of interest, various statistical models can quantitatively characterize the underlying relationships and extrapolate to provide predictive power7, identifying key features associated with cell phenotype, providing crucial insights to myriad biological processes associated with health and disease. In particular, machine learning approaches that leverage omics data have created predictive models that identify disease biomarkers, provide insights to gene regulation, and guide the designing of drugs8.
Previous studies have looked at specific modes of cancer such as bone cancer, and used microarray data to predict it9. Additionally, other studies have looked at using metabolism to predict metastasis10. While migration rates have been predicted from cell morphology using an Artificial Neural Network (ANN)11, no one has directly connected RNA-sequencing (RNA-seq) measurements to motility. Given the widespread accessibility of RNA-seq, such a predictive model could prove invaluable to assessing the metastatic potential of individual patients’ tumors. RNA-seq could be used as a potential marker for metastasis in the future.
Here, cancer cell lines’ metastatic potential are predicted from their gene expression profiles using a Random Forest Regression (RF) model. By employing an ensemble approach and decision tree structure, RF models are robust to overfitting, provide strong predictive power, and do not assume linear relationships. Relationships between gene expression and phenotype are often non-linear, and are measured through correlation analysis, which can be measured through Spearman correlation. However, to assess model performance, linear models are preferred such as Mean-squared error and Pearson correlation12. Using this model, connections between global mRNA and metastatic potential are created. Additionally, a tissue-dependence analysis indicates that the model is not predicting based on tumor type, rather based on biological signal. Lastly, a feature analysis shows that the model is learning biologically relevant information.
Methods
RNA-seq measurements were obtained from Klijn et al13 in TPM format as uploaded to EMBI14. TPM was used in order to ensure corrections for both gene length and sequencing depth in RNA-seq15. RNA-seq measures the gene expression across different cell lines, and the measurement of RNA-seq across Gene-ID’s and cell lines is what was used.
Metastatic potential was obtained from Jin et al16. Briefly, metastatic potential is the tendency of a cell to gain migratory properties and invade a lesion, and serves as a proxy for cancer cell motility or the likelihood for metastasis. The ‘mean’ metastatic potential column provided in the MetMap dataset, which represents the average log-scaled barcode enrichment (relative metastatic burden) for each cell line, was utilized in analysis. No duplicate cell lines were identified.
Both data sets were filtered to include intersecting samples. Originally, the RNA-seq dataset contained 622 samples, and the metastatic potential dataset contained 488. After parsing the naming conventions, 228 samples remained.
The data was first log transformed. Then, prior to feature selection, the data was split as follows: 70% training, 15% validation, and 15% testing. A conducted feature selection on the training data set using a LASSO regression model, preventing overfitting and selecting the most pertinent genes from the RNA-seq data. An alpha/penalty value of 0.001 was used based on exploratory tuning, balancing sparsity and model performance. Previous work suggests that small but nonzero penalties are appropriate when predicting high-dimensional molecular phenotypes17. Lasso regression was performed across 100 iterations, and the coefficients that were non-zero more than 80% of the time were retained for downstream construction of the RF regression. Choosing 80% of non-zero samples retains biological signals while removing false positives. Out of the 57,711 features, 206 were selected.
To assess how well the model will generalize to new, unseen observations, data was split into 70% training, 15% validation, and 15% test sets. For hyper-parameter tuning on validation data (Table 1), a 10-fold cross validation on the training datasets was applied; following this, the best performing hyperparameters were retained through evaluation on the validation datasets.
| Hyperparameter (from sklearn.ensemble import RandomForestRegressor) | Values |
|---|---|
| Estimators (# of trees in the forest) | 100, 350, 600, 850 |
| Features (# of features to consider when looking for the best split) | ‘sqrt’, ‘log2’ |
| Samples (# of samples to draw from X to train each base estimator) | 0.25, 0.5, 0.75 |
Results
This scatterplot in the left panel compares RNA-Seq measurements against variance. Linearity of this relationship under a log scale indicates the need for log transformation. The middle plot represents appropriate normalization of the RNA-seq data as it follows a normal distribution. Additionally, in the right panel, a bimodal shape of the metastasis data is displayed, indicating the need for a non-linear model.
To assess model performance, the Pearson Correlation Coefficient, Mean-Squared Error, and Spearman Correlation Coefficient, were used. Pearson assesses the linearity of a set of data, helping give the viewer a sense of the correlation between points18. Mean-Squared Error measures the average squared difference between the actual values, and the predicted values19. Spearman measures the strength of the monotonic relationship between the actual and predicted20.
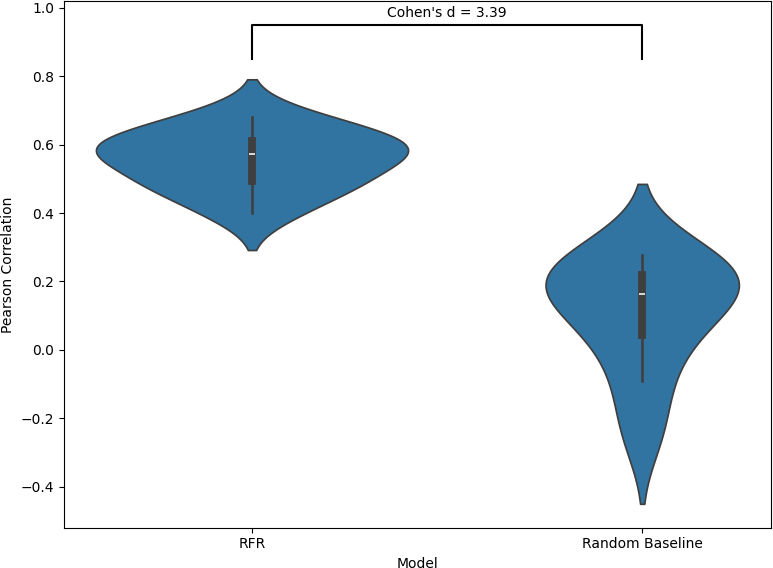
This figure compares the performance of the Random Forest Regression (RFR) model against a random baseline using Pearson correlation across 10 folds as shown in the violin plots. The RFR model achieves a mean Pearson correlation of 0.56 with a standard deviation of 0.007, indicating moderate predictive power across folds. As expected, the random baseline has a much lower mean correlation of 0.12 and a larger standard deviation of 0.027, reflecting both weak predictive ability and greater variability. Additionally, the reported Cohen’s d value of 3.39 reflects a large difference in the performance of the RFR model and the random baseline, indicating that the model is not simply guessing. All together, it can be said that 31.4% of the variance in metastatic potential can be explained by transcriptomics.
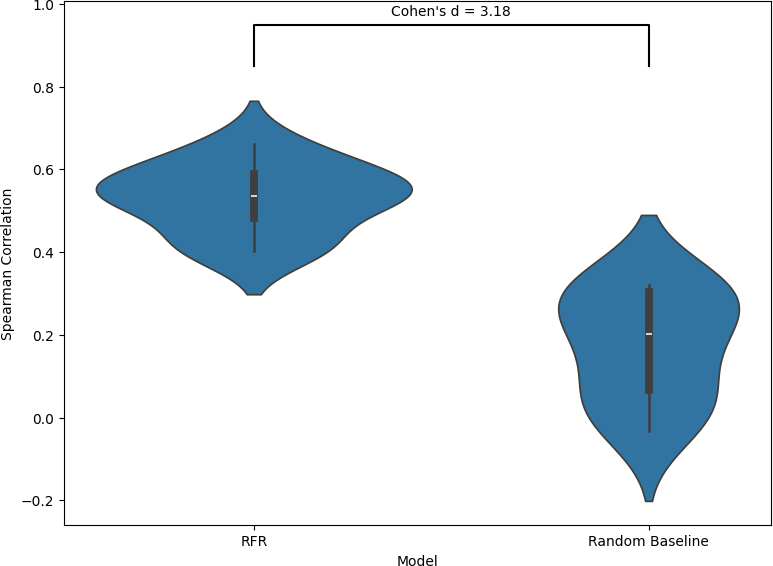
This figure compares the performance of the Random Forest Regression (RFR) model against a random baseline using Spearman correlation across 10 folds, as shown in the violin plots. The RFR model achieves a mean Spearman correlation of 0.53 with a standard deviation of 0.007, indicating consistent ability to capture monotonic relationships between predicted and true metastatic potential across folds. The random baseline yields a much lower mean correlation of 0.17 and a higher standard deviation of 0.018, reflecting weaker and less stable performance. A Cohen’s d value of 3.18 shows a large effect size, indicating that the RFR model clearly outperformed the random baseline. Overall, these results demonstrate that the model preserves the relative ordering of metastatic potential substantially better than chance.
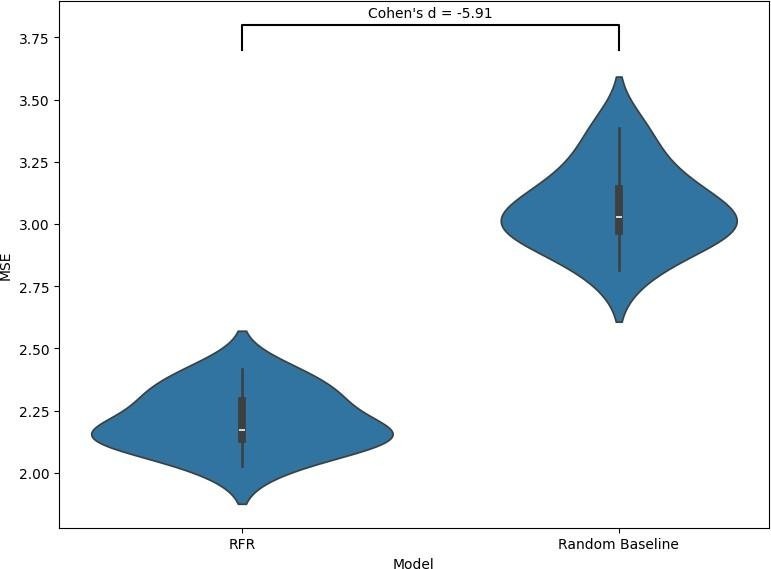
This figure compares the performance of the Random Forest Regression (RFR) model against a random baseline using mean squared error (MSE) across 10 folds, as shown in the violin plots.
The RFR model achieves a mean MSE of 2.21 with a standard deviation of 0.015, indicating lower prediction error and high consistency across folds. In comparison, the random baseline has a higher mean MSE of 3.06 and a standard deviation of 0.027, reflecting both poorer predictive accuracy and greater variability. A Cohen’s d value of -5.91 shows a large effect size, indicating that the RFR model clearly outperformed the random baseline. Taken together, the lower error and reduced variance demonstrate that the RFR model provides a meaningful improvement over random guessing in terms of absolute prediction accuracy.
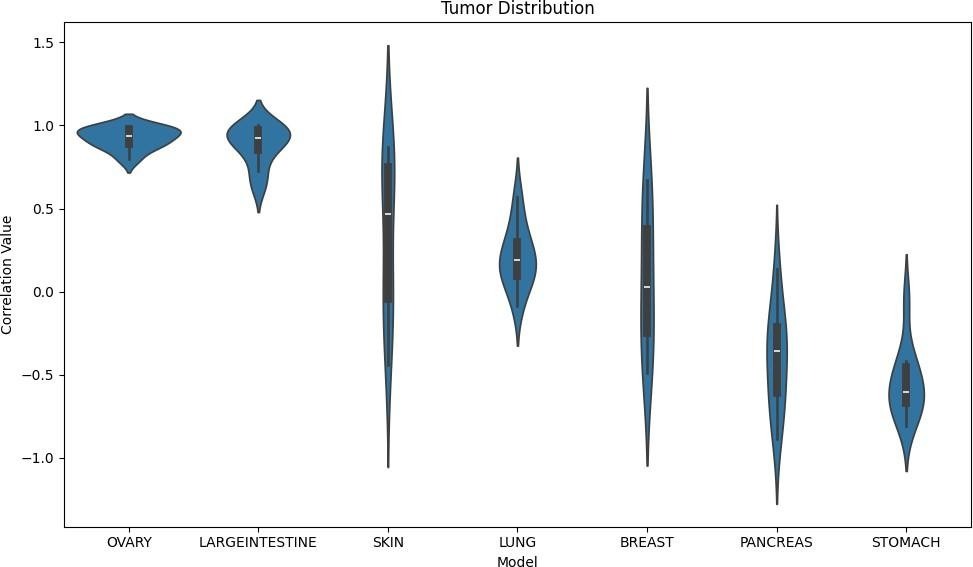
This figure evaluates the performance of the transcriptomic Random Forest Regression (RFR) model across different tumor types using Pearson correlation, as shown by the violin plots.
The model performs strongest in ovarian and large intestine cancers, with mean correlations of 0.92 (SD = 0.004) and 0.88 (SD = 0.015), respectively. These high correlations, coupled with very low standard deviations, indicate high predictive power regarding these tumors and that they contain strong signals associated with metastasis.
In contrast, performance is more moderate and variable in tumor types such as skin (mean = 0.34, SD = 0.237) and lung (mean = 0.21, SD = 0.035). The larger spread, as indicated by the standard deviation, in the skin distribution indicates inconsistency across folds, suggesting that the relationship between gene expression and metastatic potential may be more complex or less well captured by the model in this context.
For breast cancer, the model shows near-zero predictive performance (mean = 0.07, SD = 0.193). Even more notably, performance becomes negative for pancreas (mean = -0.40, SD = 0.094) and stomach (mean = -0.55, SD = 0.047), implying that the model’s predictions are inversely related to the true metastatic potential in these cases. This suggests that the model might be learning tumor-types rather than biological signals.
However, this tumor-specific analysis should be interpreted in the context of the tumor-only baseline, which achieves an R2 value of -0.05, indicating that using the mean alone would provide better results, demonstrating that tumor identity by itself does not meaningfully explain variance in the outcome.
Overall, this figure supports the nuanced claim that while predictive power of transcriptomic data varies greatly across tumor type, it is actually not dependent on tumor type. While strong and reliable signals exist for certain cancers, other tumor types exhibit weak, inconsistent, or even misleading relationships. At the same time, the poor performance of the tumor-only baseline reinforces that these results are not simply driven by tumor identity, but rather by meaningful transcriptomic patterns that vary in strength across cancer types.
| Pathway | Description | p-value |
|---|---|---|
| Rho GTPase Cycle | Regulates cytoskeletal dynamics and cell motility, enabling cancer cells to migrate and invade during metastasis21. | < 0.001 |
| Focal Adhesion | Mediates interactions between cells and the extracellular matrix, facilitating adhesion, migration, and invasion in tumors22. | < 0.001 |
| Pathways In Cancer | Integrates multiple oncogenic signaling pathways that drive tumor initiation, growth, and progression23. | < 0.001 |
| Ras Pathway | Promotes uncontrolled cell proliferation and survival through activation of downstream signaling cascades such as MAPK and PI3K24. | < 0.001 |
| Wnt Signaling Pathway | Controls cell fate and proliferation, and its dysregulation contributes to tumor growth and progression25. | < 0.001 |
| Proteins with Altered Expression in Cancer Metastases | Represents molecular changes associated with metastatic tumors, reflecting adaptations that support invasion and colonization of distant sites26. | < 0.001 |
Chosen genes were put into Enrichr to identify relevant pathways27. Many pathways were directly and indirectly linked to cancer and its relevant processes. This is indicative of the model learning biologically relevant information, showing deep biological insight gained by the model.
Discussion
Cancer cell migration rate deals with the movement of cancer cells from a primary site to a secondary site. This research provides insights on the relationship between RNA-seq measurements and migration, allowing for better interpretation of cancer metastasis.
The findings of this research indicate a moderate positive correlation between global mRNA and metastatic potential. In the future, identification of the mRNA features with large influence on model predictions could serve as potential biomarkers for metastasis. The moderate correlation value indicates that there could be factors not captured by transcriptomics that influence metastatic potential. Notably, model performance varied substantially across tumor types. However, a tumor-only analysis indicates that the model is not learning tumor type, and rather a biological signal.
While this study has connected mRNA abundance to motility phenotypes, related studies have demonstrated the connection between metabolism2 and cell morphology to migration11. Similar studies have also shown deep learning to predict metastatic potential from a pan-cancer analysis, 3 heterogeneous data layers28, and from binary datasets of cancer cell lines29.
The metastatic potential reported was quantified in a mouse, and therefore might not be directly applicable to humans. Rationale for this includes the mice not experiencing the prolonged stages of cancer, genetic differences, and their environment30,31,32. In the future, similar models can be used to assess this behavior in humans. This has the potential to uncover crucial insights regarding cancer’s rate of metastasis within humans.
In this study the correlation between cancer cell lines and global mRNA was found. An important part of how metastasis occurs is the invasion portion, which requires a process called EMT (epithelial–mesenchymal transition), which allows cancer cells to gain migratory and invasive properties33. These transitioned cells then travel through blood and lymph systems, which differ across tissues, and examining specific tissues can provide more specific results for patients34. Additionally, perturbational (“knock-out”) analyses can be conducted to find specific genes contributing more to metastatic potential prediction.
References
- Cancer statistics. https://www.cancer.gov/about-cancer/understanding/statistics (2015). [↩]
- Yizhak, K. et al. A computational study of the Warburg effect identifies metabolic targets inhibiting cancer migration. Mol. Syst. Biol. 10, 744 (2014). [↩] [↩]
- Altea-Manzano, P., Cuadros, A. M., Broadfield, L. A. & Fendt, S.-M. Nutrient metabolism and cancer in the in vivo context: a metabolic game of give and take. EMBO Rep. 21, e50635 (2020). [↩]
- D’Orazio, M. et al. Deciphering cancer cell behavior from motility and shape features: Peer prediction and dynamic selection to support cancer diagnosis and therapy. Front. Oncol. 10, 580698 (2020). [↩]
- Stuelten, C. H., Parent, C. A. & Montell, D. J. Cell motility in cancer invasion and metastasis: insights from simple model organisms. Nat. Rev. Cancer 18, 296–312 (2018). [↩]
- Karr, J. R. et al. A whole-cell computational model predicts phenotype from genotype. Cell 150, 389–401 (2012). [↩]
- O’Brien, E. J., Lerman, J. A., Chang, R. L., Hyduke, D. R. & Palsson, B. Ø. Genome-scale models of metabolism and gene expression extend and refine growth phenotype prediction. Mol. Syst. Biol. 9, 693 (2013). [↩]
- Pais, R. J. Predictive Modelling in Clinical Bioinformatics: Key Concepts for Startups. BioTech (Basel) 11, (2022). [↩]
- Albaradei, S. et al. Predicting bone metastasis using gene expression-based machine learning models. Front. Genet. 12, 771092 (2021). [↩]
- Xie, S.-Z., Pan, J.-J., Xu, J.-F., Zhu, W.-W. & Qin, L.-X. The critical function of metabolic reprogramming in cancer metastasis. Aging Cancer 3, 20–43 (2022). [↩]
- Zhang, Z. et al. Morphology-based prediction of cancer cell migration using an artificial neural network and a random decision forest. Integr. Biol. 10, 758–767 (2018). [↩] [↩]
- Darwiche, R. & Struhl, K. Pheno-RNA, a method to associate genes with a specific phenotype, identifies genes linked to cellular transformation. Proc. Natl. Acad. Sci. U. S. A. 117, 28925–28929 (2020). [↩]
- Klijn, C. et al. A comprehensive transcriptional portrait of human cancer cell lines. Nat. Biotechnol. 33, 306–312 (2015). [↩]
- Expression Atlas. https://www.ebi.ac.uk/gxa/experiments/E-MTAB-2706/Downloads. [↩]
- Zhao, S., Ye, Z. & Stanton, R. Misuse of RPKM or TPM normalization when comparing across samples and sequencing protocols. RNA 26, 903–909 (2020). [↩]
- Jin, X. et al. A metastasis map of human cancer cell lines. Nature 588, 331–336 (2020). [↩]
- Friedman, J., Hastie, T. & Tibshirani, R. Regularization paths for generalized linear models via coordinate descent. J. Stat. Softw. 33, 1–22 (2010). [↩]
- Rovetta, A. Raiders of the lost correlation: A guide on using Pearson and Spearman coefficients to detect hidden correlations in medical sciences. Cureus 12, e11794 (2020). [↩]
- Mean Square Error (MSE). https://encord.com/glossary/mean-square-error-mse/#:~:text=In%20the%20fields%20of%2 0regression,target%20values%20within%20a%20dataset. [↩]
- Melanie. Pearson and Spearman Correlations: A Guide to Understanding and Applying Correlation Methods. Data Science Courses | DataScientest https://datascientest.com/en/pearson-and-spearman-correlations-a-guide-to-understanding-a nd-applying-correlation-methods#:~:text=The%20Pearson%20correlation%20and%20Spear man%20Correlation%20are%20two%20different%20correlation,therefore%20important%20for%20Machine%20Learning. (2024). [↩]
- Orlic-Milacic, M. & Rothfels, K. RHO GTPase cycle. [↩]
- Focal adhesion – Homo sapiens (human). https://www.kegg.jp/pathway/hsa04510. [↩]
- Pathways in cancer – Homo sapiens (human). https://www.kegg.jp/pathway/hsa05200. [↩]
- Ras signaling pathway – Homo sapiens (human). https://www.kegg.jp/pathway/hsa04014. [↩]
- Wnt signaling pathway – Homo sapiens (human). https://www.kegg.jp/pathway/hsa04310. [↩]
- Pessoa, J., Martins, M., Casimiro, S., Pérez-Plasencia, C. & Shoshan-Barmatz, V. Editorial: Altered expression of proteins in cancer: Function and potential therapeutic targets. Front. Oncol. 12, 949139 (2022). [↩]
- Chen, E. Y. Enrichr. https://maayanlab.cloud/Enrichr/. [↩]
- Albaradei, S. et al. MetaCancer: A deep learning-based pan-cancer metastasis prediction model developed using multi-omics data. Comput. Struct. Biotechnol. J. 19, 4404–4411 (2021). [↩]
- Gardner, K. et al. Label free identification of different cancer cells using deep learning-based image analysis. APL Machine Learning 1, 026110 (2023). [↩]
- Eruslanov, E. B., Singhal, S. & Albelda, S. M. Mouse versus human neutrophils in cancer: A major knowledge gap. Trends Cancer 3, 149–160 (2017). [↩]
- Wasta, V., Butch, R. & Tucker, A. Study adds to evidence that most cancer cells grown in a dish have little in common genetically with cancer cells in people. Johns Hopkins Medicine https://www.hopkinsmedicine.org/news/newsroom/news-releases/2021/06/study-adds-to-evi dence-that-most-cancer-cells-grown-in-a-dish-have-little-in-common-genetically-with-canc er-cells-in-people (2021). [↩]
- PDX Mouse Models Match Genetics of Human Tumors. https://www.cancer.gov/news-events/cancer-currents-blog/2021/cancer-pdx-mouse-models-r etain-genetics-human-tumor#:~:text=A%20chief%20concern%20is%20whether,they%20re sponded%20to%20cancer%20therapies. (2021). [↩]
- Fares, J., Fares, M. Y., Khachfe, H. H., Salhab, H. A. & Fares, Y. Molecular principles of metastasis: a hallmark of cancer revisited. Signal Transduct. Target. Ther. 5, 28 (2020). [↩]
- National Cancer Institute (.gov). https://www.cancer.gov/publications/dictionaries/cancer-terms/def/metastasis (2011). [↩]


