
Tharun Prakash Dhamotharakannan1, Kanshika Dhamotharakannan1
1 Lambert High School, USA
Abstract
Pneumonia is a serious lung infection in which early detection can improve the outcomes, but manual interpretation in diagnosing the decease by using radiographs can be time-consuming and dependent on clinical workload and expertise. This study compares two deep learning approaches Convolutional Neural Networks (CNNs) and Vision Transformers (ViT-style models) – to diagnose pneumonia from chest X-ray images. A publicly available dataset was used of this study. Both models were trained until convergence using validation-loss-based early stopping with checkpoint selection (best epochs: CNN=9, ViT =28). The CNN model achieved 0,8958 accuracy (TN=174, FP=60, FN=5, TP=385), while the ViT model achieved 0.8494 accuracy (TN=156, FP=78, FN=16, TP=374) on the held-out test set. Both models achieved with high pneumonia recall, but normal-case recall was lower which indicated ongoing false positive risk. There are limitations include pediatric-only data, down sampling to 224X224, and evaluation on a single split; the external validation and higher-resolution testing are needed before clinical deployment.
Keywords: Artificial Intelligence, Pneumonia Diagnosis, Convolutional Neural Networks (CNNs), Vision Transformers (ViTs)
Introduction
Pneumonia is a potentially fatal lung infection that must be detected early. Pneumonia is a disease that spreads mainly through droplets; this, in turn, makes pneumonia a highly contagious disease. People who have pneumonia have lungs that fill up with fluid1, and they have trouble breathing. It is usually very common in children and people whose bodies are less developed. Pneumonia is the world’s leading cause of death among children under 5 years of age, accounting for 14% of all deaths of children under 5 years old1 and it killed more than 740,180 children in 2019. Pneumonia could spread through viruses and bacteria. Pneumonia’s effects vary by person. For example, people who are frequent smokers are more likely to be more severely affected by pneumonia. Chest X-rays are commonly used for diagnosis, but interpreting them can be challenging. Artificial Intelligence (AI) and machine learning models, particularly CNNs, can assist radiologists by automating this process. A Convolutional Neural Network (CNN) is a type of machine learning model. It usually works with tasks like image recognition, object detection, and image segmentation. It works by taking in images as numerical datasets. These datasets are in the form of pixels. The CNN model was first introduced for image recognition by Lecun et al.2 A CNN model is excellent at analyzing image data. A CNN model can learn automatically from raw data. CNN models trained on large-scale datasets have demonstrated high performance3. Another type of machine learning approach we used was ViT. ViT stands for Vision Transformer. ViT emerged as a direct competitor to CNNs. ViT was introduced in 2021, and its main functions include object detection, image classification, and action recognition. The ViT model introduced a transformer-based architecture which showed competitive performance against CNNs4 .
This study compares two deep learning approaches Convolutional Neural Networks (CNNs)5 and Vision Transformers (ViT-style models)6 to diagnose pneumonia from chest X-ray images. We evaluate the following research question: Which AI model provides more reliable performance for pneumonia diagnosis on pediatric chest X-rays, a CNN or a ViT-style model? Using a publicly available dataset of 5,863 labeled X-ray images, we train and evaluate both models under a consistent protocol, including the same input resolution and class-imbalance handling. We also use a test-set-only reporting strategy. The model selection was performed using validation-based early stopping and checkpointing. This work reports performance comparison using classification metrics and confusion-matrix error patterns. We also discuss important limitations, including the pediatric-only nature of the data and potential information loss from down sampling.
Methods
Dataset
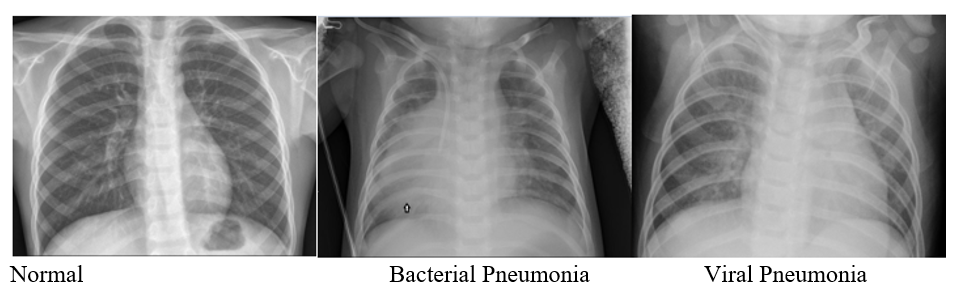
The normal chest X-ray (left panel) depicted clear lungs without any areas of abnormal opacification in the image. Bacterial pneumonia (middle) typically exhibited a focal lobar consolidation, in this case in the right lobe (white arrow), whereas viral pneumonia (right) manifests with a more diffuse ‘‘interstitial’’ pattern in both lungs (Illustrative Examples of Chest X-Rays in Patients with Pneumonia, figure 1)
A publicly available dataset7 of 5863 labeled X-rays (Normal vs Pnuemonia) was used for this study. The dataset was split into train(n=4,616), validation (n=616), and test(n=624). The class distribution in each split was as follows: Train-Normal: 1,041 (22.6%), Pneumonia: 3,575 (77.4%); Validation-Normal: 308 (50.0%), Pneumonia: 308 (50.0%); Test-Normal: 234 (37.5%), Pneumonia: 390 (62.5%).For improving fairness and reproducibility, both models used the same input resolution(224X224), consistent preprocessing, class-imbalance handling via class-weighted training, and a test-set-only reporting strategy.
CNN Model Architecture
The CNN model8 was implemented in Python using with TensorFlow/Keras to classify the chest X-ray images into NORMAL vs PNEUMONIA. The X-ray images were loaded from separate training, validation and testing folders (each containing NORMAL and PNUEMONIA subfolders) and were resized to a consistent 224×224 input resolution, and they were preprocessed using a consistent normalization scheme (including an ImageNet-style normalization option to align preprocessing across models). The training augmentation (e.g., horizontal flips and geometric transforms such as zoom/shear) was applied to the training split only, while validation and test X-ray images were evaluated without augmentation to ensure a clean assessment on unseen data. The CNN architecture used stacked Conv2D + MaxPooling feature extractors, followed by Flatten, Dropout, and Dense layers with a sigmoid output for the binary classification, and it was trained using Adam (learning rate = 1e-4. batch size = 32, Maximum epochs = 200, patience = 10 ) and binary cross-entropy. To address class imbalance, the program script computed and applied class weights from the training labels. Training was performed until convergence using early stopping monitored on validation loss, with ModelCheckpoint saving the best model at the epoch with the lowest validation loss (best epoch = 9) was saved and ReduceLROnPlateau was used to lower the learning rate when validation loss stopped improving. The final performance was computed strictly on the held-out data set by using a classification report and confusion matrix, and the workflow also includes learning-curve plots (accuracy/loss), misclassification inspection, inference-time measurement, and Grad-CAM visualization for interpretability.
ViT Model Architecture
The ViT-style model was implemented in PyTorch using Hugging Face and a lightweight transformer architecture based on DeiT-Small (patch size 16, input 224×224)configured for binary classification (Normal vs Pneumonia). The dataset was loaded from separate training, validation and test folders (each containing NORMAL and PNEUMONIA subfolders) and the script prints the totals and class percentages for reproducibility. All images were resized to 224×224 size and normalized by using the model’s AutoImageProcessor mean/std (ImageNet-style normalization), and the data augmentation (random horizontal flips and small rotations) was applied only to the training set and not to the validation and test sets. For addressing the class imbalance, class weights were computed from the training labels and they were incorporated into a weighted CrossEntopyLoss. For computational efficiency on CPU, the program script freezes the transformer backbone and trains the classifier head only(UNFREEZE_LAST_N_BLOCKS = 0), while still report total vs trainable parameters (21,666,434 total parameters, 770 trainable parameters, and 21,665,664 frozen parameters).A ViT-style model is evaluated in transfer-learning mode (pretrained) and clearly report that this uses ImageNet pretraining; comparison should be interpreted accordingly. Trainings ran up to a maximum of 50 epochs (batch size = 64, learning rate = 5e-4, patience = 5 ) but training was performed until convergence using early stopping based on the validation loss( with patience and the minimum improvement threshold) and saving the best checkpoint when validation loss improves and reducing the learning rate by using ReduceLROnPlateau. Then the program was designed to reload the best checkpoint and evaluate strictly on the held-out test set, producing the classification report, confusion matrix (with plots), learning curves plot (train/val accuracy and loss), a list of misclassified examples list and inference time per image measurement for computational cost reporting.
Results
We developed the CNN and ViT models in Python. We trained the Models and tested by using the dataset of X-ray images. We obtained the Plots, classification report and confusion matrix from these models to compare the performance of these models in diagnosing the Pneumonia by the X-ray images.
Plot analysis
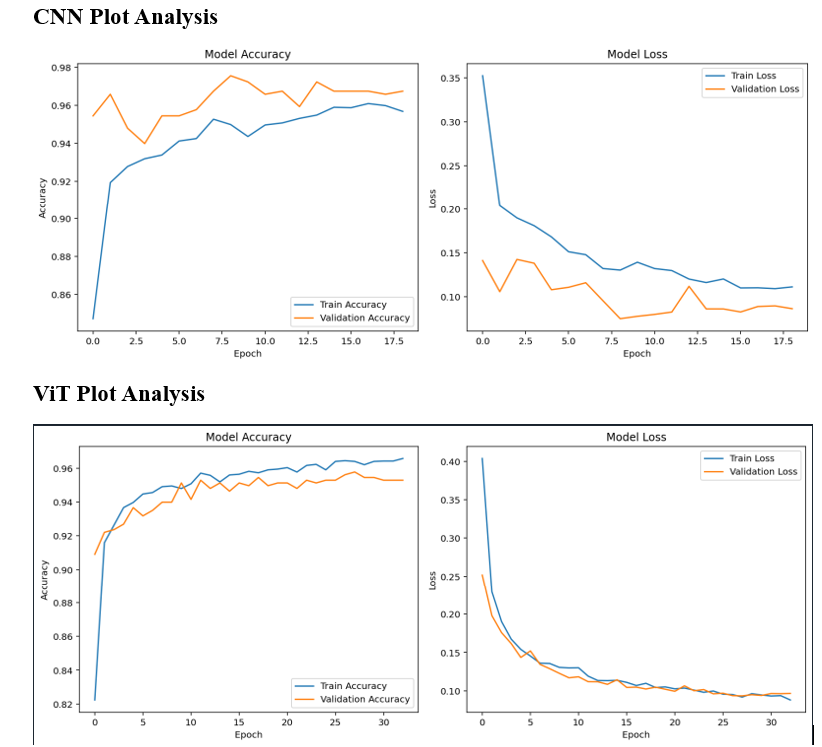
Figure 2 shows that the training and the validation accuracy and loss curves for both of the CNN and ViT models. Based on the early stopping by using the validation loss, Both the models were trained until the convergence. The best epochs are selected as check points where the validation loss is the lowest (Best epoch of CNN = 9 and best epoch of ViT = 28). The CNN curve shows that the early learning was rapid. The training accuracy increased from the mid-0.08s to above ~0.92 quickly within the first few epochs. Then it gradually increased ~0.96 by the later epochs. The validation curve was consistently high (roughly ~0.95 to ~0.97) and stayed close to the training curve. This indicates the stable generalization in the run. The loss curves show convergence, with training loss decreasing steadily and validation loss reaching its minimum in the mid epochs and it was consistent with the best epoch selected as check point at epoch 9.
The ViT shows a similar rapid initial improvement followed by slower refinement and it had a longer training span. Training accuracy raised sharply from the first epoch from ~0.82 to above ~0.90 and it continued increasing gradually to the mid-0.96 range by the best epoch. Validation accuracy increased early and then stabilized around ~0.95–0.956 with small fluctuations, remaining slightly below the training curve, which shows diminishing validation gains after the early convergence. During the initial epochs, a steep declination was shown in both training and validation loss. It was followed by a gradual decrease and stabilization. The validation loss reached its lowest level later than the CNN which was aligned with the check point at epoch 28. Overall, on comparing both the models, both models showed convergent behavior, but the CNN reached its optimal validation-loss checkpoint earlier than ViT as ViT required more epochs to minimize validation loss.
Confusion Matrix
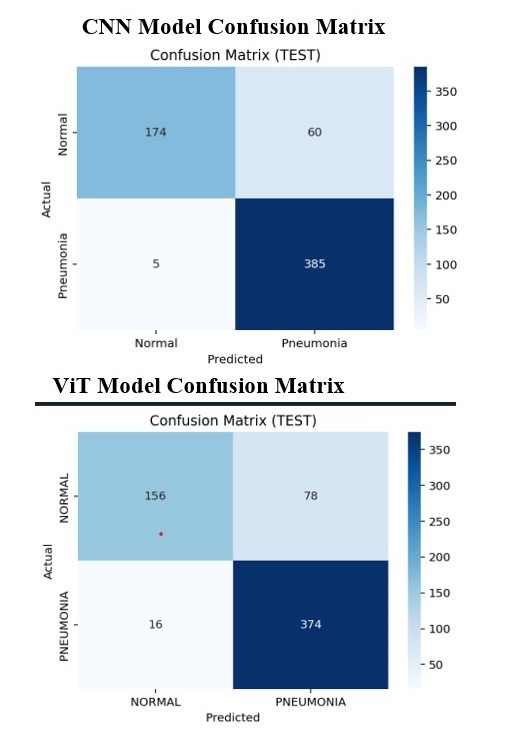
Confusion Matrix9 shows a granular view of both model’s prediction outcomes by reporting the true positives (TP), false positives (FP), true negatives (TN) and false negatives (FN). This is essential to understand the diagnostic behavior in pneumonia detection, especially because false positives (FP) correspond to healthy patients who are flagged and incorrectly diagnosed as Pneumonia and false negatives correspond to missed Pneumonia cases. On the held-out test set (n=624), the CNN model confusion matrix shows TN=174, FP=60, FN=5, TP=385, while the ViT model confusion matrix shows TN=156, FP=78, FN=16, TP=374 (Confusion matrices for the CNN and ViT models on the held-out test set, figure 3).
On comparing the both the models, CNN shows fewer missed Pneumonia cases (5 vs 16 false negatives) and fewer healthy patients incorrectly diagnosed as pneumonia (60 vs 78 false positives). Although both models performed with high sensitivity for diagnosing pneumonia, the relatively high false-positive counts highlight the practical challenge of normal-case diagnosis and the clinical importance of improving specificity.
Error Analysis and Interpretability
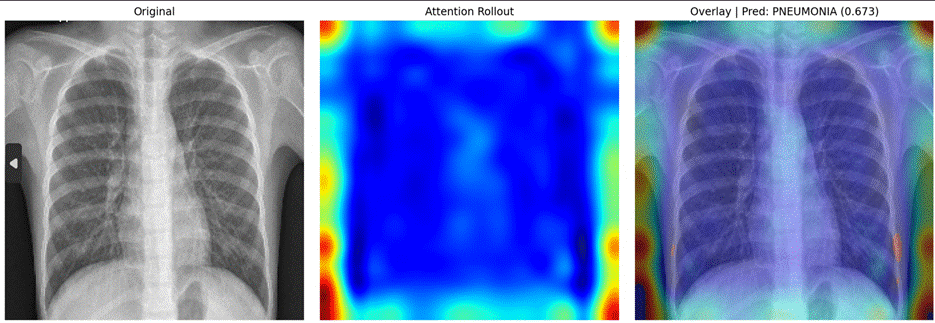
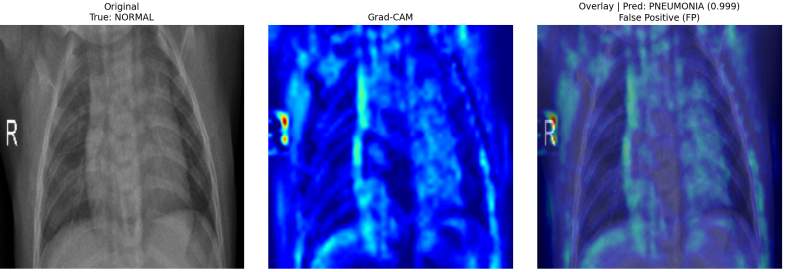
To evaluate reliability beyond accuracy, misclassified test images were analyzed for both models. The CNN model produced results with 60 false positives and 5 false negatives, while the ViT produced results with 78 false positives and 16 false negatives. This shows that both models struggled most with Normal case images wrongly classified as Pneumonia. Errors appeared more likely in X-ray images with subtle or ambiguous lung patterns, lower contrast, positioning differences, or overlapping anatomical structure. Because the dataset combines both viral and bacterial pneumonia into one Pneumonia category; subtype-specific difficulty could not be determined. Grad-CAM was used to visualize parts influencing in predicting the Pneumonia for CNN, while attention rollout was used for the ViT ; These qualitative maps show whether both models focused on relevant lung regions, but they should not be taken as proof of clinically correct reasoning.
As shown in the figure 4, the ViT false-positive example image received substantial attention near the boundaries and non-lung regions, which may have contributed to the Normal case image wrongly classified as Pneumonia. As shown in the figure 5, The CNN false-positive example shows that the model can predict Pneumonia even for a Normal image strongly which highlights the need to improve specificity and reduce unnecessary false alarms.
Discussion
This study compared the performance of the Convolutional Neural Network (CNN) model and the Vision Transformer (ViT) model for detecting pneumonia automatically using X-ray images. The goal was to evaluate diagnostic reliability by comparing multiple dimensions, including learning-curve behavior, classification metrics and confusion matrix error patterns. Both models were trained until convergence using early stopping based on validation loss. The best stopping points were selected at epoch 9 for the CNN and epoch 28 for the ViT and the final conclusion were based out on the held-out test set to ensure that validation data were used only for checkpoint selection rather than final performance reporting.
The classification reports10 on the test set show that both the models were effective in detecting pneumonia but the CNN model achieved stronger overall performance under the provided training setup. The CNN model reached the test accuracy of 0.8958 compared to 0.8494 for the ViT and the CNN also achieved higher aggregate performance (macro F1 0.8824 vs 0.8284; weighted F1 0.8923 vs 0.8434). For pneumonia detection (Case 1), both models showed high recall, but the CNN recall was higher compared to ViT (0.9872 vs 0.9590), meaning the CNN missed fewer pneumonia cases in the test data, which is clinically important because false negatives can lead to missed infections and delayed treatment; similar emphasis on sensitivity and reduction in FN is common practice in pneumonia X-ray model comparison in prior work.11,12,13,14,15
For Normal case detection (Case 0), both the models showed lower recall than pneumonia which indicated a tendency to over-predict pneumonia; the performance of the CNN model was again better in normal detection, achieving Normal recall 0.7436 compared to the ViT recall of 0.6667 and CNN Normal F1 0.8426 compared to 0.7685 for the ViT, showing the CNN was more reliable at identifying healthy individuals and reducing false alarms. Both models had lower normal-case recall and false positives were non-trivial (CNN FP=60; ViT FP=78 on Normal=234) which indicates ongoing specificity limitations despite class weighted training .This tradeoff of high pneumonia sensitivity with weaker Normal recall has been reported in many X-ray pneumonia diagnosis studies, especially when training data are imbalanced11,12,14,16
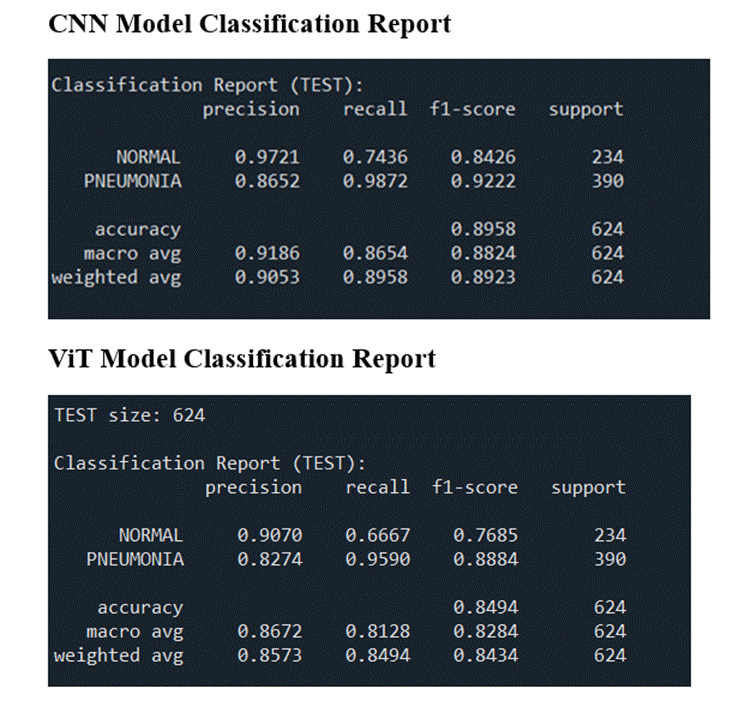
From the confusion matrix results on the test data, the CNN generated fewer false negatives than the ViT model ( 5 vs 16), which is clinically important because false negatives represent that missed pneumonia diagnoses. The CNN also produced fewer number of false positives than the ViT ( 60 vs 78 ), which means fewer healthy patients were incorrectly flagged as pneumonia and potentially flagged for unnecessary follow-up testing. Macro averages weight both classes equally and are useful for judging balanced performance under class imbalance, while weighted averages reflect class prevalence and summarize overall expected performance on the observed distribution; therefore, we report both metrics and interpret them in that context. Overall, the confusion matrix confirms that both the models achieved high sensitivity for pneumonia detection, at the same time normal case detection remains more challenging which reflects the influence of class imbalance and the need for improved specificity- an observation consistent with some published comparative studies and reviews which highlight the significance of tuning with specificity-focused and imbalance-aware training strategies11,12,14,16,17
Computational cost was evaluated by measuring inference time on the held-out dataset using CPU. The CNN required 15.763 seconds total, or approximately 0.0253 seconds per image, while the ViT required 2027.593 seconds total, or approximately 3.249 seconds per image. This indicates that ViT model was about 129 times slower than the CNN model in the CPU-only environment. Although transformer-based model can capture global image relationships, their higher computational cost may limit their deployment practically in real-time or resource-constrained clinical environment settings. In contrast, CNN was more faster, making it more feasible for rapid image screening under limited hardware conditions.
The learning-curve plots support these outcomes and show different training dynamics between both the models. The CNN model reached its lowest loss earlier (Best epoch 9) in the learning-curve, while the ViT model progressed more gradually and reached its lowest loss later (best epoch 28), showing that ViT model needs more epochs to minimize the validation loss typically.
Related studies comparing the CNN backbones, ViT/DeiT , and hybrid CNN-transformer models note that performance depends strongly on training strategies and fine-tuning depth.13,18,19,20,21 Other studies using hybrid CNN-transformer and domain-adapted transformer models further show that architecture design, training protocol, and domain adaptation can influence performance22,23
Limitation/Future Work
In this study, several limitations should be noted. The dataset used for this study consists of pediatric chest X-rays and the results may not be generalizable to adults without external validation on adult and multi-site datasets. Future work should test the models on adult and multi- mixed-age datasets, and clinical deployment would require external validation or retraining using age-diverse chest X-ray data. Images were resized to 224×224, which may reduce fine diagnostic detail present in higher-resolution images. Results for this study are based on a single train/validation/test split; k-fold cross-validation and confidence intervals can strengthen claims about variability and stability. We did not perform any statistical significance testing, so differences are interpreted cautiously and may include sampling variability. Future work can include uncertainty estimates (for example, bootstrap CIs) and paired significance tests to assess whether the observed differences exceed sampling noise. Finally, transformer-based models like ViT can require more computational resources than CNN models, which may affect the deployment feasibility in resource-constrained clinical settings. Future work should include comparing models trained with and without augmentation to quantify how much augmentation affects accuracy, recall, F1-score, and false-positive/false-negative rates. A more complete evaluation of GPU performance, memory usage, and deployment requirements should be included in the future work. Future work should include stronger CNN model baselines (for example, ResNet, DenseNet, EfficientNet), and threshold calibration can be explored to further reduce false positives while maintaining high pneumonia sensitivity.12,14,16,17,15
Conclusion
Overall, comparing across classification metrics, learning curves and confusion-matrix evaluation, the experimental evidence shows that the CNN model outperformed the ViT model on the held-out test set and the CNN model produced fewer clinically relevant errors. While transformer-based models and hybrid architecture have shown better results in some pneumonia X-ray studies, their performance can vary based on many factors like model size, pretraining, and fine-tuning design.13,18,19,20,24 Other studies which are based on hybrid or domain adapted architectures show that model performance depends strongly on architecture design and training protocol.22,23,17,25 Therefore comparisons should be interpreted in the context of protocol differences, including dataset split, preprocessing, transfer learning and evaluation strategy.21,16,15 Because protocols differ, our results are not claimed as state-of-the-art; instead, we emphasize a controlled comparison with consistent preprocessing and test-only reporting.
References
- World Health Organization. (2023). Pneumonia. www.who.int/news-room/fact-sheets/detail/pneumonia [↩] [↩]
- Y. Lecun,L. Bottou,Y. Bengio,P. Haffner,Gradient-based learning applied to document recognition, Proceedings of the IEEE ,Volume: 86, Issue: 11, November 1998, https://doi.org/10.1109/5.726791 [↩]
- Daniel S. Kermany,Michael Goldbaum, Wenjia Cai,Carolina C.S. Valentim,Huiying Liang,Sally L. Baxter,Alex McKeown,Ge Yang,Xiaokang Wu,Fangbing Yan,Justin Dong,Made K. Prasadha,Jacqueline Pei,Magdalene Y.L. Ting,Jie Zhu,Christina Li2,Sierra Hewett,Jason Dong,Ian Ziyar,Alexander Shi,Runze Zhang,Lianghong Zheng,Rui Hou,William Shi,Xin Fu,Yaou Duan,Viet A.N.Huu,Cindy Wen,Edward D. Zhang,Charlotte L. Zhang,Oulan Li,Xiaobo Wang,Michael A. Singer,Xiaodong Sun,Jie Xu,Ali Tafreshi,M. Anthony Lewis,Huimin Xia,Kang Zhang, Identifying Medical Diagnoses and Treatable Diseases by Image-Based Deep Learning, Cell (2018).e9. https://doi.org/10.1016/j.cell.2018.02.010. [↩]
- Alexey Dosovitskiy, Lucas Beyer, Alexander Kolesnikov, Dirk Weissenborn, Xiaohua Zhai, Thomas Unterthiner, Mostafa Dehghani, Matthias Minderer, Georg Heigold, Sylvain Gelly, Jakob Uszkoreit, Neil Houlsby,,An Image is Worth 16×16 Words: Transformers for Image Recognition at Scale.International Conference on Learning Representations (ICLR)(2020).https://arxiv.org/abs/2010.11929 [↩]
- IBM. Introduction to convolutional neural networks https://developer.ibm.com/articles/ introduction-to-convolutional-neural-networks/?mhsrc=ibmsearch_a&mhq= What%20is%20CNN (2021). [↩]
- Khan, S., Naseer, M., Hayat, M., Zamir, S. W., & Shahbaz Khan, F.Transformers in Vision: A Survey. ACM Computing Surveys(2022), doi:10.1145/3505244 [↩]
- Kermany, Daniel,Zhang, Kang; Goldbaum, Michael , Labeled Optical Coherence Tomography (OCT) and Chest X-Ray Images for Classification, Mendeley Data (2018), V2, doi: 10.17632/rscbjbr9sj.2. [↩]
- Krizhevsky, A., Sutskever, I., & Hinton, G. E.ImageNet Classification with Deep Convolutional Neural Networks.Advances in Neural Information Processing Systems (NeurIPS) (2012), doi:10.5555/2999134.2999257 [↩]
- IBM. What is a confusion matrix? https://www.ibm.com/think/topics/confusion-matrix (2024). [↩]
- IBM. What are classification models? https://www.ibm.com/think/topics/classification-models (2024). [↩]
- Mohammad Salehi, Reza Mohammadi,Hamed Ghaffari,Nahid Sadighi, Reza Reiazi,. Automated detection of pneumonia cases using deep transfer learning with paediatric chest X-ray images. British Journal of Radiology, Volume 94, Issue 1121, 1 May 2021, 20201263, https://doi.org/10.1259/bjr.20201263 [↩] [↩] [↩]
- Sadia Showkat, Shaima Qureshi. Efficacy of Transfer Learning-based ResNet models in Chest X-ray image classification for detecting COVID-19 Pneumonia, Chemometrics and Intelligent Laboratory Systems,Volume 224,2022,104534, ISSN 0169-7439,https://doi.org/10.1016/j.chemolab.2022.104534 [↩] [↩] [↩] [↩]
- Ha, Pham Ngoc and Doucet, Antoine and Tran, Giang Son. Vision Transformer for pneumonia classification in X-ray images, ICIIT ’23: Proceedings of the 2023 8th International Conference on Intelligent Information Technology, Pages 185 – 192, 2023, https://doi.org/10.1145/3591569.3591602 [↩] [↩] [↩]
- Siddiqi, R. and Javaid, S. Deep learning for pneumonia detection in chest X-ray imaging: a comprehensive review, J. Imaging, 10(8), 176, 2024, https://doi.org/10.3390/jimaging10080176 [↩] [↩] [↩] [↩]
- Tawsifur Rahman, Muhammad E. H. Chowdhury, Amith Khandakar, Khandaker R. Islam, Khandaker F. Islam, Zaid B. Mahbub, Muhammad A. Kadir, Saad Kashem. Transfer learning with deep CNN for pneumonia detection using chest X-ray, Appl. Sci. 2020, 10(9), 3233 , https://doi.org/10.3390/app10093233 [↩] [↩] [↩]
- Sasanka Katreddi,Avinash Midatani, Akshara P. Roy,Usha Velpuri,Sujan Kasani. Pediatric pneumonia X-ray image classification: predictive model development with DenseNet-169 transfer learning, Journal of Medical Artificial Intelligence, Vol 8, 2025, doi:10.21037/jmai-24-356 [↩] [↩] [↩] [↩]
- Agniv Roy Choudhury. Pediatric Pneumonia Detection from Chest X-Rays, 2025, https://doi.org/10.48550/arXiv.2601.00837 [↩] [↩] [↩]
- Manoochehr Noghanian Toroghi, Usman Ullah Sheikh and Shima Shahi Irani. Classification of lung opacity/COVID-19 using vision transformers and CNN models on chest X-rays. Journal of Physics: Conference Series, 2023, DOI: 10.1088/1742-6596/2622/1/012016 [↩] [↩]
- Sukhendra Singh, Manoj Kumar, Abhay Kumar, Birendra Kumar Verma, Kumar Abhishek and Shitharth Selvarajan, Efficient pneumonia detection using Vision Transformers on chest X-rays, Sci Rep 14, 2487 (2024), https://doi.org/10.1038/s41598-024-52703-2 [↩] [↩]
- Satoshi Takahashi,Yusuke Sakaguchi, Nobuji Kouno, Ken Takasawa , Kenichi Ishizu , Yu Akagi, Rina Aoyama ,Naoki Teraya, Amina Bolatkan , Norio Shinkai, Hidenori Machino, Kazuma Kobayashi , Ken Asada , Masaaki Komatsu , Syuzo Kaneko, Masashi Sugiyama , Ryuji Hamamoto . Comparison of Vision Transformers and Convolutional Neural Networks in Medical Image Analysis: A Systematic Review, J Med Syst 48, 84 (2024), https://doi.org/10.1007/s10916-024-02105-8 [↩] [↩]
- Naveen Kumar M, Ushasree , Che Fuzlina Fuad. Comparative analysis of pneumonia detection from chest X-ray images using CNN And Transfer Learning, Journal of Data Science,2024, https://iuojs.intimal.edu.my/index.php/jods/article/view/492 [↩] [↩]
- Mustapha B, Zhou Y, Shan C, Xiao Z. Enhanced pneumonia detection in chest X-rays using hybrid convolutional and vision transformer networks, Current Medical Imaging , Volume 21, 2025, doi:10.2174/0115734056326685250101113959 [↩] [↩]
- Fu, M; Tantithamthavorn, C; Le, T. DAViT: A domain-adapted vision transformer for automated pneumonia detection and explanation using chest x-ray images, IEEE Access, vol. 13, pp. 103033-103044, 2025, Doi: 10.1109/ACCESS.2025.3579314 [↩] [↩]
- Md. Rabiul Hasan, Shah Muhammad Azmat Ullah, Sheikh Md. Rabiul Isla. Recent advancement of deep learning techniques for pneumonia prediction from chest X-ray image: datasets, transfer learning, and ensembles, Medical Reports, Volume 7, 2024, https://doi.org/10.1016/j.hmedic.2024.100106 [↩]
- Prashant Singh Basnet, Roshan Chitrakar. CNN-ViT hybrid for pneumonia detection, 2025, https://doi.org/10.48550/arXiv.2509.08586 [↩]