
Abstract
Severe Fever with Thrombocytopenia Syndrome (SFTS), caused by SFTS phlebovirus transmitted primarily by Haemaphysalis longicornis ticks, has emerged as a significant public health concern in Japan since its first confirmed domestic case in 2013. This study examined climatic and environmental factors associated with SFTS incidence across all 47 Japanese prefectures from 2013 to 2025 and explored how projected future climate change may be associated with the geographic pattern of this relationship. Prefecture-level data on monthly mean temperature (April–October), cumulative temperature exposure (CTE; the sum of monthly mean temperatures multiplied by the number of days in each month over the exposure window), precipitation, relative humidity, population, and forest cover rate were compiled from government databases. In a pooled negative binomial regression model with population as an offset, higher CTE, relative humidity, and forest cover rate were significantly associated with higher SFTS incidence (all p<0.001), while precipitation was not independently associated with incidence (p=0.121). The positive association between CTE and incidence remained after adjustment for year fixed effects (incidence rate ratio [IRR] per 100-unit increase, 1.704; 95% CI, 1.595–1.821), but was substantially attenuated and no longer statistically significant after additionally accounting for prefecture fixed effects (IRR, 0.933; 95% CI, 0.728–1.198; p=0.586) or spatial structure (IRR, 0.995; 95% CI, 0.857–1.155; p=0.945), suggesting that the strong ecological association observed in simpler models may largely reflect persistent geographic differences between prefectures rather than within-prefecture annual temperature variation. Spline analysis confirmed a non-linear association between CTE and SFTS incidence (likelihood ratio χ²=34.70, df=2, p<0.001); however, sensitivity analyses indicated that this pattern did not correspond to a robust biological threshold. Applying this fitted exposure–response relationship to future climate scenarios (RCP2.6, historical linear extrapolation, and RCP8.5) suggested a potential northward shift in areas with climatic conditions associated with higher SFTS incidence, particularly under RCP8.5, although these projections should be interpreted as approximate, scenario-based estimates of climate-associated relative risk rather than predictions of future SFTS endemicity or incidence. These findings suggest that the geographic distribution of SFTS in Japan reflects climate in combination with persistent regional ecological characteristics, rather than a simple, independent short-term effect of temperature.
Keywords: SFTS; tick-borne disease; climate change; negative binomial regression; cumulative temperature exposure; ecological study; Japan
Introduction
Severe Fever with Thrombocytopenia Syndrome (SFTS) is an emerging infectious disease caused by SFTS phlebovirus (genus Bandavirus, family Phenuiviridae), transmitted mainly through the bite of Haemaphysalis longicornis ticks1,2. First identified in China in 2009, SFTS was subsequently confirmed in Japan in 2013, with cases initially concentrated predominantly in western and southwestern regions3. More recent nationwide surveillance data have shown a progressive increase in SFTS notification rates and an eastward expansion of reported infection areas. Most reported patients are older adults, and the case-fatality ratio based on national vital statistics has remained approximately 20%4.
Tick activity and survival are strongly influenced by temperature and humidity5,6. Haemaphysalis longicornis, an important vector of SFTSV in Japan, exhibits marked seasonal activity from spring through autumn7, while its development is strongly influenced by ambient temperature8. In Japan, SFTS cases are reported predominantly from late spring through autumn: a nationwide observational study covering 2013–2022 found that 80.8% of cases occurred between May and October, with a peak in May–June9. Studies from China have demonstrated marked geographic variation in SFTS seasonality, with peak incidence ranging from May in several central endemic provinces to June in Shandong and July in Liaoning, consistent with an influence of regional climatic and ecological conditions on the timing of SFTS transmission10. These epidemiological patterns suggest that the thermally relevant exposure window for SFTS transmission begins approximately one month before the main case season—that is, from April onward. Previous studies in East Asia have demonstrated associations between SFTS incidence and meteorological and environmental factors, including temperature, relative humidity, precipitation, and vegetation-related characteristics5,11. However, systematic prefecture-level analyses spanning the full observation period in Japan, incorporating non-linear thermal effects and future climate projections, remain limited.
This study aimed to (1) examine climatic and environmental factors associated with SFTS incidence across all 47 Japanese prefectures from 2013 to 2025 using negative binomial regression, (2) evaluate the robustness of these associations to within-prefecture temporal variation, persistent between-prefecture differences, and spatial dependence by comparing pooled, year fixed-effects, prefecture-and-year fixed-effects, and spatially adjusted models, (3) characterize the functional form of the association between cumulative temperature exposure and SFTS incidence using spline analysis, and (4) explore how projected future climate change may be associated with the geographic pattern of climate-associated SFTS risk in Japan through 2095.
Methods
Data Sources
SFTS case counts by prefecture and year (2013–2025) were obtained from the Infectious Disease Surveillance weekly reports published by the Japan Institute for Health Security (JIHS), formed in April 2025 through the merger of the National Institute of Infectious Diseases (NIID) and the National Center for Global Health and Medicine; surveillance data used in this study were originally compiled under NIID.12 Monthly mean temperatures (April through October), daily mean temperatures used for the GDD sensitivity analyses, precipitation, and relative humidity data for each prefecture were obtained from the Japan Meteorological Agency (JMA) historical climate database. Prefecture-level population data and forest cover rates were obtained from the Statistics Bureau of Japan (e-Stat).
Future temperature projections were obtained separately from prefecture-specific climate projection reports published by the JMA. These reports provide projected temperature changes for the end of the 21st century (2076–2095) relative to the end of the 20th century (1980–1999) under the RCP2.6 and RCP8.5 scenarios. Details of the derivation of future CTE values are provided in the Climate Projections subsection.
Prefectural boundary data used for map visualization and spatial analyses were obtained from the National Land Numerical Information database (Administrative Boundary Data N03-2026) provided by the Ministry of Land, Infrastructure, Transport and Tourism of Japan. Spatial data processing and map visualization were performed in R (version 4.3) using the sf package.
Variable Construction
Cumulative temperature exposure (CTE) for April–October was calculated as the sum of monthly mean temperatures multiplied by the number of days in each month across the seven-month period. Because this measure does not subtract a biological base temperature, it is referred to as cumulative temperature exposure rather than growing degree-days (GDD), which are conventionally calculated relative to a specified base temperature. The April–October window was selected based on two epidemiological observations: (1) approximately 80.8% of SFTS cases in Japan between 2013 and 2022 occurred from May through October, with a peak in May–June9; and (2) recent multicity evidence from China has demonstrated that the effects of meteorological conditions on SFTS incidence may be delayed by approximately 1–2 months11, suggesting that climatically relevant exposure may precede the main seasonal peak in reported human cases. April was therefore included as the effective start of the exposure window. This metric captures the integrated seasonal thermal exposure during the main transmission season. As a sensitivity analysis, conventional growing degree-days (GDD) were additionally calculated from daily mean temperatures as GDD = Σ max(Tdaily mean − Tbase, 0) from April 1 through October 31, using base temperatures of 10.2°C, 11.8°C, and 12.2°C, corresponding to previously reported developmental thresholds for larval moulting, nymphal moulting, and egg hatching, respectively, in H. longicornis8. Relative humidity was averaged across the April–October period. The outcome variable was the annual number of reported SFTS cases in each prefecture. Prefecture-years with no reported SFTS cases were retained as zero counts rather than treated as missing observations.
Statistical Analysis
Because SFTS case counts are non-negative integers with substantial overdispersion relative to a Poisson distribution, a negative binomial regression model was employed13. The natural logarithm of prefectural population was included as an offset to model SFTS incidence rates while retaining annual case counts as the outcome. The pooled model included cumulative temperature exposure (CTE), relative humidity, precipitation, and forest cover rate as predictor variables:
where Yit denotes the annual number of SFTS cases in prefecture i in year t.
Because 47 prefectures were observed repeatedly from 2013 to 2025, observations within the same prefecture are not independent, and pooled estimates may be confounded by stable between-prefecture differences in climate, ecology, and surveillance. We therefore additionally fitted (1) a model incorporating year fixed effects to account for secular temporal trends common to all prefectures, including potential changes in surveillance, diagnostic practices, reporting, and other unmeasured time-varying factors, and (2) a model incorporating both prefecture and year fixed effects, which restricts inference to within-prefecture annual variation and thereby addresses potential confounding by persistent geographic differences between prefectures. Multicollinearity among the explanatory variables was assessed using variance inflation factors (VIFs); for models including year fixed effects, adjusted generalized VIFs [ ] were used14.
To assess spatial dependence, symmetric four-nearest-neighbor spatial weights were constructed using representative geographic coordinates for each prefecture, and Moran’s I was calculated for Pearson residuals from the year fixed-effects model separately for each study year15. As a spatial sensitivity analysis, we additionally fitted a negative binomial generalized additive model (NB-GAM) incorporating a two-dimensional smooth function of prefectural longitude and latitude, together with the climatic and environmental covariates, year fixed effects, and the population offset. Residual spatial autocorrelation was reassessed using Moran’s I after spatial adjustment.
To assess potential non-linearity in the association between CTE and SFTS incidence, CTE was modeled using a natural cubic spline with internal knots at the 35th and 65th percentiles and boundary knots at the 5th and 95th percentiles of the observed CTE distribution in a negative binomial model including year fixed effects16. Model fit was compared between the linear and spline models using a likelihood ratio test. The stability of spline-derived features—the location of maximum slope and the location of the fitted maximum—was evaluated using alternative boundary-knot and internal-knot specifications.
Sensitivity analyses were conducted using alternative seasonal temperature-exposure windows (April–October, May–October, April–September, and May–September), a 1-year lag in CTE, exclusion of Hokkaido and Okinawa, and alternative combinations of climatic and environmental covariates. Because SFTS outcomes were available as annual prefecture-level counts, sub-annual temperature lags that may more closely correspond to the interval between tick activity and human SFTS onset could not be directly evaluated; we therefore examined a 1-year lag as an exploratory analysis only. A zero-inflated negative binomial model was additionally fitted as a sensitivity analysis to assess whether explicit modeling of excess zero counts materially altered the primary estimates or improved model fit. All analyses were conducted in R (version 4.3) using the MASS package for negative binomial regression, the splines package for spline fitting, mgcv for the spatial NB-GAM, spdep for Moran’s I, and pscl for the zero-inflated negative binomial sensitivity analysis.
Climate Projections
Future climate-associated relative risk was explored under three scenarios: RCP2.6, historical linear extrapolation, and RCP8.5. For the RCP2.6 and RCP8.5 scenarios, future temperature projections were obtained from prefecture-specific climate projection reports published by the Japan Meteorological Agency (JMA). These reports provide projected temperature changes for the end of the 21st century (2076–2095) relative to the end of the 20th century (1980–1999) under the RCP2.6 and RCP8.5 scenarios used in the Intergovernmental Panel on Climate Change (IPCC) Fifth Assessment Report17. Prefecture-specific projected temperature changes were used to derive future CTE values under each scenario, with values for intermediate future years estimated by linear interpolation.
As a reference scenario, a historical linear extrapolation was also constructed using prefecture-specific long-term warming rates obtained from JMA historical climate records. These warming rates were extrapolated linearly to derive future CTE values through 2095. This scenario does not correspond to a specific IPCC emissions pathway and was included only as a reference based on historically observed warming trends.
Future CTE values at each time point were transformed through the fitted spline exposure–response function (see Statistical Analysis) to estimate continuous climate-associated relative risk, with the median observed CTE used as the reference (relative risk = 1). Rather than defining discrete temperature thresholds or future endemic zones, these projections represent scenario-based changes in the climate-associated component of the observed prefecture-level ecological relationship and should not be interpreted as predictions of future SFTS incidence, transmission establishment, or endemicity.
Results
Descriptive Statistics
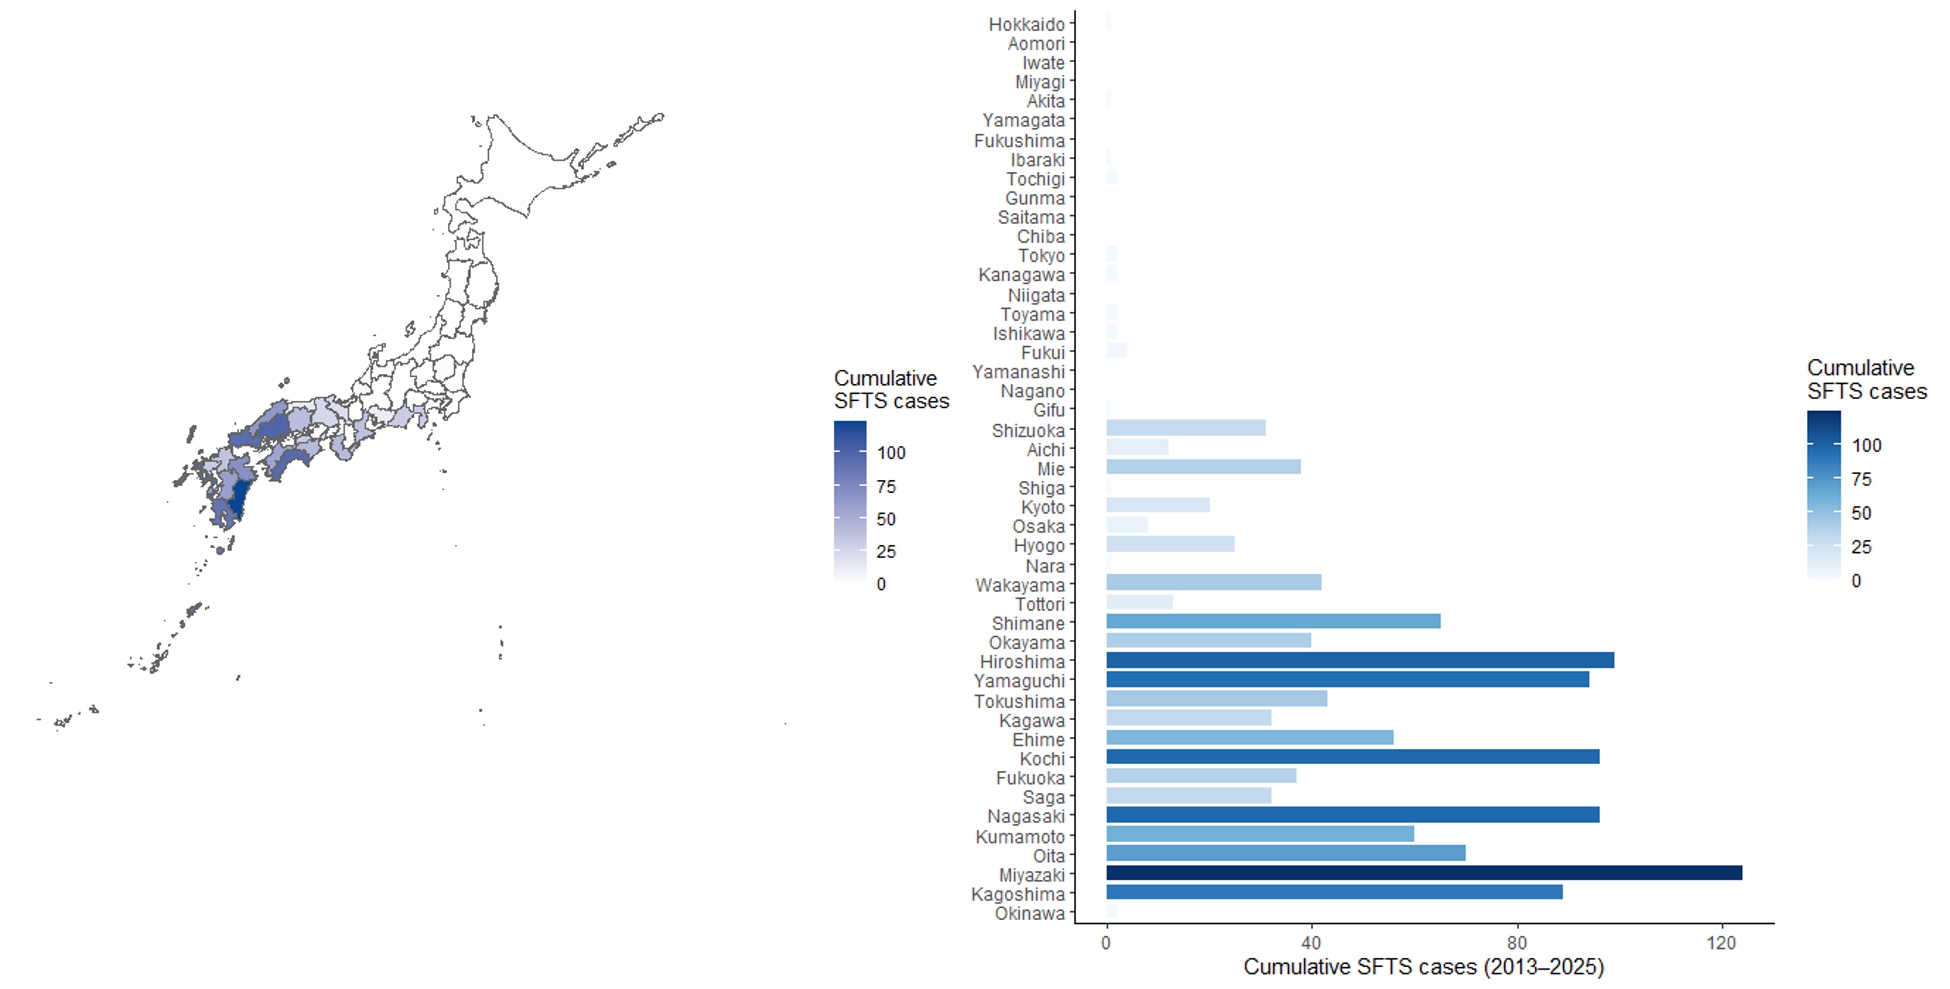
The dataset comprised 611 prefecture-year observations across 47 prefectures from 2013 to 2025. SFTS cases were heavily concentrated in western Japan, particularly in prefectures of the Chugoku, Shikoku, and Kyushu regions, while northern prefectures (Tohoku and Hokkaido) recorded few or no cases throughout the observation period (Figure 1). Cumulative temperature exposure (CTE) ranged from approximately 3,444 (Hokkaido, 2013) to 5,891 (Okinawa, 2024), reflecting the large latitudinal span of the dataset.
Negative Binomial Regression
The pooled negative binomial model identified CTE, relative humidity, and forest cover rate as significantly associated with SFTS incidence, while precipitation was not independently associated with incidence (Table 1). No substantial multicollinearity was detected among the climatic and environmental covariates (VIFs, 1.10–1.58); adjusted GVIFs also remained low (1.07–1.40) after inclusion of year fixed effects.
Because 47 prefectures were observed repeatedly across 13 years, we compared the pooled model with models incorporating year fixed effects and both prefecture and year fixed effects (Table 1). The positive association between CTE and SFTS incidence remained strong after adjustment for year fixed effects (IRR per 100-unit increase, 1.704; 95% CI, 1.595–1.821; p<0.001), indicating that the ecological association was not attributable solely to secular temporal trends common across prefectures. However, after additionally accounting for prefecture fixed effects, the association was substantially attenuated and was no longer statistically significant (IRR, 0.933; 95% CI, 0.728–1.198; p=0.586). A similar pattern of attenuation was observed for relative humidity (IRR, 1.015; 95% CI, 0.965–1.068; p=0.553). Forest cover rate was not separately estimable in the prefecture fixed-effects model because it was time-invariant within prefectures and was therefore absorbed by the prefecture indicators.
These findings suggest that the strong ecological association between CTE and SFTS incidence observed in the pooled and year-adjusted models may largely reflect persistent geographic differences between prefectures, rather than year-to-year temperature variation within individual prefectures. This pattern was reproduced using conventional growing degree-days calculated from daily temperatures across three biologically plausible base temperatures for H. longicornis (10.2°C, 11.8°C, and 12.2°C): higher GDD was consistently associated with higher SFTS incidence in year fixed-effects models (IRRs per 100 GDD, 1.729–1.761; all p<0.001), whereas these associations were not evident after additionally accounting for prefecture fixed effects (IRRs, 0.954–0.964; all p>0.70; Supplementary Table S1).
The positive association between CTE and SFTS incidence in the year-adjusted model was robust to alternative seasonal temperature windows, exclusion of Hokkaido and Okinawa, and alternative covariate specifications (Supplementary Table S2). Results were also robust to explicit modeling of excess zeros18. The ZINB model produced an almost identical CTE estimate to the standard negative binomial model (IRR per 100-unit increase, 1.542; 95% CI, 1.427–1.665; p < 0.001) and did not improve model fit (AIC, 1970.1 vs. 1969.0 for the standard negative binomial model). A 1-year lagged CTE was also positively associated with incidence in the year fixed-effects and prefecture-and-year fixed-effects models, but this association was attenuated after spatial adjustment (IRR, 1.060; 95% CI, 0.913–1.231; p=0.441).
| Variable | Pooled NB | Year FE | Prefecture + Year FE |
| CTE, per 100 units | 1.541 (1.458–1.629), p<0.001 | 1.704 (1.595–1.821), p<0.001 | 0.933 (0.728–1.198), p=0.586 |
| Relative humidity, per 1% | 1.093 (1.051–1.136), p<0.001 | 1.113 (1.069–1.158), p<0.001 | 1.015 (0.965–1.068), p=0.553 |
| Precipitation, per 100 mm | 1.032 (0.992–1.075), p=0.121 | 1.007 (0.965–1.052), p=0.740 | 1.027 (0.994–1.061), p=0.104 |
| Forest cover, per 1% | 1.085 (1.074–1.097), p<0.001 | 1.089 (1.077–1.101), p<0.001 | Not estimable |
Values are incidence rate ratios (IRRs) with 95% confidence intervals. All models included the log of prefectural population as an offset. Model 2 included year fixed effects, and Model 3 included both prefecture and year fixed effects. Forest cover was not separately estimable in Model 3 because it was time-invariant within prefectures and was therefore absorbed by prefecture fixed effects. Fixed-effect coefficients are omitted for clarity. CTE, cumulative temperature exposure; FE, fixed effects; IRR, incidence rate ratio; NB, negative binomial.
Spatial Autocorrelation
Residuals from the year fixed-effects model showed significant positive spatial autocorrelation in 10 of 13 study years, with a mean annual Moran’s I of approximately 0.19 (Supplementary Table S3). In a spatially adjusted negative binomial generalized additive model that additionally incorporated a two-dimensional smooth of prefectural longitude and latitude, the spatial smooth was strongly associated with SFTS incidence (edf=7.98, p<0.001), while the association between CTE and SFTS incidence was further attenuated (IRR per 100-unit increase, 0.995; 95% CI, 0.857–1.155; p=0.945). Following spatial adjustment, significant residual spatial autocorrelation remained in only 3 of 13 years, and the mean annual Moran’s I decreased to approximately 0.006. These findings suggest that persistent spatial heterogeneity—potentially reflecting overlapping geographic patterns in climate, vegetation, vector ecology, wildlife reservoirs, land use, and surveillance—contributes importantly to the strong ecological association observed in the simpler models.
Non-Linear Spline Analysis
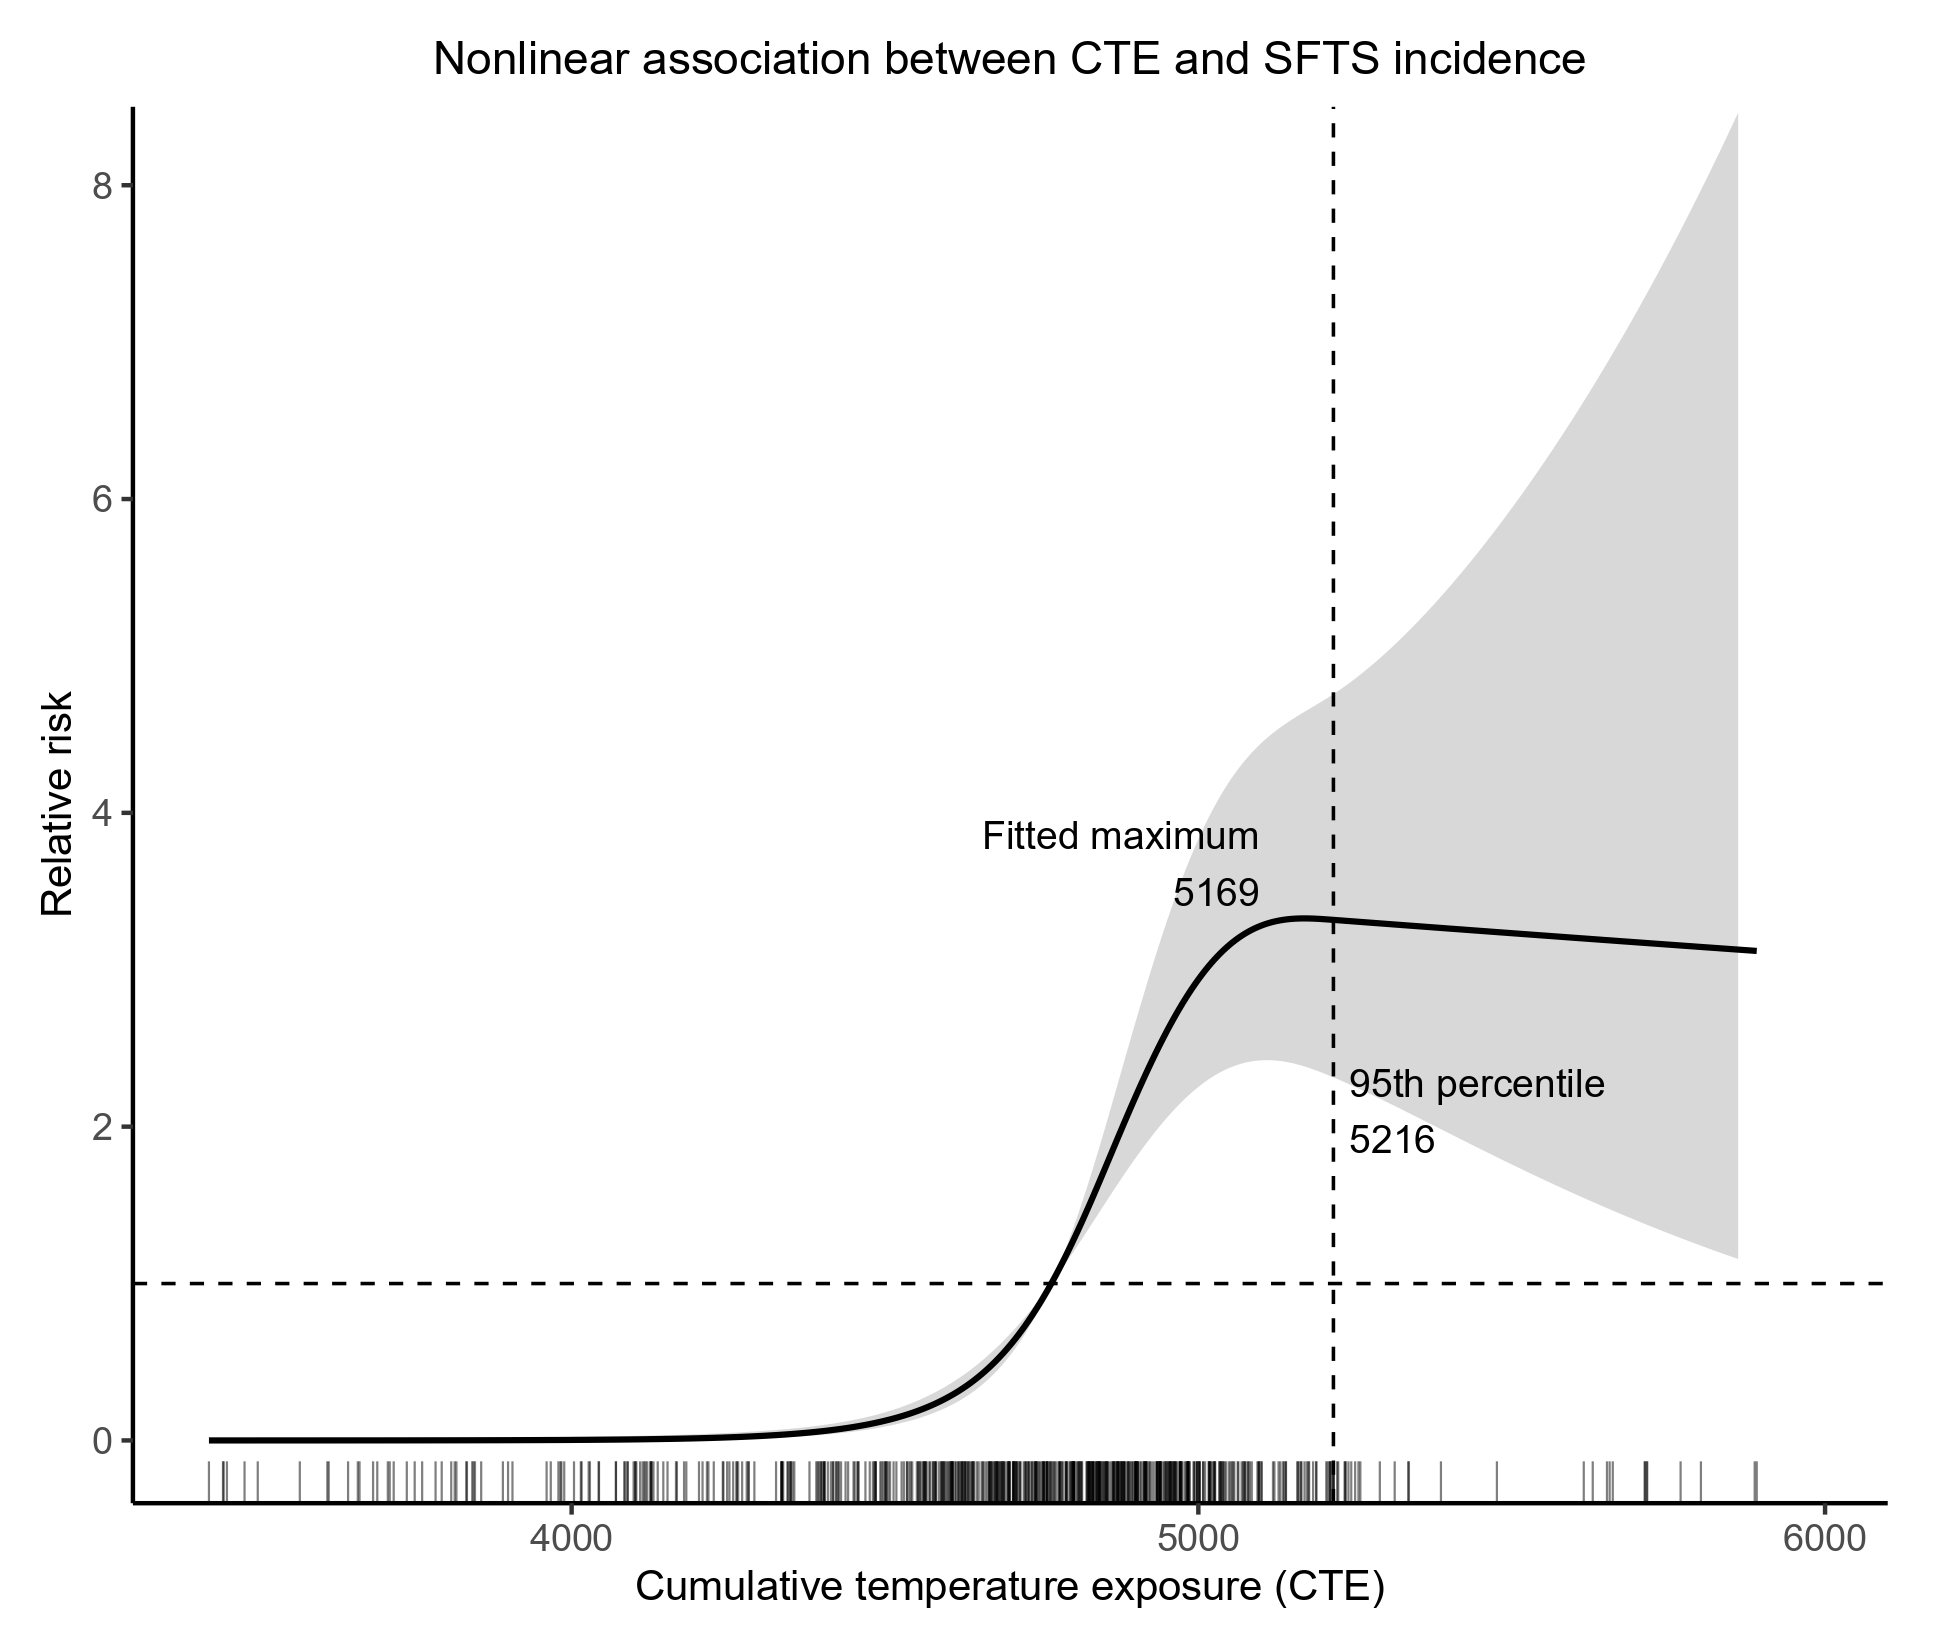
The association between CTE and SFTS incidence was significantly non-linear (likelihood ratio χ²=34.70, df=2, p<0.001; Figure 2). In the primary spline specification, the fitted relative risk reached a maximum at approximately 5,169 CTE units, and this fitted maximum was relatively stable under alternative spline specifications (approximately 5,169–5,211 units). The fitted maximum occurred near the sparsely observed upper tail of the CTE distribution (95th percentile, 5,216 units), where uncertainty in the fitted curve increased. In contrast, the location of maximum slope was sensitive to spline specification and therefore was not interpreted as a robust transition point or biological threshold. No CTE-based categories were used in subsequent analyses.
Future Projections
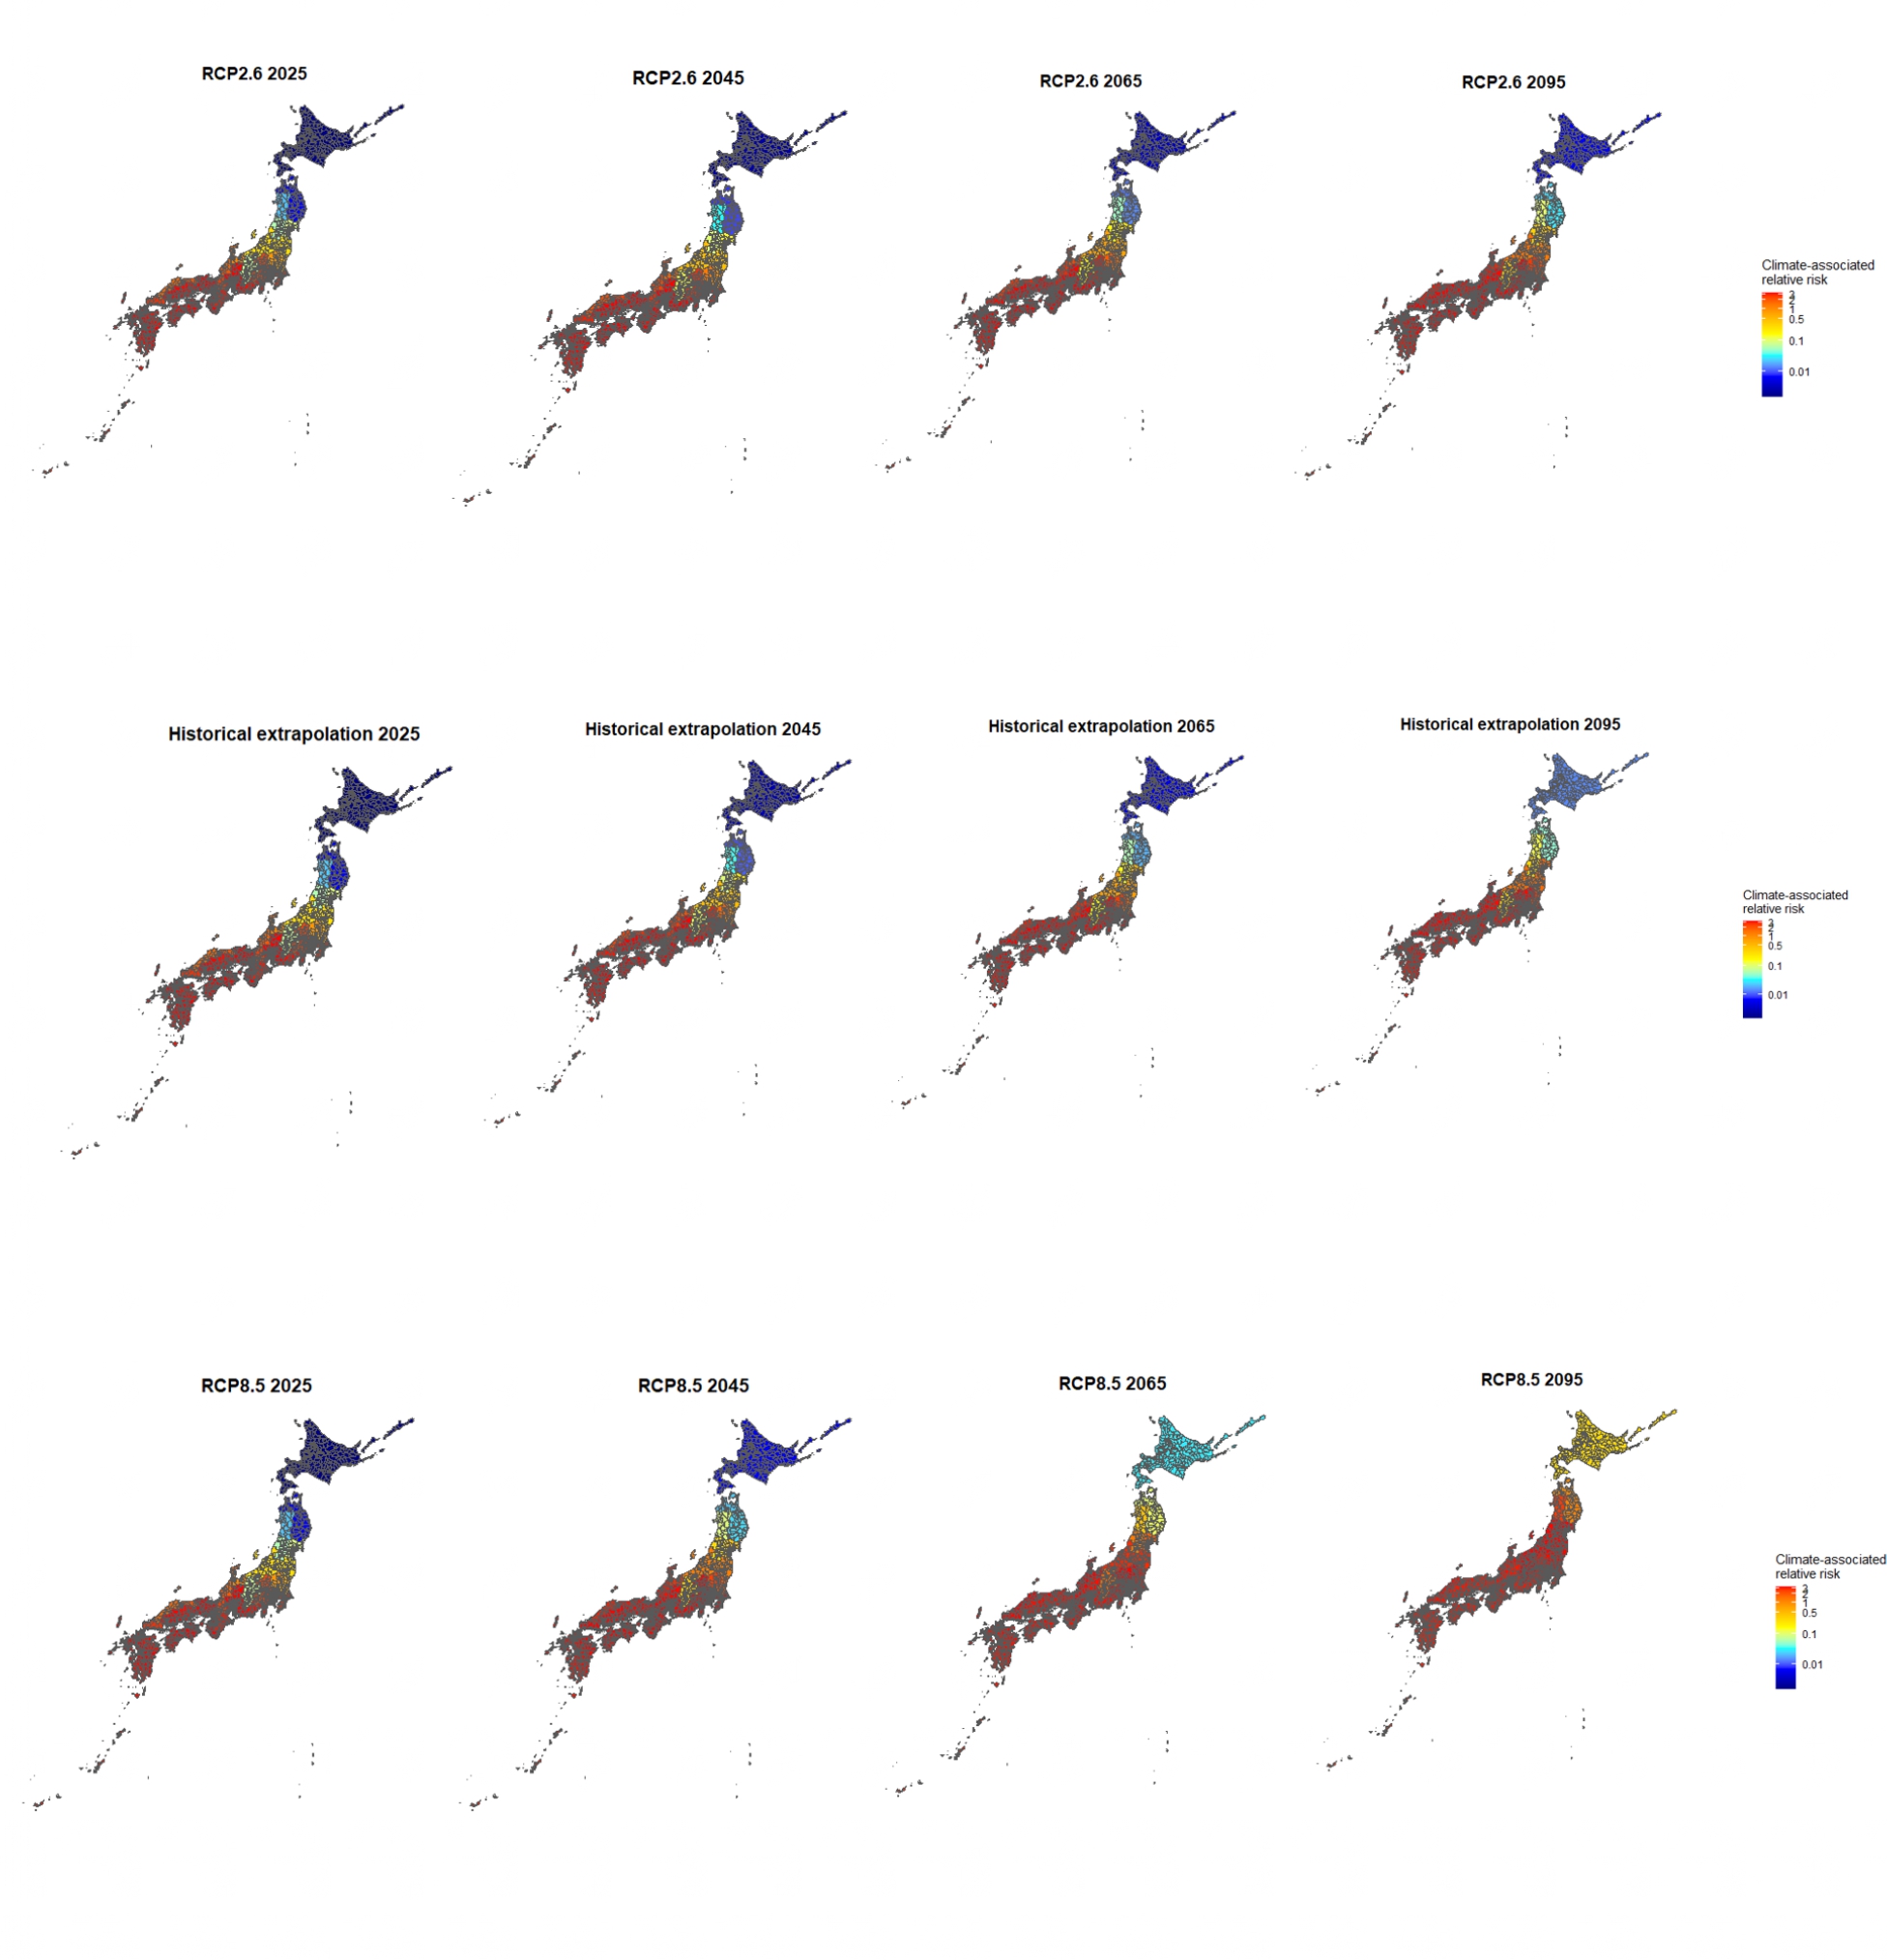
Future CTE values under three climate scenarios (RCP2.6, historical linear extrapolation, and RCP8.5) were transformed through the fitted spline exposure–response function to estimate continuous climate-associated relative risk, referenced to the median observed CTE (relative risk = 1; Figure 3). Under all three scenarios, climate-associated relative risk was projected to increase in prefectures of northern Honshu and Hokkaido over the course of the century, with the extent and timing of this shift differing by scenario: changes were most gradual under RCP2.6, intermediate under the historical extrapolation, and most pronounced under RCP8.5. Prefectures in Kinki, Shikoku, and Kyushu generally remained within relatively elevated ranges of climate-associated relative risk across the scenarios. However, projected CTE values in some prefectures, particularly in later years under RCP8.5, extended into the sparsely observed upper tail of the CTE distribution. Overall, 496 of 1,128 prefecture-year projections (44.0%) exceeded the 95th percentile of the observed CTE distribution (5,216 units), including 223 of 376 (59.3%) under RCP8.5. These estimates should therefore be interpreted as approximate scenario-based patterns of climate-associated relative risk rather than precise forecasts of future SFTS incidence, endemicity, or the timing at which any prefecture will become high-risk.
Discussion
In this prefecture-level ecological analysis of SFTS incidence across Japan from 2013 to 2025, cumulative temperature exposure (CTE), relative humidity, and forest cover rate were significantly associated with SFTS incidence in pooled and year-adjusted models. However, the association between CTE and SFTS incidence was substantially attenuated after accounting for prefecture fixed effects (IRR, 0.933; 95% CI, 0.728–1.198; p=0.586) and after adjustment for spatial structure (IRR, 0.995; 95% CI, 0.857–1.155; p=0.945), and a similar pattern was observed for relative humidity. This pattern was reproduced when CTE was replaced with conventional growing degree-days across three biologically plausible base temperatures for H. longicornis. Together, these findings suggest that the strong ecological association observed in the pooled and year-adjusted models may largely reflect persistent geographic differences between prefectures, rather than providing evidence that warmer-than-usual years within the same prefecture are associated with higher SFTS incidence.
If the observed CTE association primarily reflected a short-term within-prefecture temperature effect, an association would be expected to persist within prefectures across years. That this association was not observed after adjusting for prefecture identity or spatial location suggests that the geographic distribution of SFTS in Japan reflects climate in combination with a broader set of persistent regional ecological characteristics, rather than an isolated, short-term effect of temperature. Recent studies have similarly highlighted geographic heterogeneity in climate–SFTS associations and associations with environmental and land-cover characteristics11. Candidate contributors include the geographic distribution of Haemaphysalis longicornis19, variation in wildlife host communities and associated tick abundance20, and regional differences in land use, agricultural activity, elevation, and other ecological characteristics21. Unmeasured geographic differences in patterns of human–tick contact, surveillance intensity, or access to diagnosis may also contribute to the observed spatial heterogeneity. These measured and unmeasured regional characteristics may also be spatially correlated with climate across Japan. Recent reports of temporally clustered SFTS cases involving both humans and free-roaming domestic cats in Japan further illustrate the potential importance of human–animal–tick interactions within the regional ecology of SFTSV transmission22. Forest cover rate, which remained positively associated with SFTS incidence in the pooled and year-adjusted models but could not be separately estimated once prefecture fixed effects were included (because it was time-invariant within prefectures in our dataset), illustrates this point: rather than confirming a direct biological contribution of forest habitat to disease risk, forest cover at the prefecture level may serve as a marker of broader ecological and geographic conditions, including rurality, land use, wildlife habitat, and elevation, that are also part of this regional ecological context. CTE itself may partly reflect this same regional ecological context rather than acting as an independent short-term climatic driver.
Although the adjusted analyses did not support a simple within-prefecture annual temperature effect, CTE remained a prominent marker of the geographic ecological pattern of SFTS in Japan, and we therefore further characterized the functional form of this association. Spline analysis supported a non-linear ecological association between CTE and SFTS incidence (likelihood ratio χ² = 34.70, df = 2, p < 0.001). The fitted association increased markedly across the central range of observed CTE and reached a maximum in the upper part of the exposure distribution. However, observations were sparse at high CTE values and confidence intervals widened substantially, limiting inference regarding the precise shape of the association in this range. Accordingly, the spline should be interpreted as describing the observed geographic CTE–incidence relationship rather than identifying a biological threshold. Recent multicity evidence from China has similarly demonstrated a non-linear temperature–SFTS association, with substantial geographic heterogeneity in the exposure–response relationship11. Similar findings were obtained using conventional growing degree-days calculated relative to biologically plausible developmental base temperatures for H. longicornis, supporting the robustness of the geographic temperature–incidence association to alternative temperature metrics without implying that tick developmental biology directly determines SFTS incidence.
Because CTE remained a prominent correlate of the geographic pattern of SFTS despite the attenuation observed in the fixed-effects and spatial models, we used the fitted exposure–response relationship to explore how this climate-associated component of the geographic pattern might change under future climate scenarios. Under all three scenarios examined, climate-associated relative risk was projected to increase across parts of northern Honshu and Hokkaido, most gradually under RCP2.6 and most substantially under RCP8.5. These projections represent only the climatic component of the ecological association observed in the present study. Climatic suitability alone does not imply the establishment of SFTSV transmission, which also depends on factors such as the presence and abundance of competent tick vectors, suitable animal hosts, and opportunities for human exposure19,20. The projected maps should therefore not be interpreted as forecasts of future SFTS endemicity or incidence, but as geographic projections of climate-associated relative risk under the fitted ecological model. Uncertainty in these projections should also be considered: later projections under high-emission scenarios frequently extended into the sparsely observed upper tail of the CTE distribution, where uncertainty in the fitted exposure–response relationship was greater, and the historical linear extrapolation scenario does not incorporate physical climate feedbacks. Accordingly, the projected patterns should be interpreted as approximate, scenario-based estimates rather than precise forecasts of the timing or magnitude of future risk.
Because all analyses were conducted at the prefecture level, the observed associations are ecological and should not be interpreted as individual-level effects23. In particular, higher prefecture-level CTE, humidity, or forest cover does not imply that an individual residing in that prefecture necessarily has a higher risk of SFTS. Individual-level risk is likely influenced by factors not captured in this study, including occupational and recreational outdoor exposure, direct contact with ticks and animal hosts, and local land-use conditions24, and individual preventive behaviors. Our findings should therefore be interpreted as describing geographic patterns in SFTS incidence associated with prefecture-level climatic and environmental characteristics, rather than as estimates of individual susceptibility or exposure. The attenuation of the CTE association after accounting for prefecture-specific and spatial heterogeneity further underscores the importance of interpreting these findings at the ecological rather than the individual level.
Our findings are broadly consistent with observations from other regions where climatic conditions have been associated with the geographic distribution of tick habitats and tick-borne diseases. In China, ecological niche modeling has predicted substantially larger suitable habitats for several medically important tick species than their currently documented distributions, suggesting substantial under-detection and the potential for broader geographic occurrence25. More specifically, recent ecological niche modeling of H. longicornis has suggested that climate change may alter and expand the geographic distribution of environmentally suitable habitats for this important SFTSV vector19. Similarly, Hyalomma ticks have expanded their geographic range into previously unaffected and more northerly regions of Europe26,27, while Ixodes scapularis has progressively expanded into Canada and more northerly regions of North America in association with rising temperatures28. Although SFTS is currently endemic mainly in East Asia, regions worldwide that come to share similar climatic and ecological conditions could plausibly become more suitable for SFTSV transmission if competent tick vectors and animal reservoirs are also present; this remains an area for future comparative research rather than a conclusion supported directly by the present ecological analysis.
Several limitations should be acknowledged. First, the RCP2.6 and RCP8.5 scenarios were based on prefecture-specific temperature changes reported in JMA climate projection reports, which are themselves subject to uncertainty, particularly when applied to prefecture-level ecological projections. Intermediate-year values were estimated by linear interpolation and should therefore be interpreted as approximate scenario trajectories rather than year-specific climate forecasts. The historical linear extrapolation assumes that past warming rates continue unchanged through 2095, does not incorporate physical climate feedbacks, and should therefore be interpreted as a reference rather than a physically based projection. Together, these three scenarios illustrate a range of possible changes in the climate-associated component of the observed ecological relationship but do not capture the full uncertainty of future climate trajectories. Second, temperature data were obtained from meteorological stations located at prefectural capitals, and intra-prefectural geographic variation in climate was not accounted for; this may introduce measurement error in CTE estimates, particularly for large or topographically diverse prefectures. Future analyses using gridded climate data (e.g., JMA mesh climate data) would improve spatial resolution. Third, the analysis does not incorporate projections of how forest cover or other land use may change under future scenarios, which could alter habitat availability for ticks. Fourth, although we performed extensive sensitivity analyses, including alternative temperature windows, a 1-year lag, alternative spline specifications, exclusion of Hokkaido and Okinawa, and alternative covariate sets (Supplementary Tables S1–S3), SFTS outcomes were available only as annual prefecture-level counts, precluding evaluation of the sub-annual lag between tick activity and human symptom onset that is likely to be biologically most relevant. Fifth, residual spatial autocorrelation, though substantially reduced, remained significant in 3 of 13 years after spatial adjustment, indicating that some spatially structured confounding may remain unmeasured. Finally, as discussed above, the ecological study design precludes causal and individual-level inference, and residual confounding by unmeasured socioeconomic, behavioral, or ecological factors cannot be excluded.
Conclusion
This prefecture-level ecological analysis found that cumulative temperature exposure, relative humidity, and forest cover rate were associated with SFTS incidence in Japan in pooled and year-adjusted models. However, the association between CTE and incidence was substantially attenuated after accounting for prefecture fixed effects and spatial structure, suggesting that climate should be interpreted as part of a broader, persistent regional ecological context rather than as an isolated short-term driver of incidence. Spline analysis confirmed a non-linear geographic association between CTE and SFTS incidence but did not support a specific biological threshold. Future climate projections based on this fitted association suggest a potential northward shift in areas with climatic conditions associated with higher SFTS incidence, particularly under high-emission scenarios; however, these projections represent potential shifts in the climate-associated component of SFTS geography rather than predictions of future endemicity or individual-level risk. These findings support continued, geographically informed surveillance and tick-avoidance messaging, while underscoring the need for individual-level and multi-factorial ecological data to clarify the mechanisms underlying the observed geographic pattern of SFTS in Japan.
Acknowledgments
The author would like to thank Mr. Takashi Akahane for his kind support and encouragement throughout this study.
Supplementary Information
References
- B. Xu, L. Liu, X. Huang, H. Ma, Y. Zhang, Y. Du, X. Zhu. Metagenomic analysis of fever, thrombocytopenia and leukopenia syndrome (FTLS) in Henan Province, China: discovery of a new bunyavirus. PLoS Pathogens. Vol. 7, pg. e1002369, 2011, https://doi.org/10.1371/journal.ppat.1002369. [↩]
- X. J. Yu, M. F. Liang, S. Y. Zhang, Y. Liu, J. D. Li, Y. L. Sun, D. X. Li. Fever with thrombocytopenia associated with a novel bunyavirus in China. New England Journal of Medicine. Vol. 364, pg. 1523-1532, 2011, https://doi.org/10.1056/NEJMoa1010095. [↩]
- T. Takahashi, K. Maeda, T. Suzuki, A. Ishido, T. Shigeoka, T. Tominaga, T. Yamagishi. The first identification and retrospective study of severe fever with thrombocytopenia syndrome in Japan. Journal of Infectious Diseases. Vol. 209, pg. 816-827, 2014, https://doi.org/10.1093/infdis/jit603. [↩]
- Ohno T, Kato H, Kobayashi Y, Kitaoka M, Kanesaki M, Murai S, Jinushi M, Aoki M, Takahashi T, Shimada T, Kamigaki T, Sunagawa T. Comprehensive epidemiological analysis of severe fever with thrombocytopenia syndrome in Japan, 2013-2023: descriptive observational study. The Lancet Regional Health – Western Pacific. Vol. 65, pg. 101747, 2025, https://doi.org/10.1016/j.lanwpc.2025.101747. [↩]
- G. Lee, H. K. Kim, A. Hidano, S. Jung. Systematic review of environmental factors associated with severe fever with thrombocytopenia syndrome occurrences. Epidemiologic Reviews. Vol. 48, pg. mxag011, 2026, https://doi.org/10.1093/epirev/mxag011. [↩] [↩]
- G. Mo, H. Zhu, J. Li, H. Zhu, Q. Liu. Relationship between meteorological factors and the incidence of severe fever with thrombocytopenia syndrome: a systematic review and meta-analysis. BMC Public Health. Vol. 25, pg. 340, 2025, https://doi.org/10.1186/s12889-025-21527-8. [↩]
- T. Tsunoda. Seasonal change in habitat use by Haemaphysalis longicornis (Acari: Ixodidae): plant, litter, and soil. Journal of Medical Entomology. Vol. 44, pg. 575–579, 2007, https://doi.org/10.1093/jmedent/44.4.575. [↩]
- Y. Yano, S. Shiraishi, T. A. Uchida. Effects of temperature on development and growth in the tick, Haemaphysalis longicornis. Experimental & Applied Acarology. Vol. 3, pg. 73-78, 1987, https://doi.org/10.1007/BF01200415. [↩] [↩]
- S. Fukushima, H. Akazawa, T. Koyama, H. Hagiya. Trends in the incidence of severe fever with thrombocytopenia syndrome in Japan: an observational study from 2013 to 2022. Scientific Reports. Vol. 15, pg. 20715, 2025, https://doi.org/10.1038/s41598-025-07955-x. [↩] [↩]
- F. Y. Ding, H. H. Ge, T. Ma, Q. Wang, M. M. Hao, H. Li, X. A. Zhang, R. J. Maude, L. P. Wang, D. Jiang, L. Q. Fang, W. Liu. Projecting spatiotemporal dynamics of severe fever with thrombocytopenia syndrome in the mainland of China. Global Change Biology. Vol. 29, pg. 6647–6660, 2023, https://doi.org/10.1111/gcb.16969. [↩]
- G. Mo, X. Huo, M. K. Biwott, N. Chang, H. Ji, L. Feng, H. Zhu, Q. Liu. The effect of meteorological factors on severe fever with thrombocytopenia syndrome: evidence from 34 Chinese cities. One Health. Vol. 22, pg. 101295, 2026, https://doi.org/10.1016/j.onehlt.2025.101295. [↩] [↩] [↩] [↩]
- Japan Institute for Health Security (JIHS). SFTS surveillance reports (compiled under the former National Institute of Infectious Diseases [NIID], which merged with the National Center for Global Health and Medicine to form JIHS in April 2025). https://www.niid.jihs.go.jp/, 2025. [↩]
- J. M. Hilbe. Negative binomial regression (2nd ed.). Cambridge University Press, 2011. [↩]
- J. Fox, G. Monette. Generalized collinearity diagnostics. Journal of the American Statistical Association. Vol. 87, pg. 178–183, 1992, https://doi.org/10.1080/01621459.1992.10475190. [↩]
- M. Mohebbi, R. Wolfe, A. Forbes. Disease mapping and regression with count data in the presence of overdispersion and spatial autocorrelation: a Bayesian model averaging approach. International Journal of Environmental Research and Public Health. Vol. 11, pg. 883–902, 2014, https://doi.org/10.3390/ijerph110100883. [↩]
- A. Discacciati, M. G. Palazzolo, J. G. Park, G. E. M. Melloni, S. A. Murphy, A. Bellavia. Estimating and presenting non-linear associations with restricted cubic splines. International Journal of Epidemiology. Vol. 54, pg. dyaf088, 2025, https://doi.org/10.1093/ije/dyaf088. [↩]
- Ministry of Education, Culture, Sports, Science and Technology (MEXT), Japan Meteorological Agency (JMA). Climate Change in Japan 2025: Assessment Report on Observed and Projected Climate Change in the Atmosphere, Land and Oceans. 2025, https://www.data.jma.go.jp/cpdinfo/ccj/index.html [↩]
- G. J. Abiodun, O. S. Makinde, A. M. Adeola, K. Y. Njabo, P. J. Witbooi, R. Djidjou-Demasse, J. O. Botai. A dynamical and zero-inflated negative binomial regression modelling of malaria incidence in Limpopo Province, South Africa. International Journal of Environmental Research and Public Health. Vol. 16, pg. 2000, 2019, https://doi.org/10.3390/ijerph16112000. [↩]
- M. Okely, Z. Chen, E. Adly, M. Kamal. Climate change influences on the potential geographic distribution of the invasive Asian longhorned tick, Haemaphysalis longicornis. Scientific Reports. Vol. 15, pg. 2266, 2025, https://doi.org/10.1038/s41598-025-86205-6. [↩] [↩] [↩]
- H. Iijima, K. Morishima, H. Komine, Y. Watari, K. Doi, K. Okabe. Mammal community composition and season determine the abundance of questing ticks in mountainous forests of central Japan. International Journal for Parasitology: Parasites and Wildlife. Vol. 28, pg. 101120, 2025, https://doi.org/10.1016/j.ijppaw.2025.101120. [↩] [↩]
- K. Liu, H. Zhou, R. X. Sun, H. W. Yao, Y. Li, L. P. Wang, D. Mu, X. L. Li, Y. Yang, G. C. Gray, N. Cui, W. W. Yin, L. Q. Fang, H. J. Yu, W. C. Cao. A national assessment of the epidemiology of severe fever with thrombocytopenia syndrome, China. Scientific Reports. Vol. 5, pg. 9679, 2015, https://doi.org/10.1038/srep09679. [↩]
- R. Oshiro, M. Ihara, C. H. O. Ibrahim, K. Matsui, X. Dalouny, N. H. P. Vu, T. Kurashige, Q. Xu, S. Hu, M. M. N. Tun, Y. Takaki, H. Ogushi, D. Setoguchi, S. Katsuoka, T. Murakami, C. Matsumoto, M. Hattori, N. Hattori, S. Miyamoto, Y. Sakai, T. Suzuki, H. Yamanashi, H. Murota, T. Maeda, K. Morita, A. Yoshikawa, Y. Takamatsu. Emerging multi-source transmission of SFTS virus on a remote Japanese island: a One-Health perspective. International Journal of Molecular Sciences. Vol. 27, pg. 1702, 2026, https://doi.org/10.3390/ijms27041702. [↩]
- S. Piantadosi, D. P. Byar, S. B. Green. The ecological fallacy. American Journal of Epidemiology. Vol. 127, pg. 893–904, 1988, https://doi.org/10.1093/oxfordjournals.aje.a114892. [↩]
- K. Liu, N. Cui, L. Q. Fang, B. J. Wang, Q. B. Lu, W. Peng, H. Li, L. Y. Wang, S. Liang, H. Y. Wang, Y. Y. Zhang, L. Zhuang, H. Yang, G. C. Gray, S. J. de Vlas, W. Liu, W. C. Cao. Epidemiologic features and environmental risk factors of severe fever with thrombocytopenia syndrome, Xinyang, China. PLoS Neglected Tropical Diseases. Vol. 8, pg. e2820, 2014, https://doi.org/10.1371/journal.pntd.0002820. [↩]
- G. P. Zhao, Y. X. Wang, Z. W. Fan, Y. Ji, M. J. Liu, W. H. Zhang, X. L. Li, S. X. Zhou, H. Li, S. Liang, W. Liu, Y. Yang, L. Q. Fang. Mapping ticks and tick-borne pathogens in China. Nature Communications. Vol. 12, pg. 1075, 2021, https://doi.org/10.1038/s41467-021-21375-1. [↩]
- M. M. Parvage, J. N. Baron, J. C. Semenza, A. Omazic. Emergence and spread of Hyalomma ticks and Crimean-Congo haemorrhagic fever in Europe: a systematic review. Parasites & Vectors. Vol. 18, pg. 436, 2025, https://doi.org/10.1186/s13071-025-07104-3. [↩]
- C. Giupponi, H. Jourdan-Pineau, C. Bernard, V. Blanda, M. Bourquia, D. Bru, O. Cabezon, L. Carrera-Faja, J. Espunyes, Y. Gottlieb, C. Joly-Kukla, L. Malandrin, N. Mechouk, A. D. Mihalca, T. Pollet, P. Saengram, A. Torina, F. Valcarcel, Z. Vatansever, L. Vial, A. Zahri, H. Verheyden, K. Huber. Tracking invasion events: phylogeography of Hyalomma marginatum in the Mediterranean basin with a focus on Southern France. Parasites & Vectors. Vol. 18, pg. 407, 2025, https://doi.org/10.1186/s13071-025-06927-4. [↩]
- J. R. Westcott, J. J. Bowden, J. Savage, K. M. Doody. Rapid northward expansion of the blacklegged tick, Ixodes scapularis, in response to climate change. Global Change Biology. Vol. 31, pg. e70591, 2025, https://doi.org/10.1111/gcb.70591. [↩]