Abstract
We analyze 25,876 chart-month entries from the Melon Monthly Top 100 (2000–2023), covering 8,115 unique songs, to quantify the use of English in K-pop lyrics. Percent English is measured at the token level using a transparent multi-script classifier that distinguishes Korean, English, Japanese, Chinese/Han, romanized Korean, and other Latin-script tokens. Korean and English together account for 96.5% of all classified tokens; Japanese, Chinese, and Cyrillic shares are negligible. Mean percent English rises from 7.6% in 2000 to 17.6% by 2010 and 34.2% in 2023, with a sharp post-2020 inflection: the share of charting entries above 50% English reaches 36% in 2023, compared with 10% in 2020. Genre differences are pronounced: mean percent English is 30.1% in Dance/EDM, 21.5% in Rap/Hip-Hop, and 4.8% in Ballad/OST. After controlling for chart year, genre, and Korean-versus-foreign artist status in a song-level regression (n = 8,115), percent English shows only a marginal association with chart rank (β = 0.064, 95% CI [0.028, 0.100], p < 0.001). The effect is statistically detectable but practically trivial in magnitude. We conclude that while English content in charting K-pop has grown substantially over two decades, percent English is not a meaningful predictor of chart performance in the domestic Korean market.
Keywords: K-pop; Melon chart; lyrics; code-switching; genre; regression; time series.
Introduction
In the final decades of the 20th century, most lyrics of mainstream Korean pop music were primarily in Korean. During the same time frame English appeared primarily in terms of sporadic use (as single words or short phrases) in K-pop music. The past twenty plus years has seen K-pop expand to include a globalized cultural market; quantitatively there is significant evidence that demonstrates an increase in English lyrics throughout that timeframe1,2. Common examples of English phrases used in the titles and chorus lines of K-pop songs are “Sorry, Sorry,” and “I love you.” These types of phrases are now becoming more widespread as K-pop artists target global audiences by using on-line media as platforms to allow them to reach and share their music globally3,4. Most scholars refer to this type of language blending as a form of code mixing. When a K-pop artist uses English within a song it does so to indicate modernity and style and global appeal, but also NOT to translate for non-Korean audiences5,6,7.
There are few studies (large scale) to measure the amount of English being used and how the use of English has changed from decade to decade, although many studies exist about how K-Pop uses “English” as part of its musical and cultural elements. Many studies of K-Pop’s language mixing are qualitative in nature or based on small sample sizes; therefore, most studies focus on how “English” is utilized with music and what the utilization of “English” means in terms of culture5,6,8,9. In addition, previous longitudinal analysis using large samples of charted song data in multiple music markets demonstrate that the quantifiable aspects of charted songs change from decade to decade10. However, there does not exist any similar longitudinal panel analysis using K-Pop chart-month data. Therefore, this project seeks to address this void through systematic analysis of a large corpus of K-Pop lyric data related to English usage trends during different periods of time.
The objective of this research is to examine how extensively, as well as how English language utilization has evolved within K-Pop song lyrics for the time period of 2000 through 2023. The main research questions are: (1) In what way have percentages of English utilized in popular K-Pop songs, changed during the last twenty years? (2) Do various styles of music and/or artist groups (i.e., idol dance groups compared to ballad singers) utilize English in their lyrics at greater rates than others, or follow similar trends? (3) Are there associations between an individual song’s success/popularity (chart ranking) and the amount of English that they utilize in their lyrics?
This research is about analyzing K-pop songs (which are popular) that were #1 hits on the charts in South Korea since 2000 through 2023, and excludes the underground scenes. The analysis will be done by measuring how often you see English being used within each song’s lines to allow for better capture of intra-line switching; while it also monitors the amount of time you see Korean and limited amounts of time you see Japanese, Han/Chinese and Cyrillic scripts. However, there is a limit with this research when identifying proper nouns that use the Roman alphabet (English), or if an orthographic script can accurately identify what language it represents. Lastly, this research will have a legacy measure to evaluate the line-level data to serve as a sensitivity check.
The authors are based on Sociolinguistics in terms of Code-Switching and Code-Mixing, and by how English has become a symbolic Resource in Global Popular Culture7,11,12. When K-Pop emerged onto the world stage as an International Phenomenon, it used English Lyrics to show its Modernity and Orientation to the World as a whole. The Authors’ Commitment to this Theory translates into Three Testable Hypotheses about the Chart Month Corpus. If English functions as a marker of globalization, then the percentage of English in charted K-pop lyrics should rise over time, and faster after the platform-globalization period (after 2010), owing to streaming-driven international targeting3,13. If English serves as a genre marker for performance-oriented, internationally facing styles, then English use should be systematically higher in Dance/EDM and Rap/Hip-Hop than in ballads. Finally, if English in lyrics signals an artist’s orientation rather than determining domestic chart success, then English percentage should not strongly predict domestic chart position.
Three hypotheses have been formally developed based upon theoretical expectations for the 2000-2023 Melon Monthly Top 100 corpus. The first hypothesis (H1) is that there will be an increasing trend in the average percentage of English words used in kpop songs during a given time period, especially from 2020 forward. The second hypothesis (H2) is that there is variation in the average amount of English used in different genres, with the highest amounts of English use found in dance/edm and rap/hip hop versus ballad/ost. The third hypothesis (H3) is that when controlling for factors like year of release and artist status, there will be at most a very small relationship between the percentage of English and ranking position on Melon charts; coefficients may be statistically detectable, but their practical size is expected to be tiny.
Methods
Study Design
This study is a longitudinal, non-experimental, observational content analysis of K-pop lyrics. It uses existing chart records and lyric text to quantify English usage over time, without manipulating any variables. Descriptive results are reported at the chart-month-entry level (one row per song per chart month). The correlation and regression analyses are reported at the unique-song level (one row per song), so that the same song appearing on the chart over many months is not counted as many independent observations.
Dataset
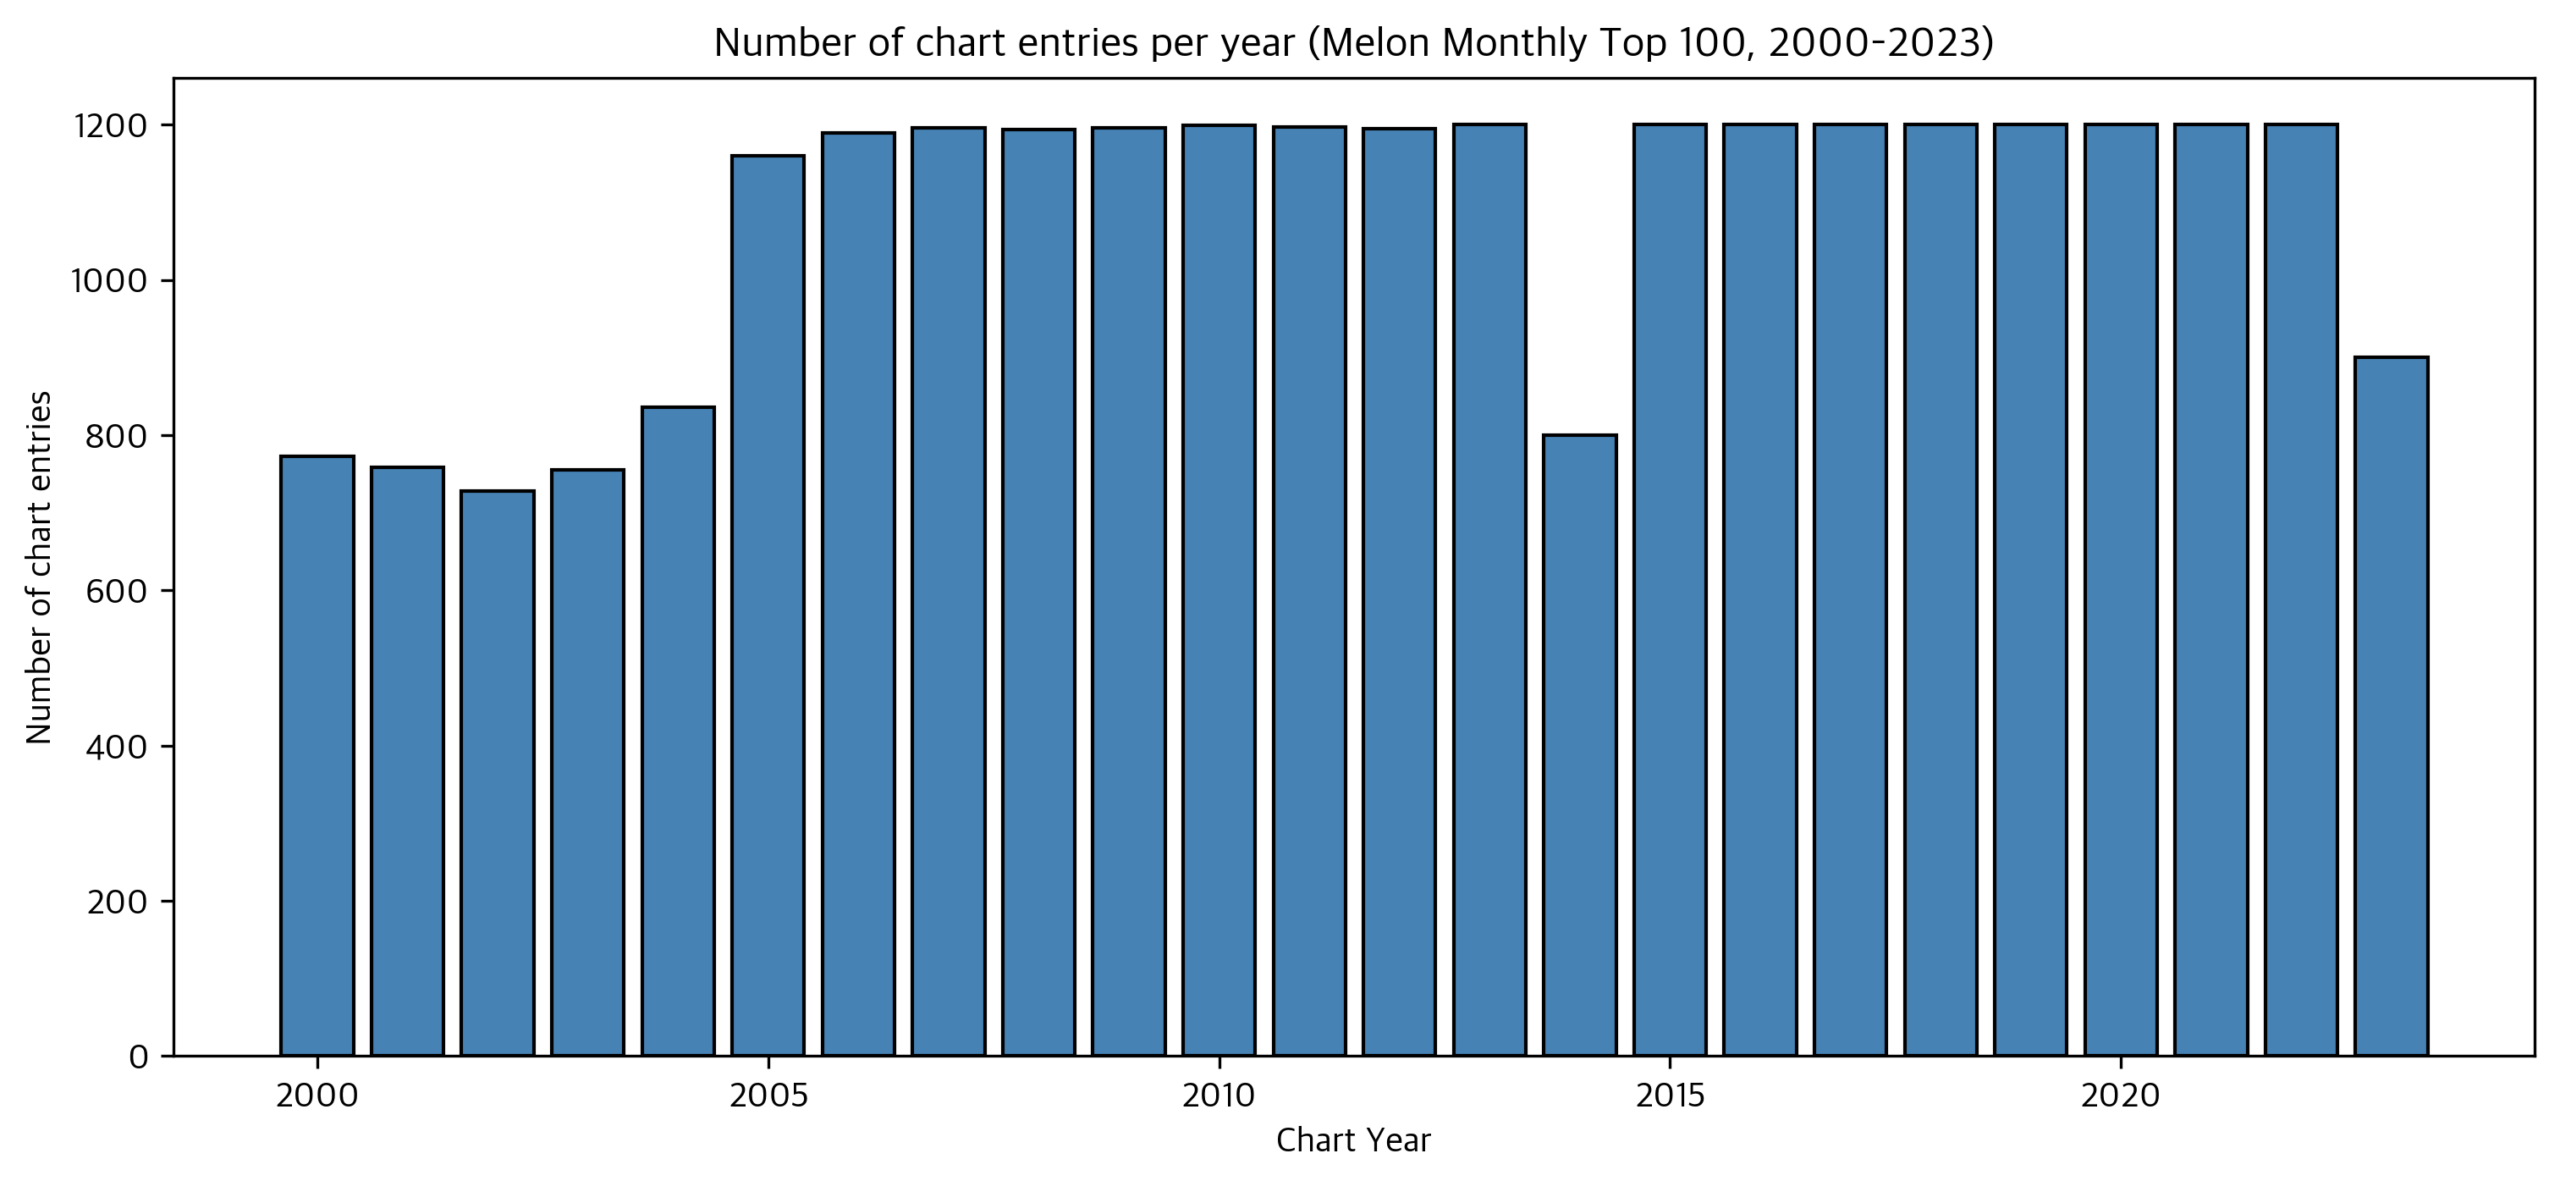
The dataset used for analysis is EX3exp’s Kpop-lyric-datasets, built from monthly Korean music chart records spanning January 2000 through October 2023. Each row represents a song’s appearance in a specific chart month (i.e., a “chart-month entry”), and includes metadata such as song title, artist, genre, release date, chart year/month, and rank, along with lyric-derived variables such as number of lyric lines and percent English. The dataset contains approximately N=25,876 chart-month entries, representing 8,115 unique songs (because the same song can reappear across multiple consecutive months while it remains on the chart)14. Some months/periods may have incomplete chart coverage in the underlying chart archive; all year-level summaries in this study are computed using the months available in the dataset (rather than assuming full coverage for every year), as seen in Figure 1.
Percent English
Percent English is defined as the percentage of lyric tokens classified as English: (number of English tokens ÷ total classified tokens) × 100. Each lyric line is split on whitespace into tokens, and each token is classified by its Unicode script. Hangul tokens are counted as Korean. Latin-script tokens are checked against an English wordlist and against a small blocklist of common romanized Korean forms, and counted as English, romanized Korean, or “Latin-unknown” accordingly. Tokens in Japanese kana, CJK Han, Cyrillic, or mixed scripts are counted separately. Across the dataset, these non-English / non-Korean categories together account for less than 1% of all classified tokens, so we report English and Korean as the analytical focus. The full classifier, wordlists, and source code are bundled with the supplementary materials.
As a sensitivity check, the same lyrics were also processed with the older line-level langdetect classifier15 used in an earlier version of this work. The two methods give strongly similar yearly trends and the qualitative findings hold under both; the token-level numbers are 1–4 percentage points higher in each year because the new method counts English content inside lines that mix Korean and English, which the older method collapsed into one label per line. Two limitations of the method should be noted: English proper nouns absent from the wordlist (like “Tokyo” or “Hollywood”) are not counted as English, and romanized Korean not in the small blocklist may be misclassified as Latin-unknown. See Supplementary Figure S5 for the legacy-vs-new comparison.
Variables
The dataset includes genre (categorical), artist, release date, and chart rank (ordinal: 1 = highest rank). Time variables (chart year and chart month) were used to compute monthly and yearly summaries. A binary foreign-artist flag is set to True for entries whose artist name contains no Hangul characters and whose raw genre tag matches POP or J-POP without Korean-genre indicators (가요, 국내); 349 of 25,876 chart-month entries (99 unique songs) carry this flag and are typically Western chart-crossovers.
Preprocessing
The source data has some inconsistencies with regard to its genre labels as well as an excessive amount of granularity. In addition, most song files have multiple genre tags listed together in a single string (” 발라드, 국내드라마”, for instance, or ” 댄스, 랩 / 힙합 “). These tags must be made comparable by mapping them to one of nine broad categories via a keyword- prioritized rule. The categories include Ballad/OST, Dance/EDM, Rap/Hip-Hop, R & B/Soul, Rock, Indie/Folk, Trot, Pop, and Other. This ordering of the rules is important since many songs will contain multiple genre tags; therefore Ballad/OST is given precedence when checking for secondary tags. The complete keyword map is included in the Supplementary Code.
The top-100 rank was used to determine which data points were eliminated from consideration. Although the top-100 is a high enough threshold to exclude some of the lower-ranked songs; there are no songs whose rank falls outside of it. Once the data was bucketed by “song_id”, the token level classification model described in section 2.3 was run against each “song_id” classifying each song_id only once and reusing the result across chart months, to avoid classifying the same lyrics multiple times.
Statistical Analysis
All processing and analysis were performed in Python, using Pandas16 for data manipulation, Matplotlib17 for visualization, and SciPy and statsmodels for inferential statistics.
Descriptive summaries were computed at four aggregation levels. Time trends were summarized monthly and yearly using both mean and median percent English (Figure 3). Distributional change was examined through year-by-year distributions of the per-song percent-English measure. Genre comparisons used mean and median percent English by broad genre bucket (Figure 4). Chart-performance associations were assessed with Pearson and Spearman correlations between percent English and the rank-based performance score (101 − rank), with 95% bootstrap confidence intervals.
Correlations were computed at two units of analysis. The chart-month-entry level (n = 25,876) is reported for continuity with prior chart-based studies. The unique-song level (n = 8,115), where each song contributes a single observation, is the primary inferential unit because it removes the non-independence introduced by songs that stay on the chart for multiple months. Each song’s observation summarizes its mean percent English (averaged across its chart-month appearances) and its best (lowest) chart rank.
To assess whether percent English retains explanatory value for chart rank after controlling for plausible confounders, an ordinary-least-squares regression was fit at the unique-song level. The dependent variable is best chart rank. The predictors are percent English, chart year, genre bucket (categorical), and foreign-artist status (binary). Coefficients, 95% confidence intervals, and p-values are reported for the focal predictor. For the Korean-only sensitivity analysis, the same regression was also fit on the subset of songs with foreign_flag = False (n = 8,016).
Where two-group comparisons were reported (for example, Top 10 vs Rank 11–100 chart entries by year), Cohen’s d was computed as a standardized effect size to quantify practical magnitude beyond raw mean differences18. Cohen’s conventional benchmarks for interpreting d were used: small ≥ 0.2, medium ≥ 0.5, large ≥ 0.8. Each reported d in the Results is labeled according to these benchmarks.
Results
On average across the 25,876 chart-month entries, lyric tokens are overwhelmingly Korean or English: 80.55% Korean Hangul and 15.93% English. The remaining script categories (Japanese kana, CJK Han, Cyrillic, romanized Korean matched to the blocklist, Latin-script tokens not in either wordlist, and mixed-script tokens) together account for about 1% of all tokens. The percentages above do not sum to 100 because 2.47% of chart-month entries (638 rows) contain no classifiable lyric tokens at all: these are typically instrumental tracks or songs whose lyrics are missing from the source archive, and they contribute zero to every per-script average. The full breakdown is shown in Figure 2. The analysis below is therefore reported as a contrast between Korean and English; Japanese and other languages are too sparse in this corpus to support separate claims.
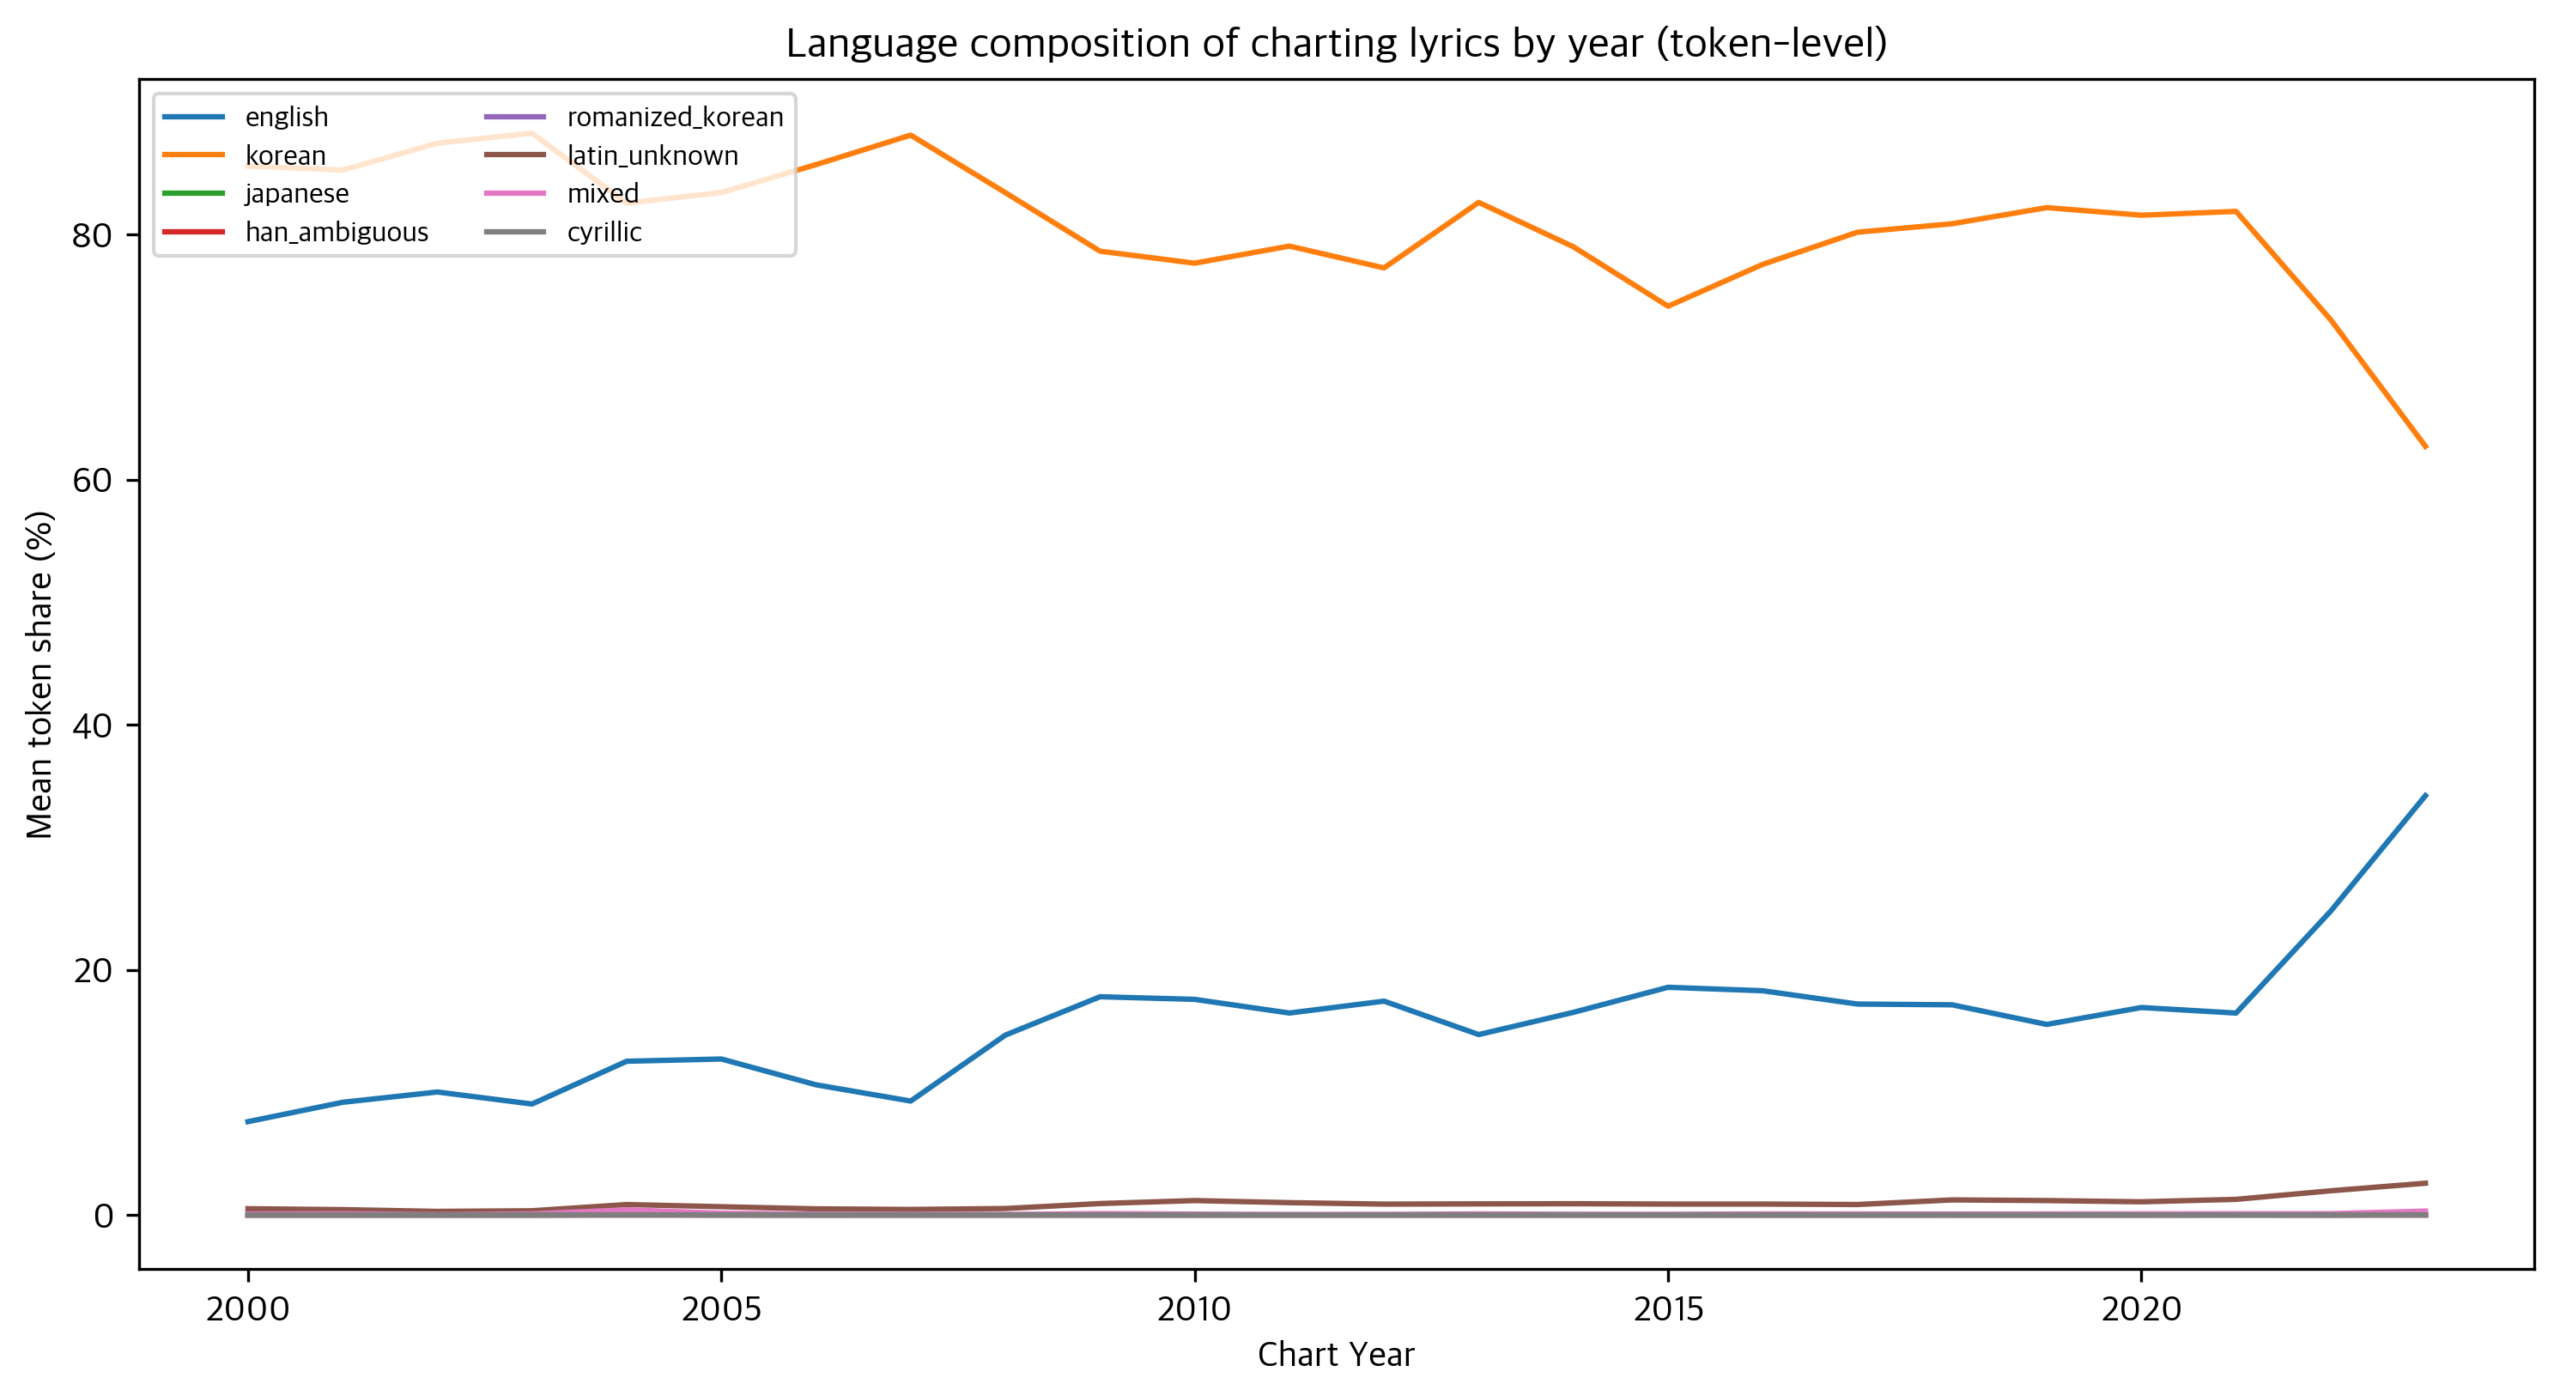
The inclusion of English lyrics in Korean charting songs increased over the 2000–2023 period. Across the dataset, English usage rises over time, but the distribution remains highly skewed: many songs contain little to no English, while a smaller subset contains substantial English. This is reflected by the mean percent English generally being higher than the median percent English in the same year/month (Figure 3).
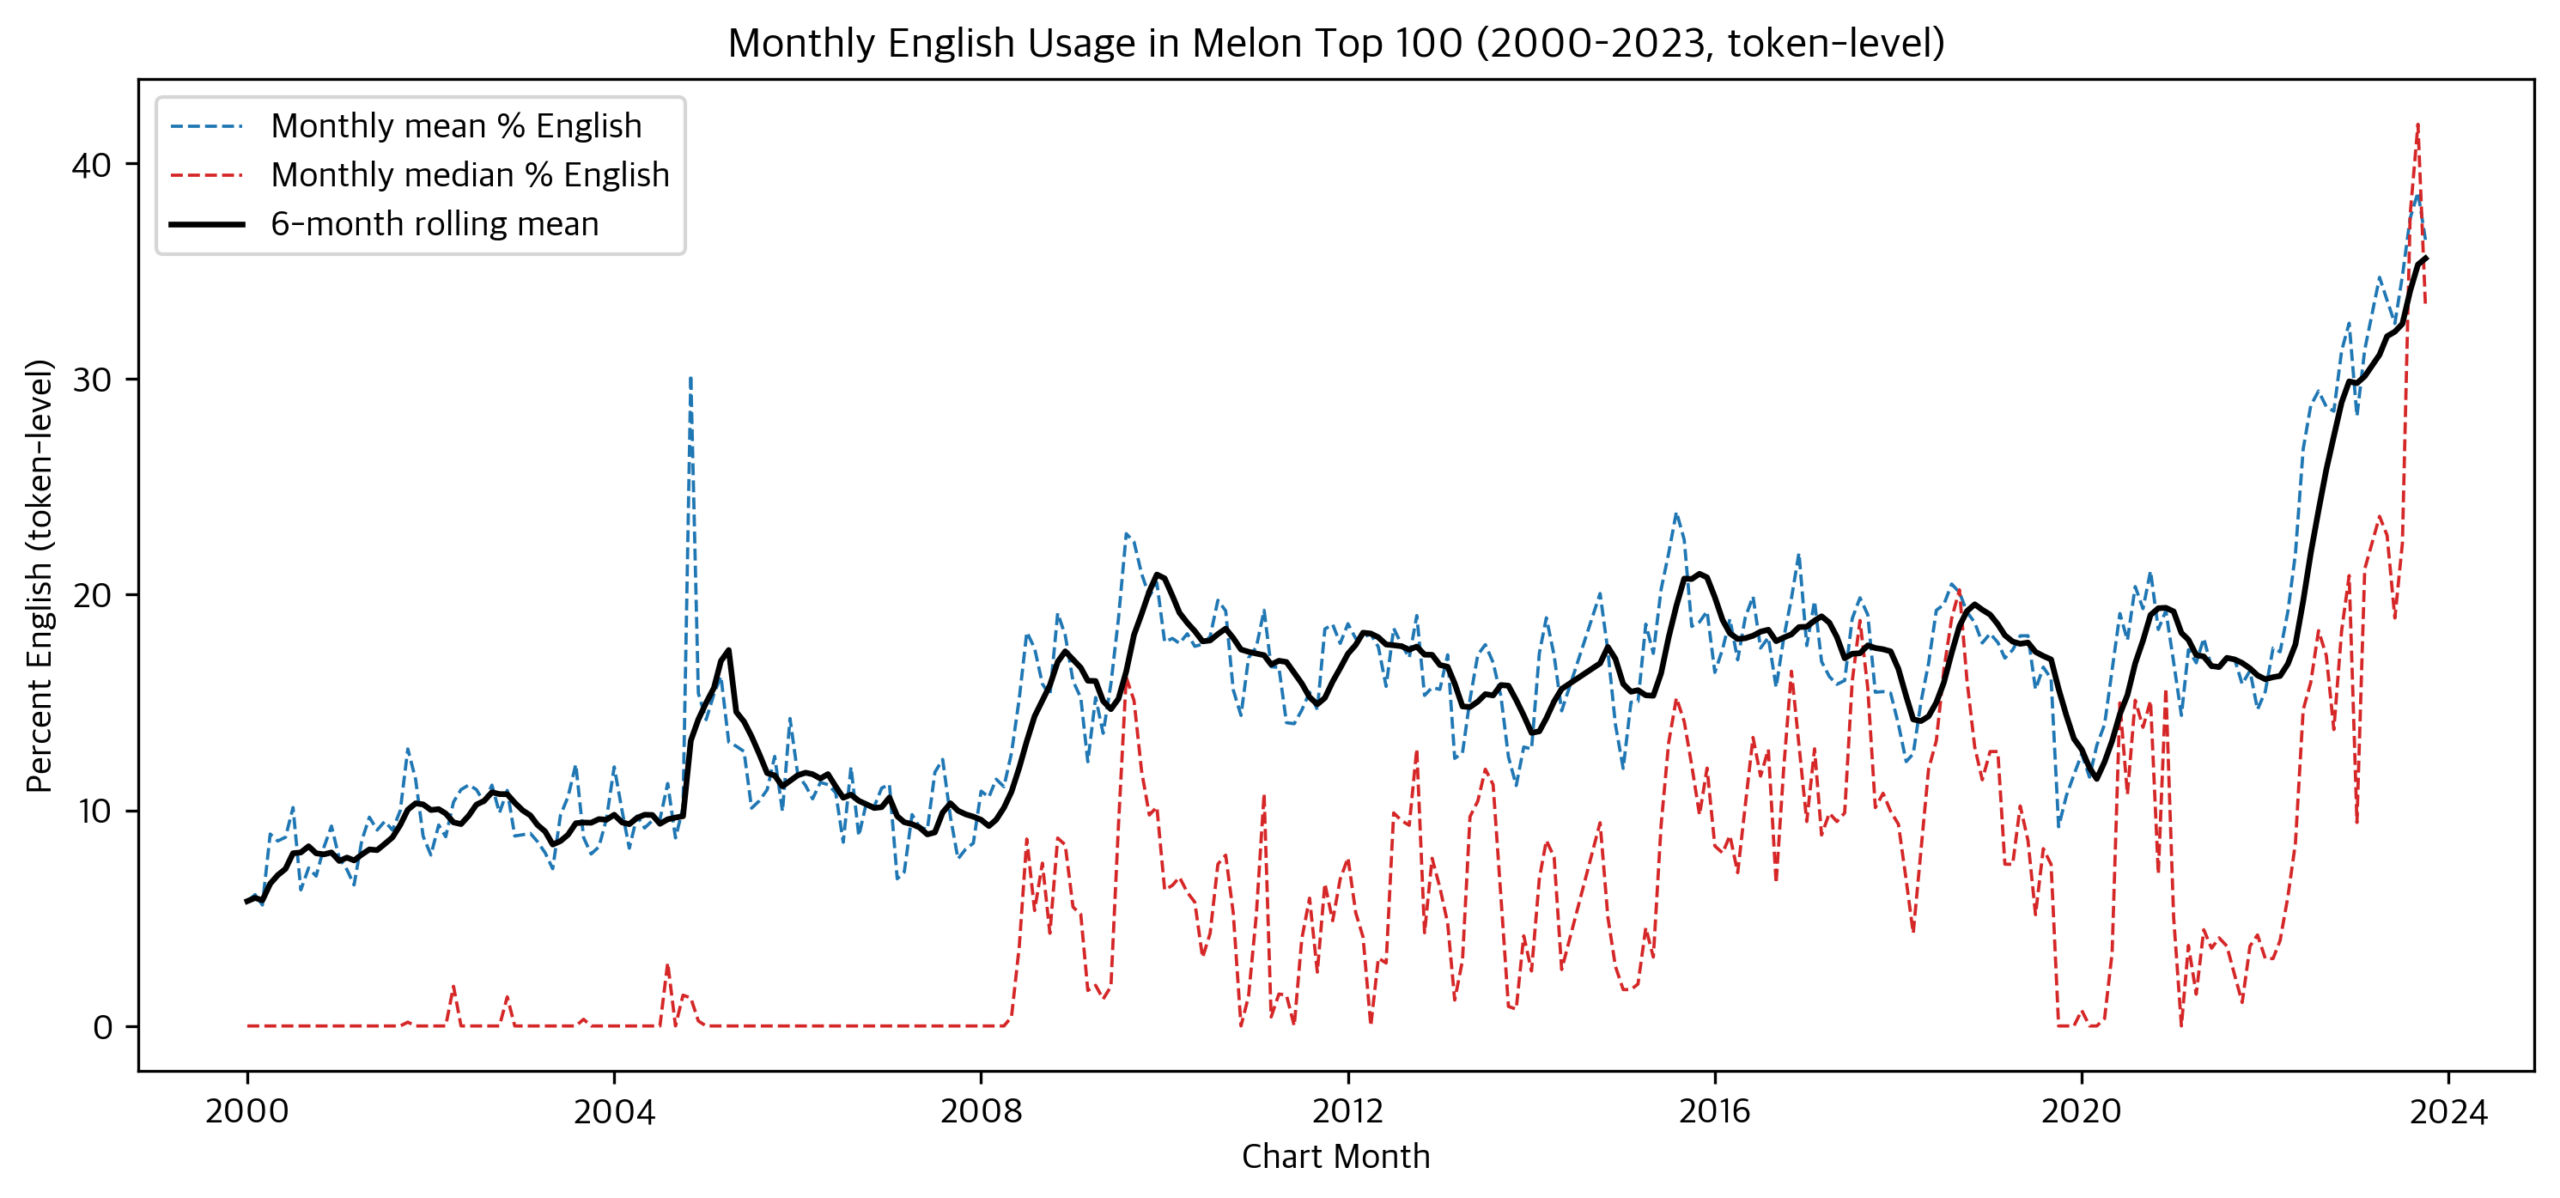
Figure 3 shows the time trend in percent English for charting songs from 2000–2023. Mean percent English rises from 7.6% in 2000 to 17.6% in 2010 and 34.2% in 2023, with the steepest acceleration after 2020. The median stays low for long periods because a large fraction of songs cluster near 0% English, even as some songs include noticeably more English. Over time, the upper tail becomes larger, meaning that “English-heavy” songs become more common.
Several short-term spikes appear in the trend line (e.g., around 2008 and in later years). These spikes indicate months where a larger share of charting songs included higher English content than typical for that period. The analysis treats these spikes as descriptive features of the data; potential explanations (e.g., industry shifts or global distribution patterns) are discussed later rather than interpreted as causal results here.
In addition to the upward movement in mean/median values, the number of songs that are English-heavy (defined here as >50% of lyric tokens classified as English) increases over time. In early years, English-heavy songs appear rarely (often zero in many months). In later years, English-heavy songs appear more frequently in the monthly charts.
The share of chart entries with more than 50% English lyric tokens remained low across 2015–2018 (11.83% in 2015, 7.83% in 2016, 4.83% in 2017, and 4.33% in 2018; mean across the four years = 7.21%) and then rose sharply to 21.67% in 2022 and 36.11% in 2023.
These changes indicate that the long-run increase is not only a gradual rise in small English insertions, but also an increased presence of songs that are bilingual-dominant or largely English.
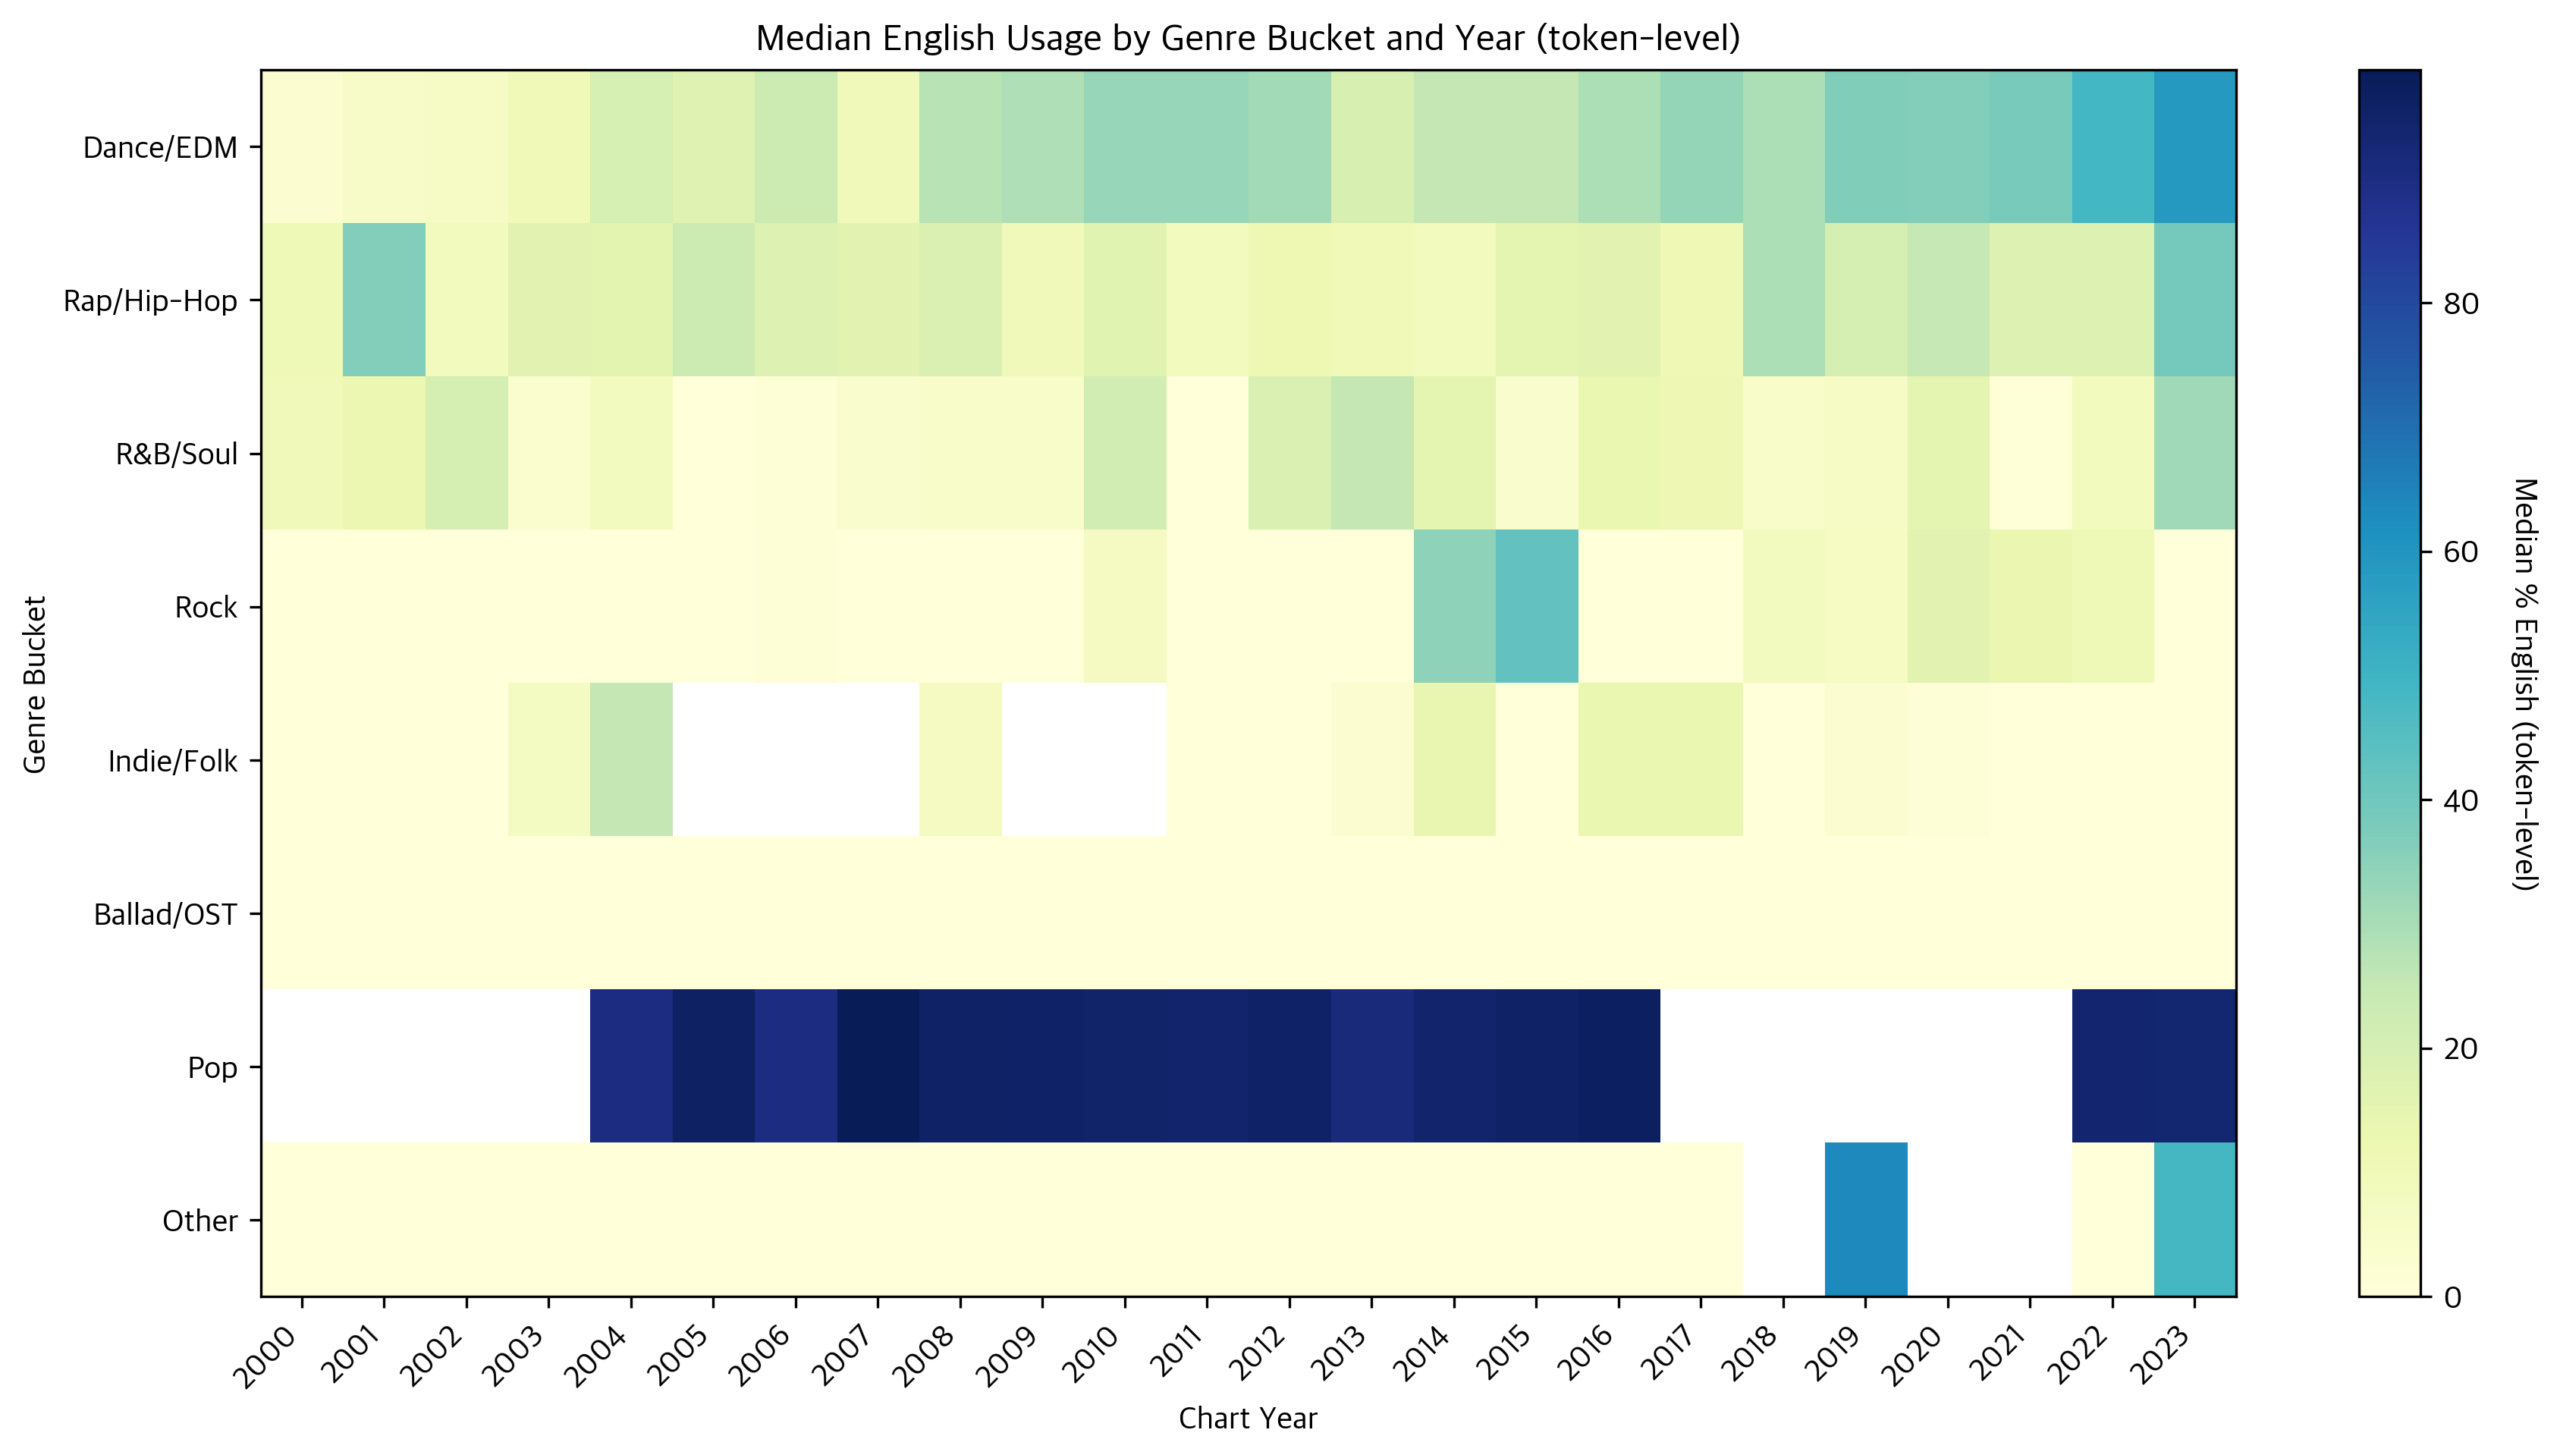
Figure 4 shows strong genre-based differences in English lyric usage. Genres associated with faster, performance-oriented tracks tend to show higher English percentages, while slower or more lyric-focused genres tend to show lower English percentages.
In the dataset, Dance and Rap/Hip-hop categories consistently show higher percent English than Ballads. R&B/Soul and Rock/Metal tend to fall between these extremes.
By broad genre buckets, the mean (median) percent English was 30.13 (28.67) for Dance/EDM, 21.49 (17.52) for Rap/Hip-Hop, 17.74 (7.67) for R&B/Soul, 12.90 (0.00) for Rock, 11.87 (2.00) for Indie/Folk, and 4.83 (0.00) for Ballad/OST. Bucket sample sizes were Dance/EDM n = 6,217, Rap/Hip-Hop n = 3,455, R&B/Soul n = 2,072, Rock n = 1,838, Indie/Folk n = 440, Ballad/OST n = 10,870, Pop n = 350, and Other n = 463.
When trends are examined within genre over time (Figure 4), the increase after the mid-to-late 2010s is most visible in Dance and Hip-hop categories. Ballads remain relatively low overall, though they may show smaller upward movement in recent years.
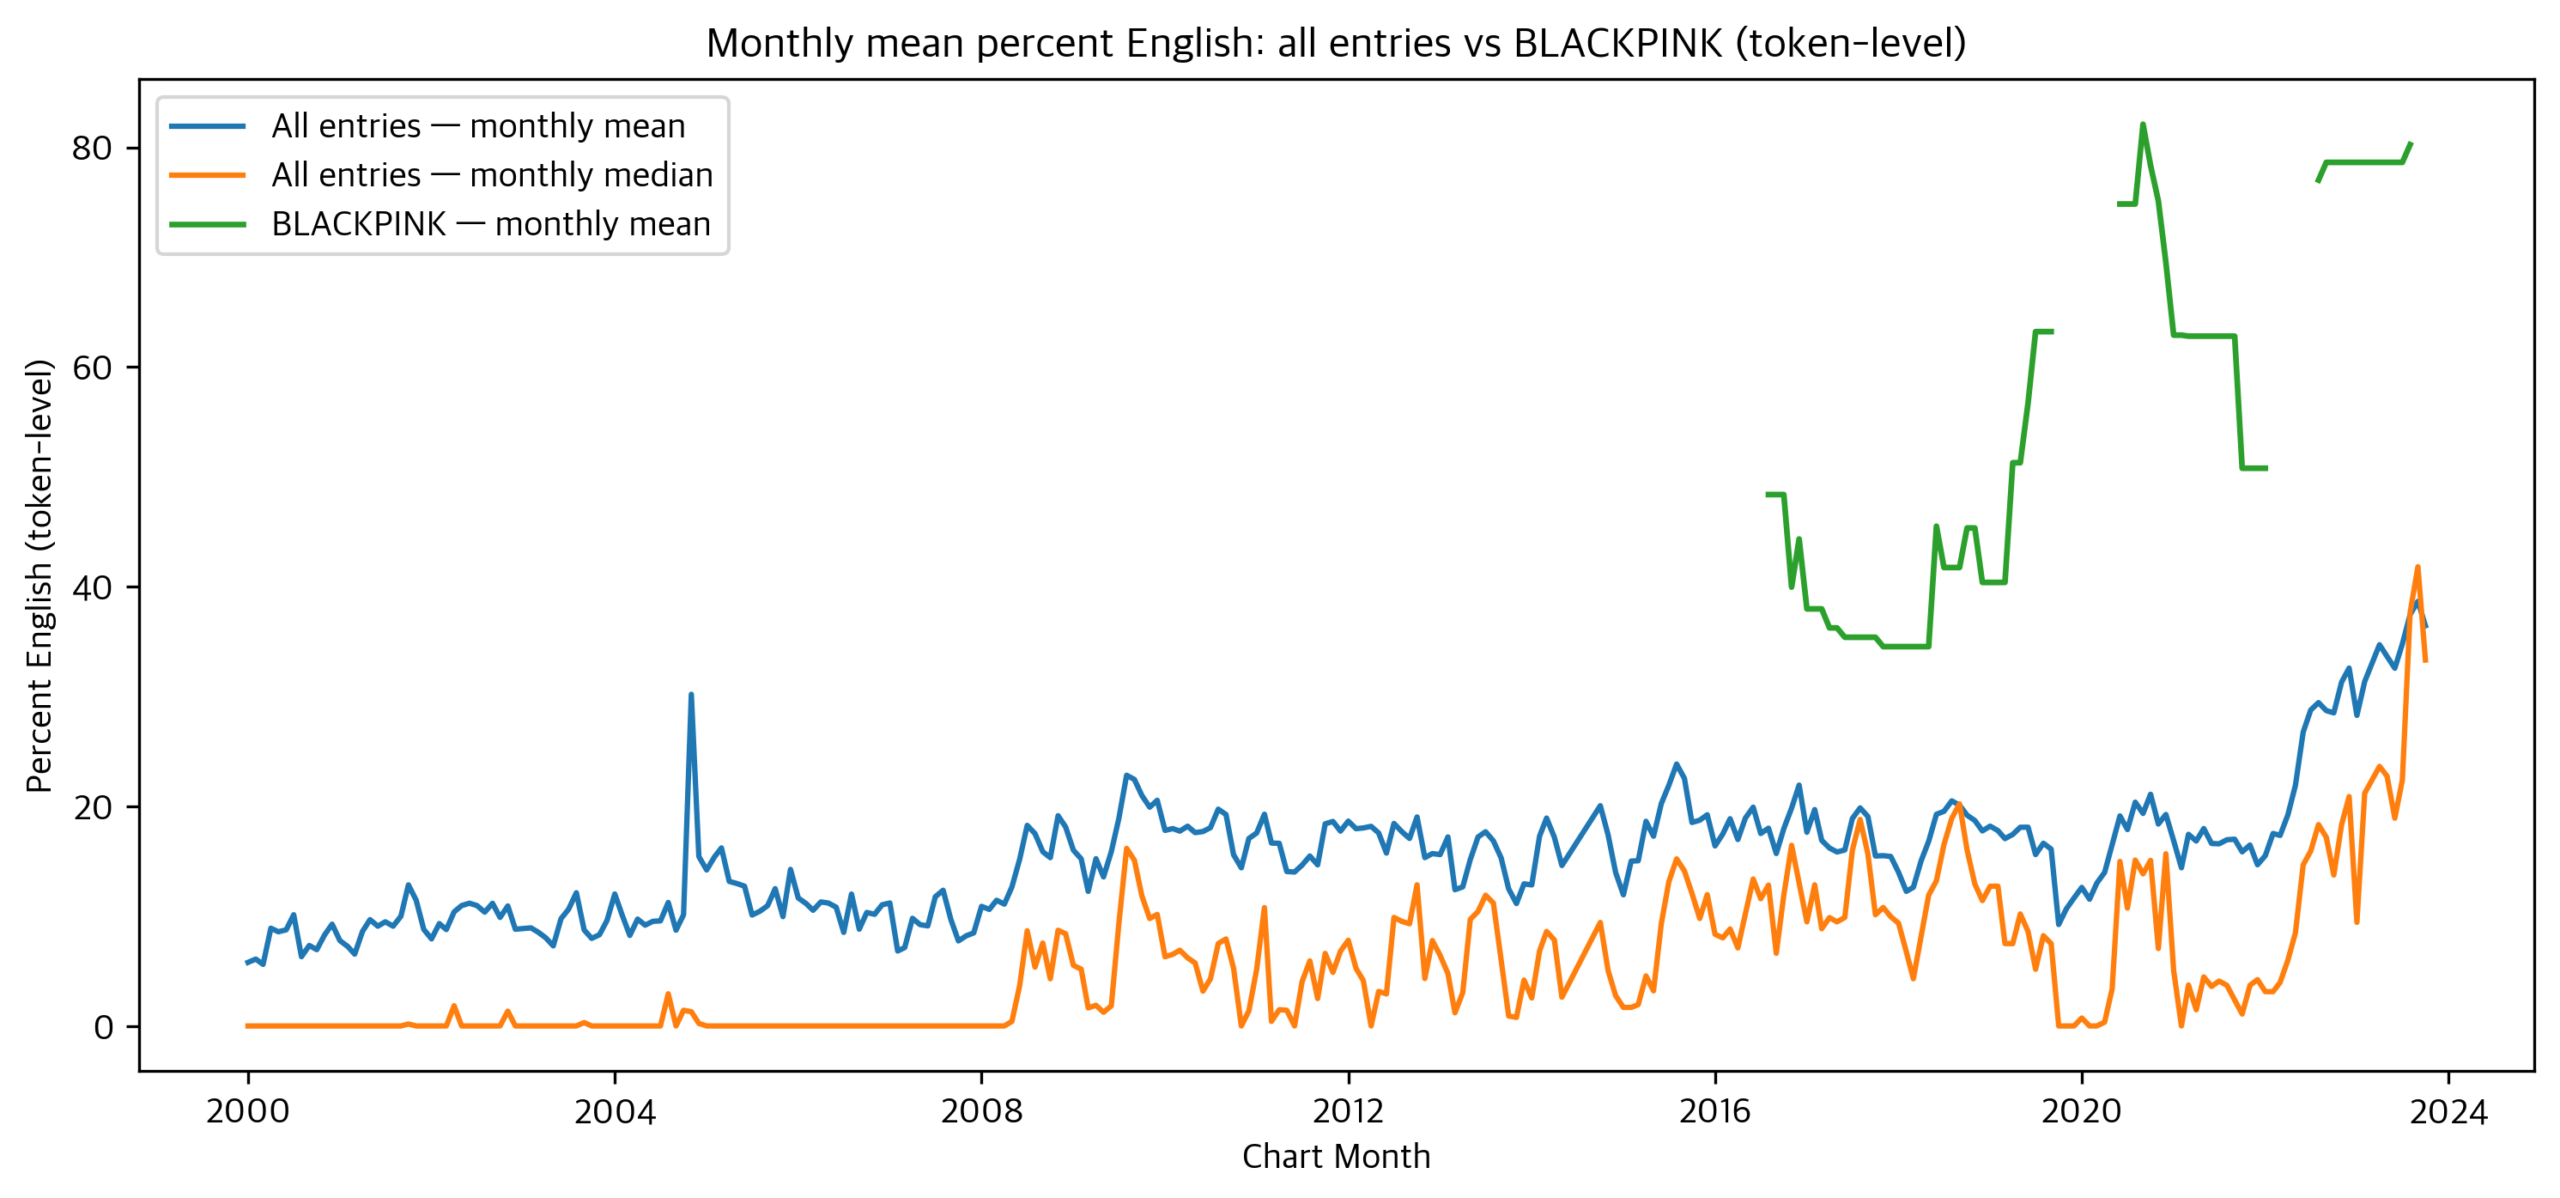
Certain artists have notably higher average percent English than others (Figure 5). The top English-using artists in the dataset are dominated by internationally oriented idol groups, while artists whose charting catalog is concentrated in ballads or OST-style tracks typically show much lower English percentages.
Among artists with substantial chart presence, NewJeans averaged 66.94% English (median 69.92%, n = 76), BLACKPINK averaged 56.56% (median 50.78%, n = 136), and BTS (방탄소년단) averaged 41.97% (median 38.79%, n = 616).
Because the dataset includes all songs that chart on Melon (including some non-Korean tracks), Western pop songs in the chart data are typically near 100% English and can increase the overall English percentages in later years. All figures and summaries in this paper include all chart entries in the dataset (i.e., they are not restricted to Korean-only or K-pop-only subsets). This is especially relevant for the “Pop” bucket, whose mean of 86.75% (n = 350) is far higher than any Korean-dominated bucket because nearly all Pop-bucket entries are foreign chart-crossers (Sam Smith, Justin Bieber, Britney Spears, and Charlie Puth together account for over a third of those entries). The Korean-only sensitivity analysis described in Methods §2.6 directly addresses this by re-fitting the inferential models on the foreign_flag = False subset; results are reported below.
We tested whether higher chart performance is associated with higher percent English. The scatter plot of percent English vs. chart rank shows no strong visual trend. Consistent with this, the overall correlation is very close to zero, indicating that percent English alone explains little about rank differences across the chart.
At the chart-month-entry level (n = 25,876), Pearson r between percent English and the performance score (101 − rank) was −0.0263 (95% CI [−0.0387, −0.0140], p = 2.4 × 10⁻⁵) and Spearman ρ was −0.0072 (95% CI [−0.0202, 0.0049], p = 0.246).
Because the dataset is large, very small correlations can still produce small p-values. Interpretation therefore focuses on the magnitude of the relationship. Here, both correlations are near zero. The Spearman correlation is not statistically significant at α = 0.05 (p = 0.246), meaning that under a strict significance test we cannot reject the possibility that the true rank-based association is zero. The Pearson correlation is statistically distinguishable from zero (p = 2.4 × 10⁻⁵) only because of the large sample size; its magnitude (r = −0.026) is too small to be of practical interest. The two methods disagree on statistical significance because Pearson is sensitive to a small number of high-English chart-crossover songs (Sam Smith, Justin Bieber, Britney Spears, Charlie Puth) whose 90–100% English values pull the linear fit slightly negative, while Spearman uses ranks and is therefore less leveraged by those extreme values.
At the unique-song level (n = 8,115), which removes the non-independence introduced by songs that stay on the chart for many months (Methods §2.6), Pearson r between mean percent English and the performance score was −0.034 (95% CI [−0.057, −0.014], p = 0.002) and Spearman ρ was −0.003 (95% CI [−0.025, 0.018], p = 0.77). Aggregating to song level confirms that any association between percent English and chart rank is too small to be of practical interest; the Spearman confidence interval crosses zero. The Korean-only sensitivity analysis (n = 8,016, restricted to foreign_flag = False) gives essentially the same picture: Pearson r = −0.025 (95% CI [−0.048, −0.005], p = 0.02) and Spearman ρ = 0.002 (95% CI [−0.020, 0.021], p = 0.85). Removing foreign chart-crossovers does not move the correlation in any meaningful way.
To assess whether percent English retains any explanatory value for chart rank after controlling for plausible confounders, an ordinary-least-squares regression was fit at the unique-song level (n = 8,115) with best chart rank as the dependent variable and percent English, chart year, genre bucket, and foreign-artist status as predictors. The coefficient for percent English is β = 0.064 (95% CI [0.028, 0.100], p < 0.001): each additional percentage point of English in a song’s lyrics is associated with a 0.064-position worsening of the song’s best chart rank, holding year, genre, and foreign-artist status constant. The effect is statistically detectable but practically trivial; a 10-percentage-point increase in English usage corresponds to a 0.64-position-worse rank. The model has adjusted R2 = 0.040, meaning that year, genre, foreign-artist status, and percent English together explain only about 4% of the variance in best chart rank. Genre bucket and chart year are the dominant predictors (full coefficient table in the supplementary materials). For the Korean-only sensitivity, the same regression refit on the foreign_flag = False subset (n = 8,016) returns nearly identical results: percent English β = 0.071 (95% CI [0.034, 0.108], p < 0.001).
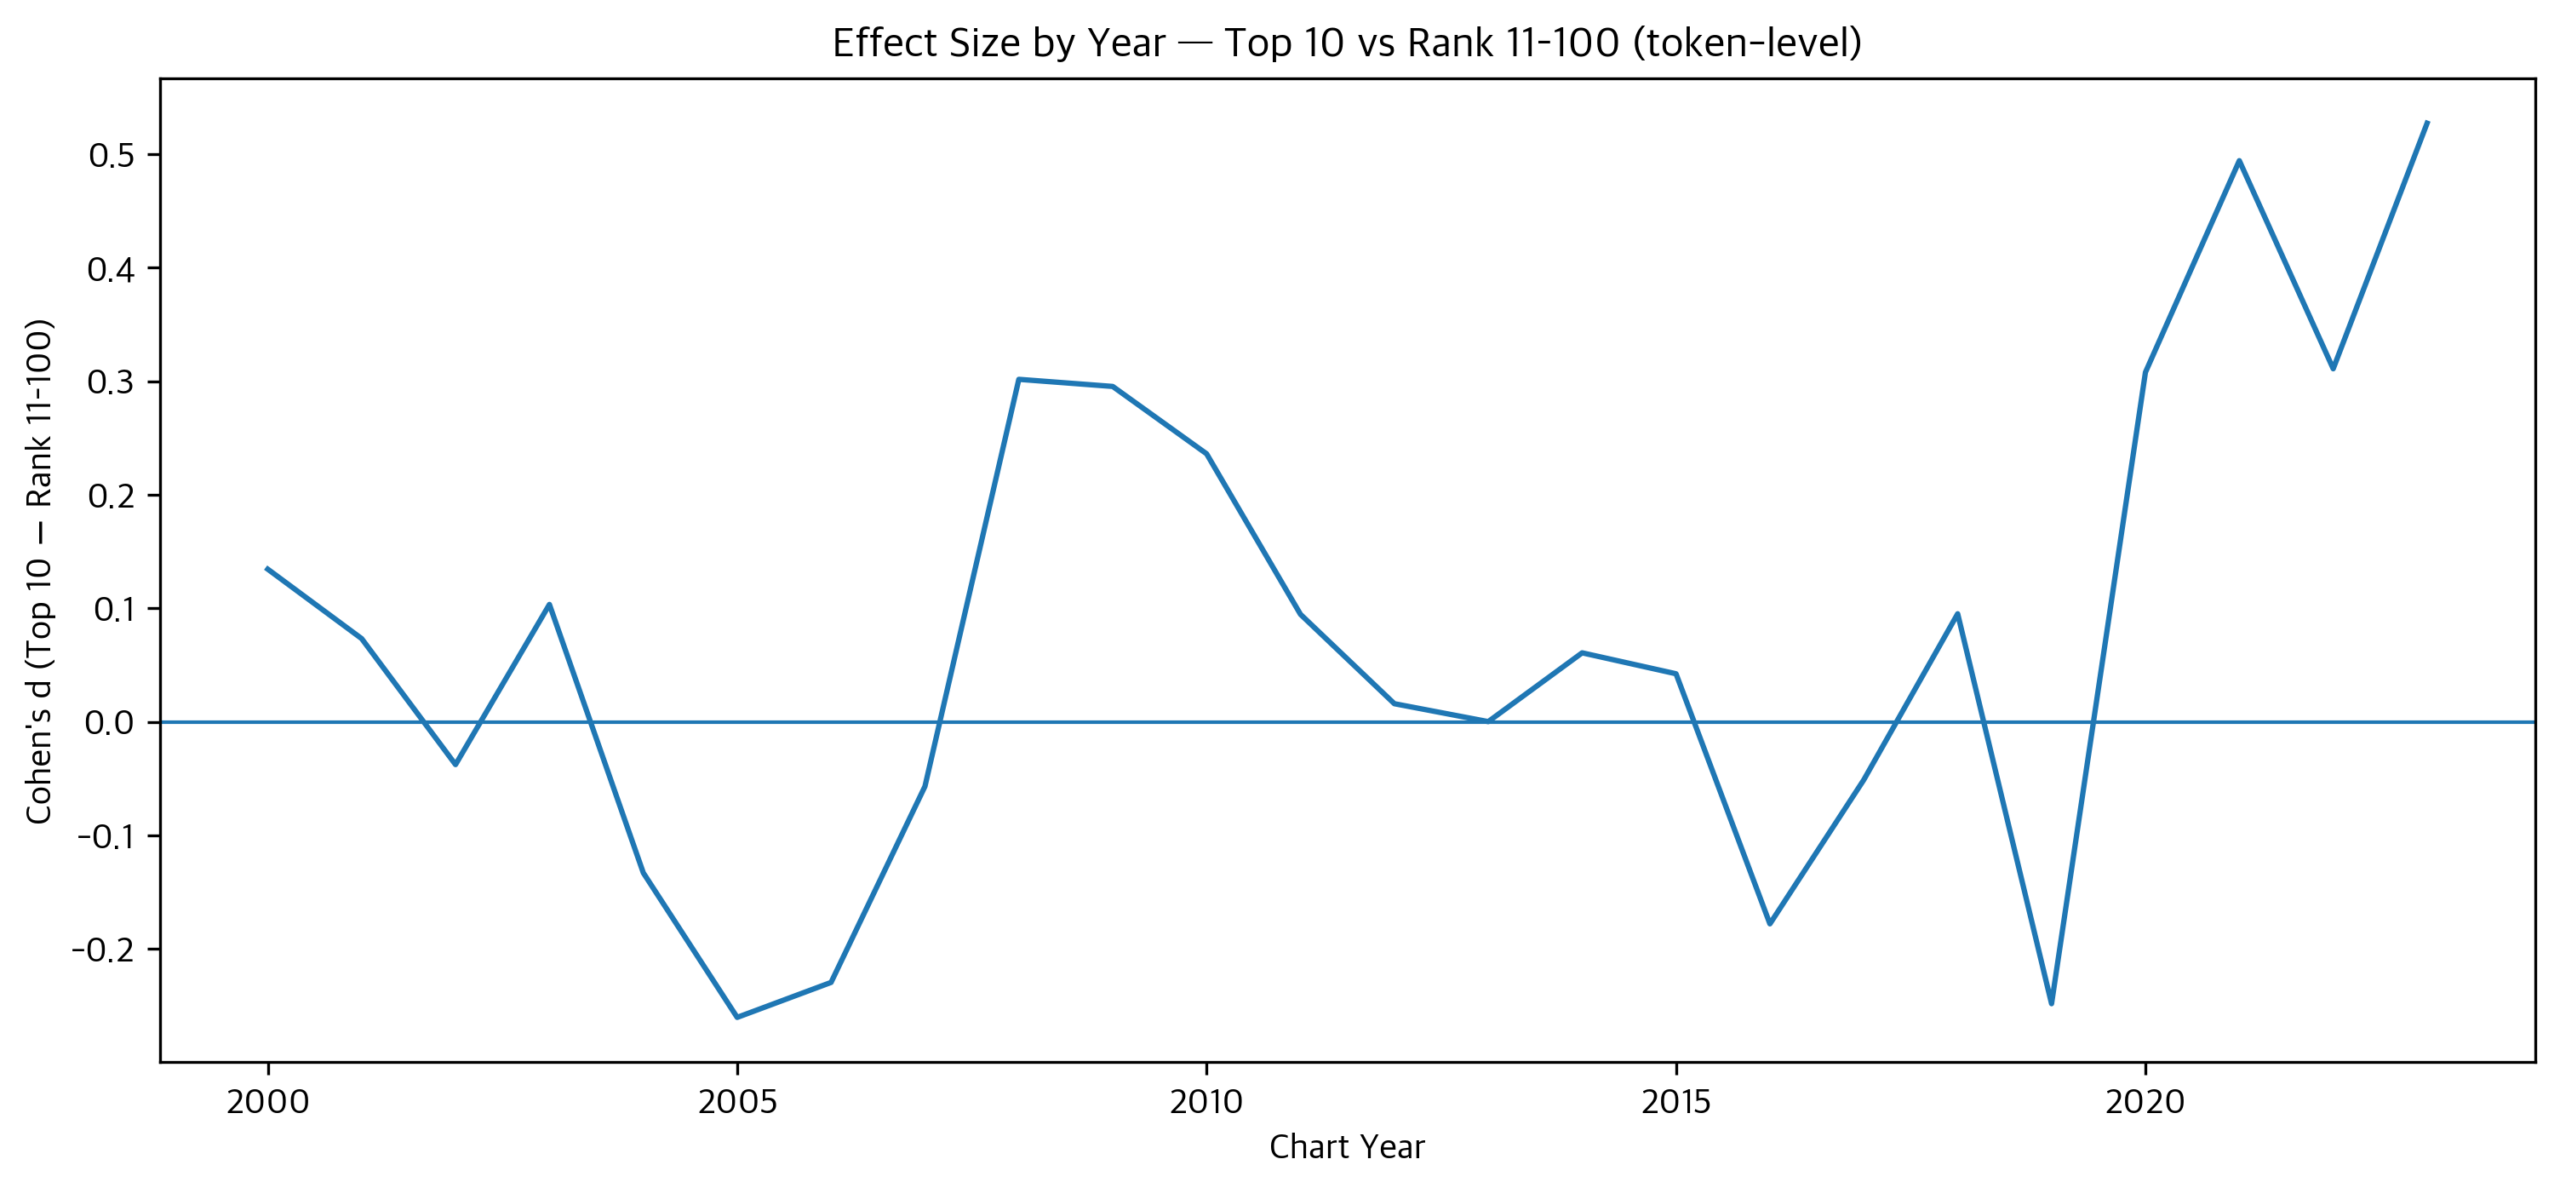
Figure 6 reports Cohen’s d as a standardized effect size comparing mean percent English for Top 10 songs vs. songs ranked 11–100, by year (see Methods for the exact grouping and computation). Values near 0 indicate little difference between groups; positive values indicate more English in the Top 10 group; negative values indicate less English in the Top 10 group. Following Cohen’s conventional benchmarks (Methods §2.6), d ≈ 0.2 is a small effect, d ≈ 0.5 is medium, and d ≈ 0.8 is large.
From 2000 through approximately the mid-2010s, Cohen’s d stays close to zero most years, suggesting that English usage did not meaningfully distinguish the Top 10 from the rest of the chart for much of the early period. After 2020, Cohen’s d rises in multiple years, reaching a moderate effect size range in the most recent period.
Within the post-2020 period, Cohen’s d for the Top-10-vs-rest comparison was 0.308 in 2020 (small), 0.494 in 2021 (approximately medium), 0.311 in 2022 (small), and 0.527 in 2023 (medium), spanning from 0.308 to 0.527. Every year in the post-2020 window shows at least a small effect, with 2021 and 2023 reaching the medium-effect range.
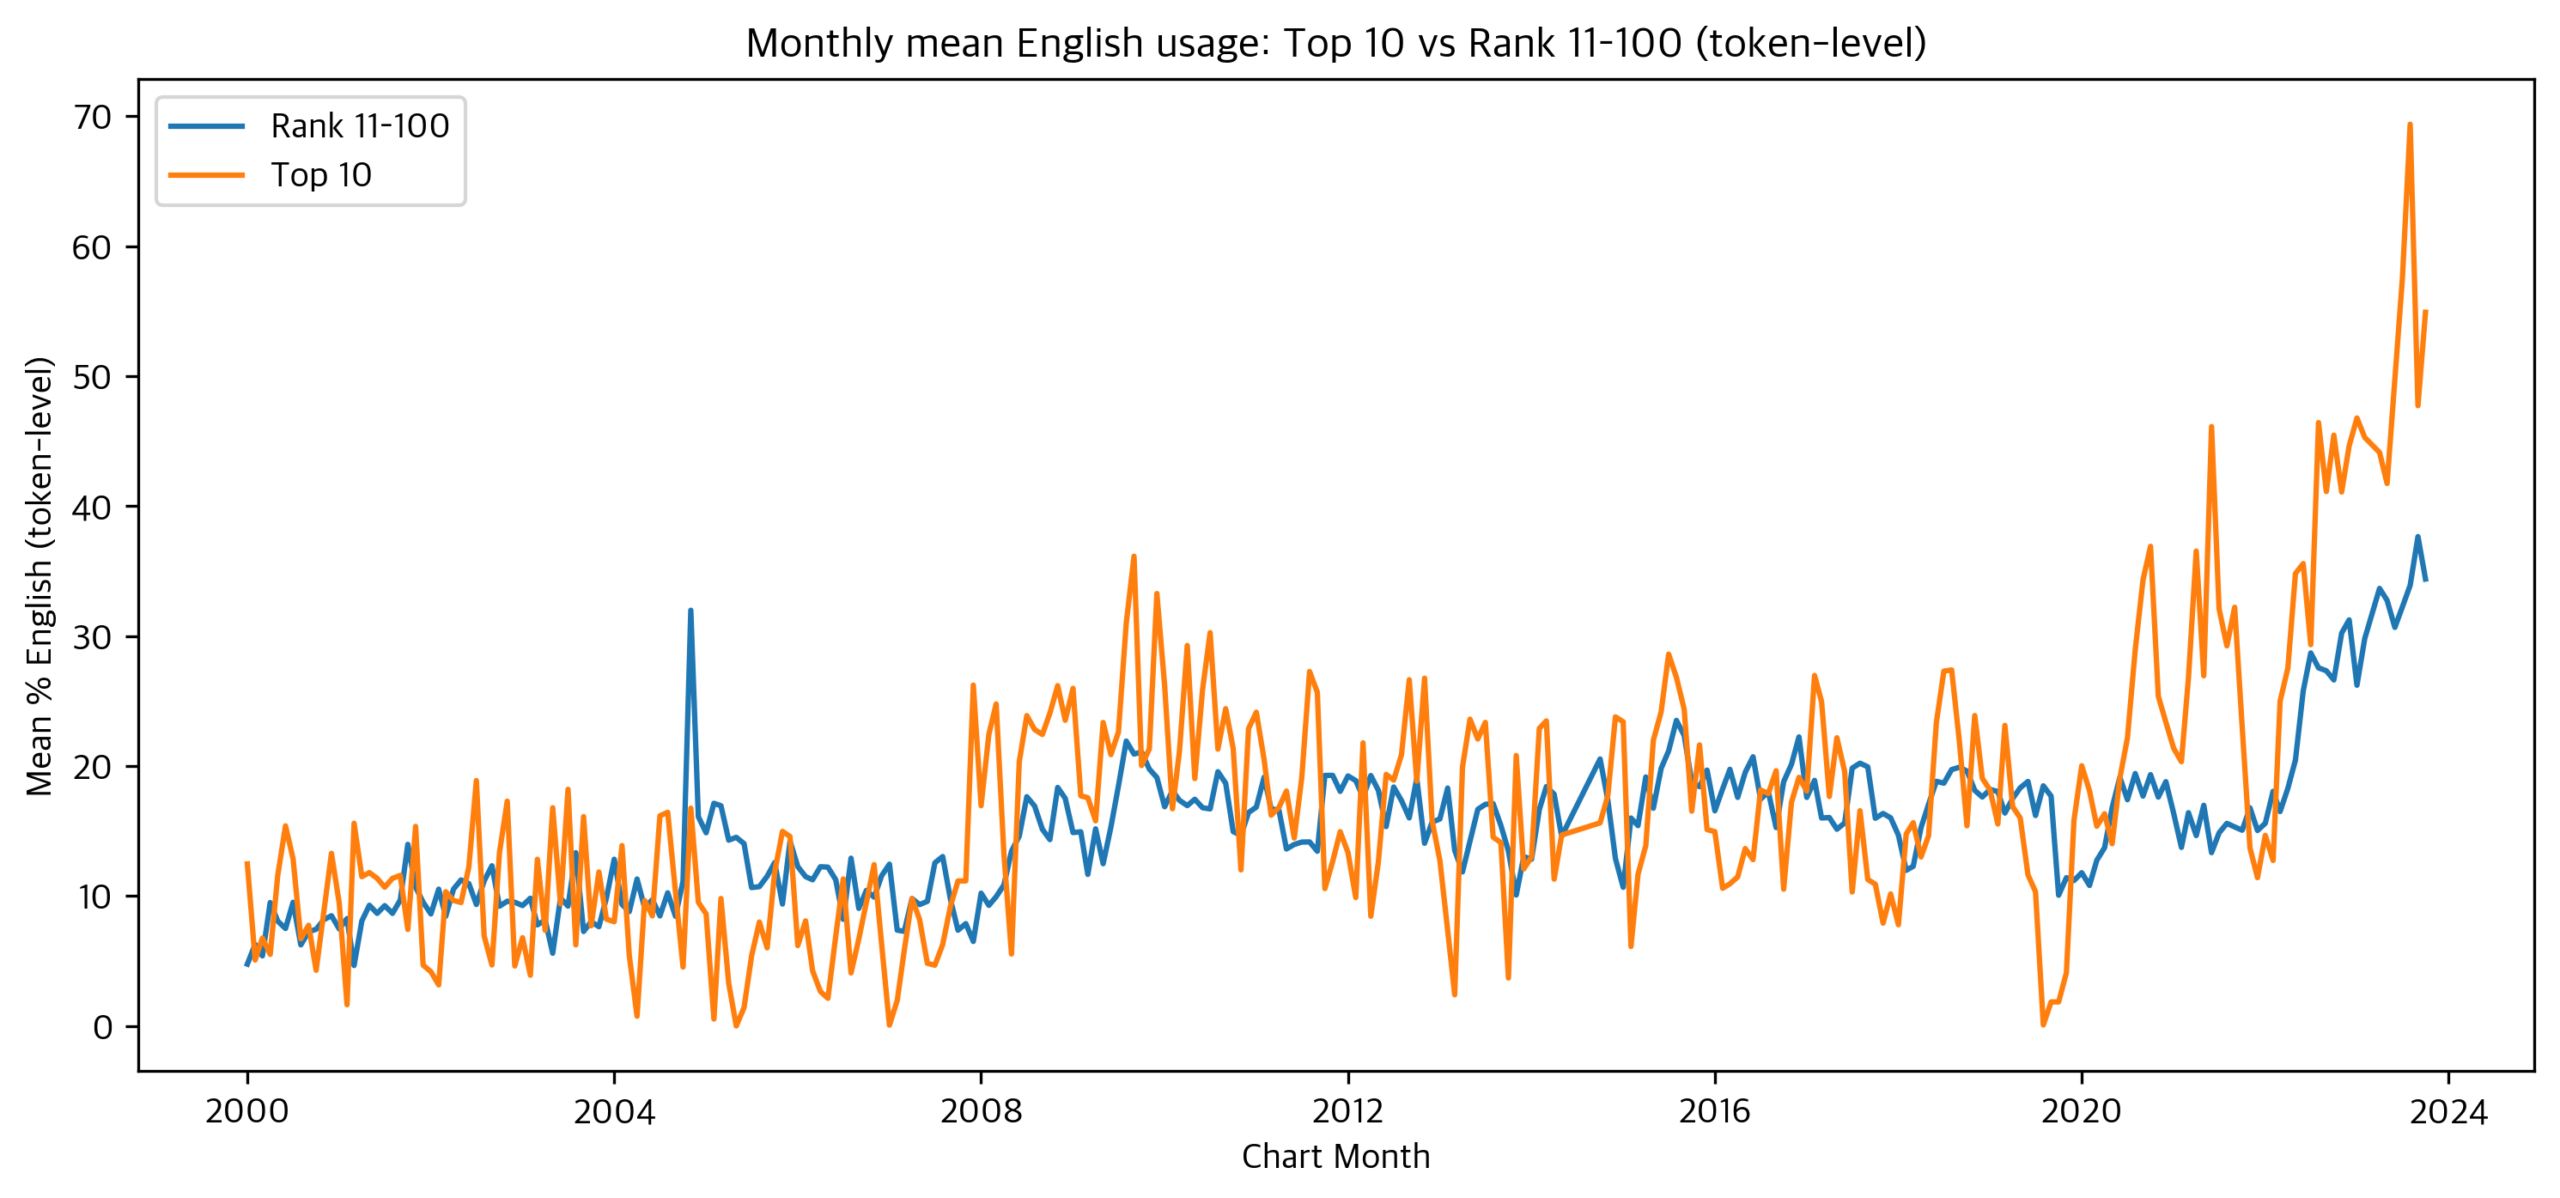
Figure 7 compares the average percent English for Top 10 songs versus songs ranked 11–100 across time. Both groups increase over time, but the Top 10 group shows sharper spikes and higher volatility in later years. This indicates that while many Top 10 songs remain low-English, a noticeable subset of Top 10 songs in recent years uses very high levels of English (including songs approaching fully English lyrics).
In raw mean terms across the same years, Top-10 chart entries averaged 22.83% English versus 16.27% for ranks 11–100 in 2020, 26.65% versus 15.34% in 2021, 33.20% versus 23.86% in 2022, and 50.80% versus 32.37% in 2023.
Discussion
From the analysis, we found that English percentage is not something that can alone predict chart performance in this dataset. When we did the token-level regression we got a coefficient of β = 0.064 for percent English (with 95% CI of [0.028, 0.100]), after having controlled for year, genre and if the song was from a Korean or foreign singer. The coefficient is detectable in 8115 songs but it results in less than a single rank difference for every 10% change in level of English usage. This matches our expectations, chart rank is a combined result of many factors like artist popularity, marketing, fandom size, seasonality, streaming behavior19, competition in a given month, etc. The single feature of English percent does not dominate.
Initially the low median for many of the early years might seem like a bug, it is a result of a skewed distribution. During that time, many songs had little to no English lyrics. Higher instances of English lyrics were seen in the genres of Dance/EDM and Rap/Hip-Hop, over more traditional genres like Ballad and OST. This aligns with expectations as the genres of Dance/EDM have a global-facing presentation and have norms for inclusion of English phrases and hooks. This is supported by descriptive accounts of East Asian pop music, where English is likely to be concentrated into particular song sections and not be scattered uniformly across the entire lyric set20.
The paper’s findings have implications that can carry into the music world for producers, artists, and labels and can affect lyrics strategy. First, we can see from the regression result that English percentage is not the automatic way into topping charts in the Korean market that some might think it would be. A 10% point change in English percent results in only a less than single rank position change. Thus, strategy decisions about lyrics should not assume that more English means better domestic chart outcomes. Second, we note that genre conventions matter more than blanket English inclusion. As Dance/EDM and Rap/Hip-Hop are already in a space where English is the norm, ballad artists would need to depart from genre norms to meaningfully increase their English share. Third, the post-2020 widening of the Top-10-versus-rest gap can be linked to the chart success of internationally oriented acts such as BTS, BLACKPINK, and NewJeans, whose token-level English averages fall between 42% and 67%. We can read this, conservatively, as high English content being a marker for artists who are already internationally oriented rather than a cause of domestic chart success. The English-heavy lyrics are only a single feature of a strategy focused on global export21.
Sample restricted to charting songs. The analysis is restricted to songs that charted in Korea’s monthly Top 100 from 2000 through October 2023. These conclusions therefore describe how charting K-pop has changed; they do not generalize to non-charting K-pop, indie releases, or songs that were popular before 2000. English-usage patterns in under-chart or indie K-pop may differ from the charting subset analyzed here, and we cannot speak to those patterns from this dataset.
Detection accuracy and proper-noun under-count. The token-level pipeline captures intra-line code-switching natively, which is an improvement over line-level classifiers, but it shares the general challenges that automated language identification faces with short, multi-script text22,23. Two specific weaknesses should be noted. First, English proper nouns that are not in the wordlist (place names, artist references, brand names like “Tokyo” or “Hollywood”) fall into the Latin-unknown category and are not counted as English; songs with many proper nouns therefore have slightly lower percent-English values than a human coder would assign. Second, the method uses script as a proxy for language, so romanized Korean tokens not in the small blocklist may be misclassified as Latin-unknown rather than as Korean.
Genre-tag ambiguity. Within the source dataset there is inconsistent labeling. Songs are tagged with multiple genres in one string. We use a keyword-priority rule to map the raw tags to nine genre buckets, this makes this a deterministic choice. However, this means that a sing with both ballad and dance tags will be forced into Ballad/OST under the rule. A consequence is that we might have inflated the English contribution of Ballad/OST in years where, for example, there were many dance-ballad crossovers.
Observational design. We have conducted an observational content analysis and not an experimental one. Meaning, all the reported correlations and regression results should be considered to be associations and not direct causal effects of English percent on rank.
Future work can include investigations into: “staying power”, extension into other markets, location of English section within songs. Staying power work would focus on how many consecutive months a song remains in the Top 50 or Top 100 and then testing whether songs with more English tend to stay on the chart longer. This would complement the rank-based analysis here and add a duration based analysis. Similar NLIP studies of German pop charts24 already document similar shifts in linguistic features of popular lyrics over decades. Such cross-market analysis would help separate the K-pop-specific patterns from broader, global, changes. Finally, the token creation pipeline now allows for a study of where in a song sections of English lyrics appear, looking at chorus versus verse or hooks versus narrative passages.
References
- J. S. Lee. Linguistic hybridization in K-pop: Discourse of self-assertion and resistance. World Englishes. Vol. 23, pg. 429–450, 2004, https://doi.org/10.1111/j.0883-2919.2004.00367.x. [↩]
- I. Schneider. English’s expanding linguistic foothold in K-pop lyrics. English Today. Vol. 40, pg. 105–112, 2024, https://doi.org/10.1017/S0266078423000275. [↩]
- H. Datta, G. Knox, B. J. Bronnenberg. Changing their tune: How consumers’ adoption of online streaming affects music consumption and discovery. Marketing Science. Vol. 37, pg. 5–21, 2018, https://doi.org/10.1287/mksc.2017.1051. [↩] [↩]
- D. Y. Jin. New Korean Wave: Transnational cultural power in the age of social media. University of Illinois Press, 2016. [↩]
- P. Muysken. Bilingual speech: A typology of code-mixing. Cambridge University Press, 2000. [↩] [↩]
- I. Oh, G.-S. Park. From B2C to B2B: Selling Korean pop music in the age of new social media. Korea Observer. Vol. 43, pg. 365–397, 2012. [↩] [↩]
- J. S. Park. The local construction of a global language: Ideologies of English in South Korea. Mouton de Gruyter, 2009. [↩] [↩]
- A. Moody. English in Japanese popular culture and J-Pop music. World Englishes. Vol. 25, pg. 209–222, 2006, https://doi.org/10.1111/j.0083-2919.2006.00460.x. [↩]
- D. Y. Jin, W. Ryoo. Critical interpretation of hybrid K-Pop: The global-local paradigm of English mixing in lyrics. Popular Music and Society. Vol. 37, pg. 113–131, 2014, https://doi.org/10.1080/03007766.2012.731721. [↩]
- M. Mauch, R. M. MacCallum, M. Levy, A. M. Leroi. The evolution of popular music: USA 1960–2010. Royal Society Open Science. Vol. 2, pg. 150081, 2015, https://doi.org/10.1098/rsos.150081. [↩]
- W. Ryoo. Globalization, or the logic of cultural hybridization: The case of the Korean Wave. Asian Journal of Communication. Vol. 19, pg. 137–151, 2009, https://doi.org/10.1080/01292980902826427. [↩]
- M. Heller. The commodification of language. Annual Review of Anthropology. Vol. 39, pg. 101–114, 2010, https://doi.org/10.1146/annurev.anthro.012809.104951. [↩]
- D. Y. Jin. The rise of digital platforms as a soft power apparatus in the New Korean Wave era. Communication and the Public. Vol. 9, pg. 161–177, 2024, https://doi.org/10.1177/20570473241234204. [↩]
- EX3exp. Kpop-lyric-datasets: a JSON dataset of 25,696 K-pop songs from Melon monthly charts (2000–2023). https://github.com/EX3exp/Kpop-lyric-datasets, accessed 2025. [↩]
- S. Nakatani. language-detection: a Java language-detection library (basis for the langdetect Python port). https://github.com/shuyo/language-detection, 2010. [↩]
- W. McKinney. Data structures for statistical computing in Python. Proceedings of the 9th Python in Science Conference (SciPy 2010). pg. 56–61, 2010, https://doi.org/10.25080/Majora-92bf1922-00a. [↩]
- J. D. Hunter. Matplotlib: A 2D graphics environment. Computing in Science & Engineering. Vol. 9, pg. 90–95, 2007, https://doi.org/10.1109/MCSE.2007.55. [↩]
- J. Cohen. Statistical power analysis for the behavioral sciences, 2nd ed. Lawrence Erlbaum Associates, 1988. [↩]
- L. Aguiar, J. Waldfogel. Platforms, power, and promotion: Evidence from Spotify playlists. The Journal of Industrial Economics. Vol. 69, pg. 653–691, 2021, https://doi.org/10.1111/joie.12263. [↩]
- A. Moody, Y. Matsumoto. ‘Don’t touch my moustache’: Language blending and code ambiguation by two J-pop artists. Asian Englishes. Vol. 6, pg. 4–33, 2003, https://doi.org/10.1080/13488678.2003.10801106. [↩]
- J. Lie. K-Pop: Popular music, cultural amnesia, and economic innovation in South Korea. University of California Press, 2014, https://doi.org/10.1525/california/9780520283114.001.0001. [↩]
- M. Lui, T. Baldwin. langid.py: An off-the-shelf language identification tool. Proceedings of the 50th Annual Meeting of the Association for Computational Linguistics (ACL 2012) System Demonstrations. pg. 25–30, 2012. [↩]
- T. Jauhiainen, M. Lui, M. Zampieri, T. Baldwin, K. Lindén. Automatic language identification in texts: A survey. Journal of Artificial Intelligence Research. Vol. 65, pg. 675–782, 2019, https://doi.org/10.1613/jair.1.11675. [↩]
- T. Hunke, F. Huber, J. Steffens. The evolution of song lyrics: An NLP-based analysis of popular music in Germany from 1954 to 2022. Music & Science. Vol. 8, pg. 1–20, 2025, https://doi.org/10.1177/20592043251331155. [↩]