Abstract
Marching band competitions require members to perform under pressure after long periods of time waiting before they start the first note of their performance. This study examines the competitive environment of marching band performance and its effects on performers’ emotional states. In particular, the waiting process before performance may influence how nervous, excited, or tired performers feel. This study uses queueing and performance psychology theory to examine how marching band students experience the different lines and waiting areas before a major competition performance. Using a mixed-methods approach, the study surveys 32 participants from a major high school marching band competition at MetLife Stadium and employs a Python-coded queuing simulation to compare waiting patterns with students’ reported emotions. The survey results showed that students usually felt like they waited longer than they actually did, suggesting that stress and fatigue may make waiting feel longer. However, other students reported that being slightly less nervous when actively waiting (by practicing and preparing) can help reduce anxiety. Additionally, the highest stress levels were reported near the stadium and performance areas as the marching band moved closer to the actual performance phase. The simulation demonstrated that queue congestion aligns with emotional stress points reported by performers in the survey. The study’s findings show that performers should reduce excessive practice time, incorporate air-valve visualization techniques, and organize competition flow to minimize pre-performance bottlenecks that may induce stress. In conclusion, this research provides evidence-based recommendations to enhance performer experience and reduce pre-performance stress in marching band competitions.
Keywords: Queue Psychology, Performance Psychology, Marching Band Competition, Queueing Theory, Perceived Wait Times, Pre-Performance Stress
Introduction
Queuing theory is a mathematical discipline that focuses on waiting lines and how they operate. It is a study to make the waiting lines more efficient and shorten the overall wait time, enhancing the participants’ experience. In queuing theory, each step, called “queues,” are identified and analyzed with queuing models that help to visualize the entire service system and identify the estimated service times on each queues. Psychological theory is the study of how people perceive and feel. It specifically observes the mental and behavioral patterns of the participants when put in specific situations or environments. This study will combine both theories to analyze the queues of a marching band competition and its effect on the performers. Both theories, although each belonging to different branches are related. Kumar states that a necessary part in queuing theory is to observe the participants’ experiences in the overall queue1. This involves looking into how the participants perceive the experience mentally and how they behave in each queue. One common example of a combination of two theories is when people have to wait in a long line, not knowing when they will be able to receive the service. This creates frustration. Another common example can be found in Disney’s queues. Many people waiting for the rides stay excited throughout the long waiting lines. This is because Disney incorporates distracting yet engaging designs throughout its queues, keeping waiters engaged and happy. It is necessary to observe the behavioral and emotional responses of the participants when analyzing a queue for a queue can evoke different reactions such as excitement, nervousness, anxiety, anger, stress, or boredom.
One everyday activity that requires waiting is competition. Marching band competitions are among those that require a lot of waiting. They have several queues that are required before the actual performances, such as unloading, practicing, and waiting. These minor steps are all methodically arranged so that the competition’s circulation goes smoothly. However, minor queues require time and a lot of energy, which correlates with the stress that the band performers have reported to experience. The stress from queues causes music performance anxiety (MPA), which is “a natural, emotional, and physiological response to the stress of public performance”2. Anxiety can either be constructive, stimulating energy, or destructive, panicking psychologically3. It has been widely identified that “the physical and psychological symptoms of performance anxiety often prevent the attainment of success”4. Recently, topics of MPA have been increasing in the scientific literature, trying to find ways to address the issue due to the rise of performance anxiety awareness. Gómez-López’s research identified that 95% of live performers experience MPA, with 60 to 80% of professional musicians experiencing MPA. Addressing pre-performance anxiety becomes crucial especially for younger students because they need to learn ways to manage it for MPA not only impacts the performance quality at the moment but also their future experiences with performances. This research analyzes differences between perceived and actual wait times, how they affect performers’ psychology and performances, and ultimately provides recommendations to marching band competition organizers on how to reorganize the competition queue to optimize participants’ well-being.
Related Works
Queuing theory is the mathematical theory of waiting lines, which analyzes components such as waiting time and customer counts to enhance service. It has a linear structure with several queues in between, so the individual in each queue will be processed in the order they arrive. In simple terms, the concept of first-come, first-served. A queue can be as simple as going into a cafe, lining up, ordering, waiting for your order, and receiving it. There is a step-by-step, chronological process: whoever comes into the store first will receive their order first, the second will receive after, and so on. There are five types of queues: input-restricted, output-restricted, circular, double-ended, and priority. Queuing theory balances supply and demand to make the process of waiting for and receiving service efficient. However, Furnham claims that a clear understanding of the psychology of the individuals waiting in the queue and of how the queue impacts them in addition to mathematical functions, are significant in creating a successful queue. Furnham’s The Psychology of Queuing concurs by emphasizing the need to recognize and analyze the impact of the queueing environment on people in line, as their experiences are reflected in their reviews5.
To enhance the queue experience, one of the most important elements to analyze is the difference between actual and perceived wait time. Maister’s The Psychology of Waiting Lines addresses the problem that while occupied time feels shorter than unoccupied time, the latter feels longer and evokes frustration and stress. He uses “The First Law of Science is simple” formula, satisfaction = perception – expectation, to calculate the level of service for his research. He concludes that anxiety as well as uncertain waits, make the perceived wait time longer. Eagleman also identified that time perception depends on stress and anxiety6. Similarly, Chu, Westbrook, et al.’s study titled The psychology of the wait time experience – what clinics can do to manage the waiting experience for patients: a longitudinal, qualitative study focuses on patients’ responses to different waiting queues in their HIV care clinics7. Chu and his colleagues interviewed patients before and after their clinics to analyze how they felt and which elements of the queue caused them to feel that way. After the observation, the researchers claim that making the waiting area comfortable for patients and informing patients of the delays helps to mitigate the negative responses from the patients. Both Maister & Chu, through their research, shows that the mood and the emotion of the customers during the queue influence the perceived time. Furthermore, researchers Epel, Crosswell, Mayer, Prather, Slavich, Puterman, Mendes, and Dean write about the importance of unified procedures of measuring stress because it is a very obscure topic. They write that when determining stress levels for analysis or research, considering self-reports as well as possible environmental factors are crucial because it helps to show the psychological state of the individuals. However, the paper warns against some limitations such as (1) psychological state not matching/showing the physical state and (2) the subjective reports are heavily relied upon by each individual with their willingness as well as unwillingness to participate, different sensitivities to stress, and their own unique ranges of stress levels8,9. Epel et al., therefore, warns the readers that analyzing stress levels should be proceeded with caution.
Although most queueing theory-related observations are made from customers or in hospitals as mentioned before, the theory also applies for music performers awaiting for their musical performances. Music performance anxiety, commonly known as MPA, is anxiety that many performers develop before their performance, and it impairs the quality of their performances. Twitchell and He, through both of their researches, address that MPA is developed from pressure from the self and or from other members in the band because of the thought of having to protect their reputations as talented musicians10,11. They use BPS models and other models to visualize and understand stress, identifying potential mitigating factors for performance anxiety. The BPS models showed that the anxiety was similar to threat-like feelings. Passarotto, Worschech & Altenmuller 12 go in depth in “The effects of anxiety on practice behaviors and performance quality in expert pianists,” where they observe pianists’ practice behaviors and performance qualities. The pianists had to self-report their stress and anxiety levels using the Visual Analogue Scales of Anxiety before and after their practices. The participants had to play Scriabin’s Sonata op. 53, bar 85, at 90 beats per minute, and the researchers noted wrong notes, missed notes, rhythmic accuracy, and loudness homogeneity. The researchers also collected participants’ heart rates, and after careful analysis of all the data, they concluded that practice time was positively correlated with performance anxiety. Yu(2015)’s Choking under pressure: the neuropsychological mechanisms of incentive-induced performance decrements claims that musicians experience stress due to their tendency toward perfectionism. They want to perfect every part of the music, leading them to constantly practice and put more pressure on themselves, which ultimately negatively impacts the performance quality. Twitchell and his colleagues suggest that breathing exercises, practice performances, and visualization of the performance help to mitigate anxiety. Moreover, these sources by Belén Gómez-López and Roberto Sánchez-Cabrero both focus on different effects of MPA as well as coping methods. Specifically, Belén Gómez-López and Roberto Sánchez-Cabrero analyzes existing research on MPA published in the years 2018 to 2023; however, out of 71 initial researches found, they only analyzed 10 following the preferred reporting items for systematic reviews and meta-analysis or PRISMA2. Their sources were all chosen by the words they each included, the year of the publication, content, and the language it was written in. After careful analysis, Gómez-López and Sánchez-Cabrero found that there was a severe lack in the sample sizes, which becomes a problem when it comes to generalization. Additionally, they identified that the levels of MPA were not clearly stated in the majority of the studies and that the population of the subjects were all over the age of 18, which created some bias. Overall, they concluded that more in-depth research is needed and that the emphasis should shift to music students and their effects because not only can music performance anxiety affect the performance quality, but also the musician’s life. Gómez-López and Sánchez-Cabrero does a solid analysis on the ten researches, looking into the data collection method, design, control group, treatment, and results; however, the amount of research they analyzed is not significant enough to be generalized. Additionally, they only looked into English and Spanish research, which does not consider other parts of the world. They also found that self-reported stress helps to identify the severity of the psychological state of the subjects. Self-reports of the participants may not seem a reasonable methodology; however, it is known to be the simplest, reasonable way to measure the stress levels to each stressors because it “captures an individual’s perception of how overwhelmed [the participants] are by their current life circumstances.” After observing and analyzing the “psychological, cognitive, behavioral, and physiological responses to [stress] exposure,” Alexandra D Crosswell and Kimberly G Lockwood identified simple ways to measure stress levels: self reports, which is the reason why this research is completed through self-reports. Crosswell and Lockwood refers to other research in order to accurately provide practices to measure stress in a psychology study and observe the latest methods that have been commonly used by other researchers13. One limitation is that some of the research Crosswell and Lockwood use are published in the late 1900s and early 2000s, which could be considered as not “recent” as they stated13. Still, they incorporated thoughts of the members of the Stress Measurement Network, which is an organization made up of global psychology experts to enhance public understanding of stress, increasing the writing’s credibility. Scott Aubrey in his The relationship between anxiety, enjoyment, and breakdown fluency during second language speaking tasks: An idiodynamic investigation found there are “significant positive correlations between anxiety and breakdown fluency”14. His research focuses on how anxiety and enjoyment would affect the participants’ ability to speak fluently. He performs his research by recording in which the participants talked in and identified silent pauses that were 0.25 seconds or more. His study involved four participants, and for all four participants, as momentary anxiety increased, the length of the pauses during the speeches increased. Moreover, Bakhtiari, Borges, Burin, and Schoonover all used the method of study analysis of current studies to identify different coping strategies for music performance anxiety15,16,17,18,19. They found that preparation prior to performance, positive mindset, yoga, and other relaxation techniques seemed to have positive correlation with less music performance anxiety. However, both studies only reference those that are written in English and those that lack control groups, which are aspects that have to be taken into perspective. Similarly, Pressman, through four different studies involving 1,399 participants, have found that leisure activities are associated with well-being and better psychological and physical functioning20. Furthermore, Hendricks, Sieger, Thompson, Alario, Simunovic, and Riley recommend some implications that music educators could use to mitigate music performance anxiety such as talking to students in a specific way to show their trust and respect towards the students21,22,23,24,25,26. Sieger performed a series of interviews in order to collect the information. However, the interviews were collected in a short time period and the data were not deeply analyzed compared to the large sample size25. Professor van Schalkwyk also agrees with the ideas presented by Hendricks, Sieger, and Thompson after researching into what makes children to be more prone to opening up and sharing their true feelings with others27.
Methods
The study uses a quantitative survey-based methodology with simulation modeling to identify the stress points in the Marching Band Competition queues and why those points are most stressful. The survey-based quantitative method allows the survey to collect band members’ (participants) emotions throughout the queue, as well as their perceived times for each station.
This survey examined the discrepancy of perceived wait times and actual wait times. The survey hypothesized that these discrepancies may show higher levels of stress or elevated emotional stress. In this study, perceived wait time was defined as how long participants believed or felt they waited at a specific station in the competition process. These wait times were surveyed and self-reported by the participants. Actual wait time was defined as the time the experience took, based on direct observation and GPS logs. All actual service times and station times were recorded through direct observation and GPS tracking.
The goal of the research is to identify the areas of the queueing process that strongly influence performers’ stress and explain why. Since stress is “not a monolithic concept” that involves “interactions between individual and environmental factors,” the research will combine the data from perceived and actual time of each queue with the self-reported emotion levels to estimate the stress level at each station9. Another goal is to recommend that competition holders and band directors consider certain patterns or practices to improve performance.
The survey consists of 32 participants (n = 32) that followed the following selection criteria:
- members of high school marching bands
- had at least on experience competing at the MetLife Stadium
- were willing to share their emotions
The survey divided up the competition queue into seven stations: Parking Lot → Travel → Practice Area → Travel → Outside Stadium → Inside Gate → Stadium. The questions in the survey all asked the participants to rank their emotional measurements (Nervousness, Excitement, Tiredness) from 0-10 (no emotions to strong emotions) in each of the seven stations. The participants were also asked for their chop conditions (“a person’s lip condition”). Some of the participants were randomly asked for their experiences during one of the competitions to make sure that the respondents had enough time to talk about their live emotions.
Participation in this study was voluntary and anonymous. Participants were recruited through voluntary sampling through marching band networks. The survey did not require participants to provide any identifying information to maintain each participant’s anonymity. All participants were allowed to withdraw at any moment. Because the survey involved minimal risk and collected anonymous self-reported information, it was conducted in accordance with standard ethical research practices for survey-based behavioral research. Participants were informed that their responses would be used for academic research purposes only.
Queueing Model
The participants were provided a diagram for context and asked to complete a structured survey that recorded both subjective measures for each queueing state. Questions such as “How long do the practices feel like?” and “How long does it take to carry the equipment to the practice area?” were asked for subjective data. Questions like “How excited are you when you get off the bus to unload?” and “How tired do you feel after running through the show?” were asked for subjective data. The survey asked these questions for each identified station.
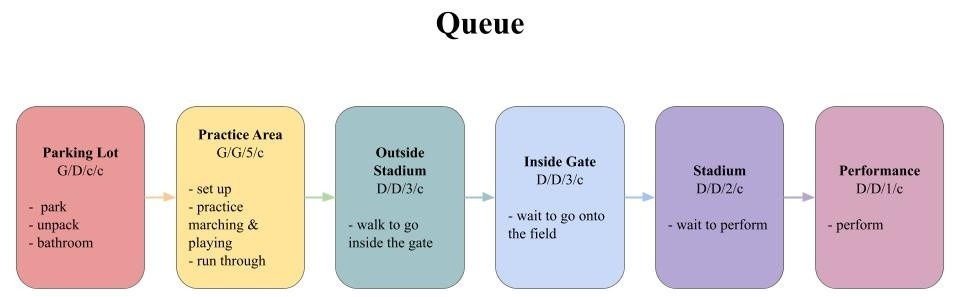
In the study, actual wait time was recorded directly through measured observation and fit to the model. Additionally, travel times between stations were approximated using distance and route information through Google Maps and GPS logging. Additionally, the service times at each station were drawn from direct observation by the researcher. The queuing model uses these collected values as an informal approximation of a typical competition flow and should be interpreted accordingly. The purpose of these measures is to establish a reasonable, data-driven reference point for comparing perceived and actual wait times, not to assert empirical ground truth. This distinction has been acknowledged as a limitation in the study. Therefore, future research should benefit from structured field observation protocols collected across multiple competitions to obtain verifiable, timed data that more accurately represent queuing metrics.
The table below summarizes the estimated parameters used to characterize each station in the queueing model. Ranges rather than point values are given where possible to reflect the natural variability in competition scheduling.
| Station | Arrival Rate | Service Rate | Servers | Travel Time to Next |
|---|---|---|---|---|
| Parking Lot | Every 15 min | 15–20 min | Multiple | 3–5 min |
| Practice Area | Every 20 min | 60 min | 4–6 teams | 10 min |
| Outside Waiting Line (Stadium) | Every 5–10 min | 5–10 min | 2–3 teams | 2 min |
| Inside Gate | Every 5 min | 10–15 min | 3–4 teams | 1 min |
| Field Area | Every 5–7 min | 5–10 min | 1–2 teams | 1 min |
| Performance Station | Every 10–15 min | 10–15 min | 1 team | 0 min |
As for the perceived time and emotional and physical states, this research used the participants’ 0-10 scales, collected through the survey. The research sorted the scales to 1-5; 0 and 1 being the 1; 2 and 3 being the 2; 4, 5, and 6 being the 3; 7 and 8 being the 4; and 9 and 10 being 5. After the research, the percentages for each sorted value were used to create the graphs.
Simulation Model
To further analyze how marching band competitors move through the competition day, this study also created a queueing simulation model based on the seven stations identified in the survey: Parking Lot → Travel → Practice Area → Travel → Outside Stadium → Inside Gate → Field Area → Performance. The goal of the simulation model is to identify where bottlenecks form and determine wait times. This simulation can also be used to adjust the schedule to improve the competition’s efficiency while enhancing the psychological experience.
The model used a discrete-event simulation in which each team moves through a series of queues. Each queue is treated as a service station with its own number of “servers” (for example, practice slots or gates) and its average service time. Arrival rates and service times were taken from the competition schedule and from the timing patterns reported by participants.
Simulation Assumptions
The simulation was built on a combination of empirically informed parameters (drawn from observed competition schedules, staging logistics, and typical event structure) and modeling assumptions made for tractability. The distinction between the two is noted explicitly below, as it bears on how outputs should be interpreted
Station sequence
The seven-station pipeline — Parking Lot → Practice Area → Outside Waiting Line → Inside Gate → Field Area → Performance — reflects standard marching band competition flow and was confirmed by participant survey responses describing their movement through the day.
Arrival intervals (λ)
Interarrival time ranges were derived from typical competition scheduling blocks and observed band spacing at each stage.
- Parking Lot: every 13–17 minutes
- Practice Area: every 18–22 minutes
- Outside Waiting Line: every 5–10 minutes
- Inside Gate: approximately every 5 minutes
- Field Area: every 5–7 minutes
- Performance Station: every 10–15 minutes
Service time ranges (μ⁻¹)
Service durations were based on standard warm-up durations and official performance time slots, cross-referenced against participant-reported experience times.
- Parking Lot: 15–20 minutes (unloading and equipment setup)
- Practice Area: 55–65 minutes (full warm-up block)
- Outside Waiting Line: 5–10 minutes
- Inside Gate: 10–15 minutes
- Field Area (staging): 5–10 minutes
- Performance Station: 10–15 minutes
Server capacity (s)
Concurrent server counts reflect physical space constraints and typical event coordination limits reported by participants familiar with MetLife Stadium’s staging areas.
- Practice Area: 4–6 concurrent bands
- Outside Waiting Line: 2–3 groups
- Inside Gate: 3–4 groups
- Field Area: 1–2 groups
- Performance Station: 1 group
Arrivals at all stations were modeled using a Poisson process. A Poisson process is a standard assumption in discrete-event queueing models that treats arrivals as random and memoryless. Service time was assigned randomly from a uniform distribution over the stated range; uniform distributions were used primarily for their relative ease of use and to provide maximum transparency. Empirically determined service time distributions could have been applied if timestamped field data had been available. Stations were scheduled in a first-come, first-served (FCFS) manner. Although FCFS is a commonly used rule for scheduling, there may be times that competition officials may provide different priorities. To reduce variability due to randomness, 50 teams were simulated, and the simulation was run 50 times. These values were selected without regard to formal statistical considerations, as a pragmatic basis to allow comparison of the impact of alternative scheduling rules. Since the primary objective of the modeling effort was to compare two scenarios, and not to obtain accurate timing information about individual events, no attempt was made to precisely replicate the timing details of real-world competitions.
Results
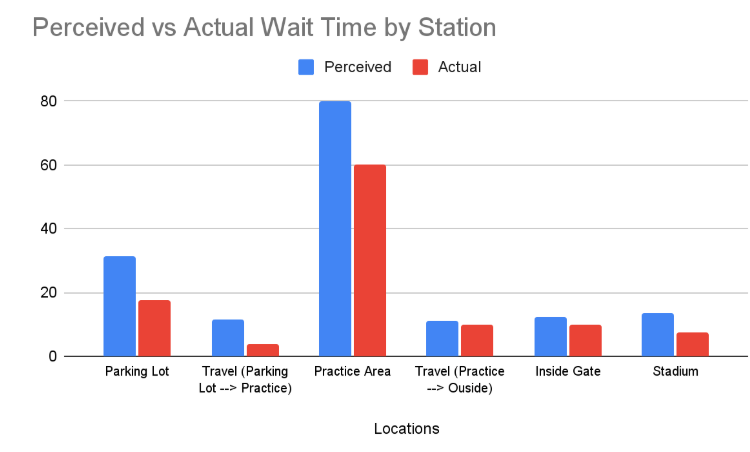
From the data collected through the survey, the perceived time exceeded the actual time throughout the stations. The order of the biggest difference between the two goes from the Practice Area, Parking Lot, Travel (Parking Lot → Practice), Stadium, Inside Gate, and Travel (Practice Area → Outside Stadium).
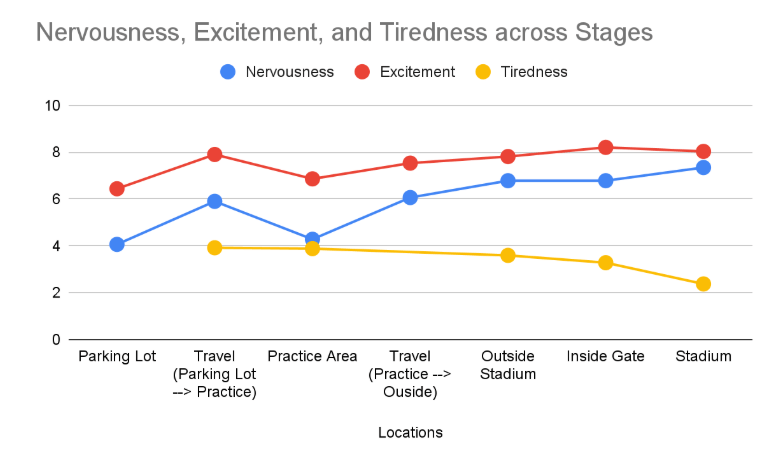
With information gathered on the emotional measurements at each station, the researcher combined all three data sets to see how they developed throughout the queue. Overall, the trends for nervousness and excitement were very similar, with a dip during the Practice Area, then increasing as participants approached their performing area. The research identified that the most “stress peak” area, or the area with the most amount of anxiety or nervousness, is the Stadium, right before the participants’ performance. For the tiredness trend, however, it was different. The level decreased throughout the queue.
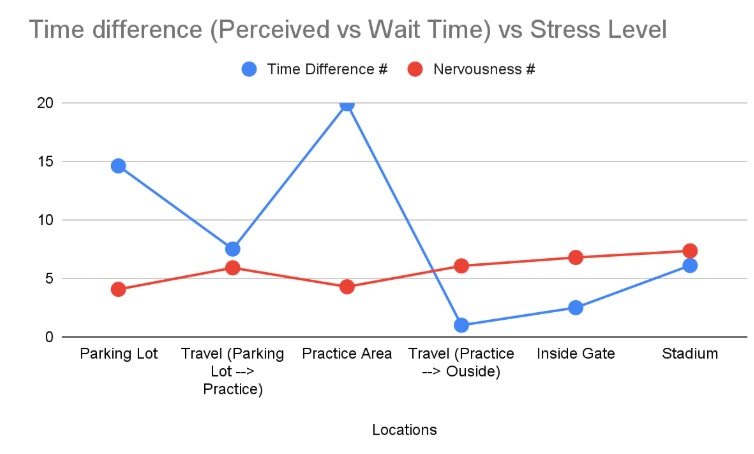
The research also combined the time difference between perceived and actual time and nervousness to determine whether there are any correlations. The only significant information that can be seen is in the Practice Area when the time difference between the Perceived Waiting Time and the Actual Wait Time is at its peak. From the estimated or perceived times of M = 11.5 (SD = 10.5) traveling from the parking lot to the practice area to M = 79.9 (SD = 17.2) at Practice Area and M = 11 (SD = 6.7) traveling from the practice area to the outside stadium, the Practice Area shows a jump from the traveling estimated time from the parking lot to the practice area.
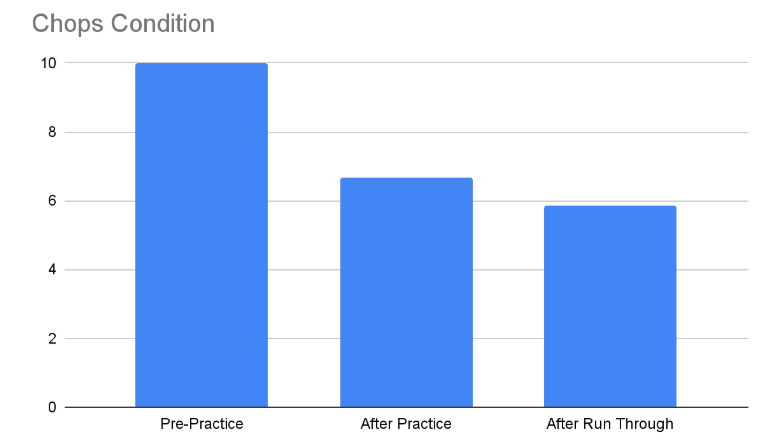
To evaluate the physical toll of the practice area station, which the survey identifies as the longest stage, participants reported their chops condition at three successive moments: before practice, after the main practice time, and after the full run through. Chops condition reflects embouchure readiness on a scale of 0 to 10 with a higher score indicating greater physical readiness and freshness. The scores decreased steadily across the three stages, indicating embouchure fatigue before performers even reached the performance area.
Baseline Simulation
The following values are modeled estimates generated by a simulation under the stated assumptions in the methods section. The primary goal of the simulation was to discover potential bottlenecks within the queue process (a representation of the competition). The simulation results will be used to provide additional information or evidence (i.e., as a supportive qualitative analysis) to support what has been observed through theory-based qualitative analysis, but will not be used to validate any observations. The simulation data showed that the two locations where performers experienced the most waiting for service were the Practice Area and the Performance Station. Both stations created large bottlenecks because they have longer-than-typical service times and lower-than-normal service capacity. As shown in Table 1, these areas have the longest total wait time, including the waiting area, which can add up to 60 minutes of practice (service time) and 10.5 minutes of wait time combined. In other simulation trials, there were wait times of up to 6 minutes before they even began their warm-up. At the performance station, wait times also spiked significantly, averaging 9.8 minutes and occasionally reaching 28 minutes. All other stations formed with no queues, indicating that the competition’s time pressure is concentrated in only two places.
| Station | Mean Wait (min) | Max Wait (min) | Mean Total Time in Station (min) |
|---|---|---|---|
| Parking Lot | 0.8 | 10.7 | 18.3 |
| Practice Area | 10.5 | 46.5 | 70.5 |
| Outside Stadium | 0.0 | 0.0 | 7.5 |
| Inside Gate | 0.0 | 0.0 | 12.5 |
| Field Area | 0.1 | 2.5 | 7.6 |
| Performance | 9.8 | 28.1 | 22.3 |
Improved Simulation (Shorter Practices and Two Performance Servers)
The simulation model was modified to a redesigned competition schedule with a 45-minute practice block rather than 60, reducing the physical fatigue associated with “chops.” To reduce performance bottlenecks, another modification was the addition of two parallel performance slots. As shown in Table 2, there were some key improvements. The average wait time in the practice area dropped from 10.5 minutes to 2.2 minutes. The maximum wait fell from around 46 minutes to 19 minutes. The total practice area time shrank by more than 23 minutes. The performance wait time almost shrank because more marching bands would be on the field.
| Station | Mean Wait (min) | Max Wait (min) | Mean Total Time in Station (min) |
|---|---|---|---|
| Parking Lot | 0.8 | 10.7 | 18.2 |
| Practice Area | 2.2 | 19.8 | 47.2 |
| Outside Stadium | 0.0 | 0.0 | 7.5 |
| Inside Gate | 0.0 | 0.0 | 12.5 |
| Field Area | 0.1 | 3.0 | 7.6 |
| Performance | 0.5 | 6.8 | 13.0 |
Discussion
The Practice Area had the largest gap between perceived and actual wait time. The research found that the closer performers get to their performance, the stronger their overall feelings, such as nervousness and excitement. Psychologically, as someone gets closer and closer to the event, they tend to become tense, either negatively with nervousness or positively with excitement. Also, the locations, moving from the outside to the back of the stadium to the field, add to the tension. Lastly, as the participants get closer and closer to the stadium for their performance, they can hear and see their competitors either finishing or waiting for their turn. Managing perceived time can help mitigate stress because more perceived time reduces tension correlated to other distractions, such as practices. However, the more practices the performers have, the worse their conditions become.
Additionally, the simulation model suggests that the Practice Area and the Performance Station generate the most waiting and are therefore the primary contributors to frustration, boredom, nervousness, and fatigue. The Practice Area had the longest perceived time M = 79.9 (SD = 17.2) in the survey, and the simulation explains why: it is both slow and capacity-limited, producing persistent queues. Interestingly, the survey results also showed that performers felt less nervous in the Practice Area, despite it feeling long, which aligns with research on queueing psychology. Occupied time (practicing, moving, preparing) feels shorter and reduces anxiety even when it objectively lasts a long time. Additionally, the performance station was the other bottleneck. This corresponds with the “stress peak” observed in the emotional data, where nervousness and excitement sharply increased as performers approached the stadium. Simulation shows that even short delays at this station stack up quickly, creating a tense pre-performance atmosphere. All data was self-reported, so there can be bias from respondent to respondent due to different environments and different classifications of each emotion. However, many researches involving stress are analyzed with self-reported perceptions for it shows “the duration and severity of the psychological response to stressors,” so the methodology is reasonable28. Additionally, the self-report results signify that the members’ emotions fluctuated throughout the queue.
Future Intervention
The research recommends image training, commonly known as air valve, instead of practicing for a long period of time. During image training, the performers will perform all their visuals and press their instrument keys. They will just not blow into it. Another recommendation is to have fewer practices, and pep talks from the band directors also helped to mitigate the anxiety.
Additionally, the study ran an improved simulation scenario which revealed a couple of recommendations. One finding showed that shortening the practice block can improve wait time and therefore improve physical exhaustion. Additionally, the competition can reduce the peak of psychological stress before performance by adding a second performance slot, which can eliminate pre-performance queue wait time and buildup. These recommendations can also create a more predictable flow into the station. Based on Maister’s principle, reducing this uncertainty and turbulent wait time can reduce perceived wait time and stress. Overall, the improved simulation demonstrates that the queue design for marching band competitions can support not just the logistics of the competition but also the psychological experience of students and performers. By utilizing a model such as a queue simulation, organizers can improve performers’ emotional experience, reduce physical strain, and create a smoother, more supportive performance environment.
Conclusion
In conclusion, this study has collected survey data and performance metrics from a simulation model that show how marching band competition queues can affect performers mentally and physically. Students often reported longer wait times (perceived wait times) than they actually did (actual wait time). The survey data also show that longer practice times were associated with physical fatigue, attributed by decline in embouchure (“chops”) conditions. The survey results suggest that both time perception and tiredness can negatively affect how performers feel before and after performances.
Additionally, the simulation model was used to support the findings of the survey and observed bottlenecks in the Practice Area and Performance Stations. These stations caused longer wait times, which matched areas where participants reported higher levels of stress, tiredness, and nervousness. The simulation tested an improved version with a shorter practice block and the addition of queuing capacity at the performance station, which reduced wait time. These adjustments in the competition can make the overall flow smoother and less stressful for performers.
One limitation of the study is that the emotional ratings were self-reported on the survey and each participant may have interpreted the scales differently. Also, because the data was based on observation and personal responses, the study can only assume relative trends and patterns rather than ground truth.
Overall, the findings suggest that queue systems in marching band competitions are not just about organization and timing. They also create emotional environments that can affect how students feel before performing. If practice time is adjusted and the schedule becomes more predictable, performers may experience less performance anxiety and feel more prepared. In conclusion, thoughtful queue design can make marching band competitions more efficient, less stressful, and more supportive for high school musicians.
References
- Kumar, P., Kalwani, M. U., & Dada, M. (1997). The Impact of Waiting Time Guarantees on Customers’ Waiting Experiences. Marketing Science, 16(4), 295–314. [↩]
- Belén Gómez-López, & Roberto Sánchez Cabrero. (2023). Current Trends in Music Performance Anxiety Intervention. Behavioral Sciences, 13(9), 720–720. [↩] [↩]
- Ritter, H. (1990). Anxiety. Journal of Religion and Health, 29(1), 49–53. [↩]
- Taborsky, C. (2007). Musical Performance Anxiety: A Review of Literature. Update: Applications of Research in Music Education, 26(1), 15–25. [↩]
- Furnham, A., Treglown, L., & Horne, G. (2020). The Psychology of Queuing. Psychology, 11(03), 480–498. [↩]
- Eagleman, D. M. (2008). Human Time Perception and Its Illusions. Current Opinion in Neurobiology, 18(2), 131–136. [↩]
- Chu, H., Westbrook, R. A., Njue-Marendes, S., Giordano, T. P., & Dang, B. N. (2019). The Psychology of the Wait Time Experience – What Clinics Can Do to Manage the Waiting Experience for patients: a longitudinal, Qualitative Study. BMC Health Services Research, 19(1). [↩]
- Dean, K. G., & Foster, H. D. (1979). Measuring Stress. Area, 11(4), 313–315. [↩]
- Epel, E. S., Crosswell, A. D., Mayer, S. E., Prather, A. A., Slavich, G. M., Puterman, E., & Mendes, W. B. (2018). More than a feeling: a Unified View of Stress Measurement for Population Science. Frontiers in Neuroendocrinology, 49(1), 146–169. [↩] [↩]
- He, H., & Ding, J. (2025). Exploring the Relationship Between Adaptive‐Maladaptive Perfectionism and Music Performance Anxiety Among Preservice Music Teachers: The Mediating Role of Performing Self‐Efficacy. Psychology in the Schools. [↩]
- Twitchell, A. J., Journault, A-A., Singh, K. K., & Jamieson, J. P. (2025). A review of music performance anxiety in the lens of stress models. Frontiers in Psychology, 16. [↩]
- Passarotto, E., Worschech, F., & Altenmüller, E. (2023). The effects of anxiety on practice behaviors and performance quality in expert pianists. Frontiers in Psychology, 14. [↩]
- Crosswell, A. D., & Lockwood, K. G. (2020). Best practices for stress measurement: How to measure psychological stress in health research. Health Psychology Open, 7(2). [↩] [↩]
- Aubrey, S. (2022). The relationship between anxiety, enjoyment, and breakdown fluency during second language speaking tasks: An idiodynamic investigation. Frontiers in Psychology, 13. [↩]
- Bakhtiari, P., Nikanmajd, N., & Ghasemi Shayan, R. (2025). Recent developments in coping strategies focusing on music performance anxiety: a systematic review. Frontiers in Psychology, 16. [↩]
- Borges, N., Marinho, H., Araújo, M., Pereira, A., & Serra, S. (2026). Mapping the relationship between flow experience and music performance anxiety: a scoping review. Frontiers in Psychology, 17. [↩]
- Burin, A. B., & Osório, F. D. L. (2016). Interventions for music performance anxiety: results from a systematic literature review. Archives of Clinical Psychiatry (São Paulo), 43(5), 116–131. [↩]
- BURIN, A. B., & OSÓRIO, F. L. (2017). Music performance anxiety: a critical review of etiological aspects, perceived causes, coping strategies and treatment. Archives of Clinical Psychiatry (São Paulo), 44(5), 127–133. [↩]
- Schoonover, L. (2025). Attachments and Strategies: Music Performance Anxiety, Trauma, and Mental Health Distress Within Music Learning Environments. Update Applications of Research in Music Education. [↩]
- Pressman, S. D., Matthews, K. A., Cohen, S., Martire, L. M., Scheier, M., Baum, A., & Schulz, R. (2009). Association of Enjoyable Leisure Activities With Psychological and Physical Well-Being. Psychosomatic Medicine, 71(7), 725–732. [↩]
- Alario, L. (2025). Addressing Music Performance Anxiety in College Musicians With Mindfulness, Entrainment, and Non-Sleep Deep Rest: A Literature Review. Update: Applications of Research in Music Education. [↩]
- Hendricks, K. S., Smith, T. D., & Stanuch, J. (2014). Creating Safe Spaces for Music Learning. Music Educators Journal, 101(1), 35–40. [↩]
- Natalija ˇSimunoviˇc, Habe, K. (2025). “You Know It, You Can Do 679 It—Good Luck!”: Managing Music Performance Anxiety in the Context 680 of Transforming Music Performance Ecosystems. Behavioral Sciences, 68115(12), 1696–1696. [↩]
- Riley, J. M. (2012). Reducing Anxiety: Studio Strategies for Performing Salvation. Music Educators Journal, 98(3), 65–70. [↩]
- Sieger, C. (2017). Music Performance Anxiety in Instrumental Music Students: A Multiple Case Study of Teacher Perspectives. Contributions to Music Education, 42, 35–52. [↩] [↩]
- Thompson, E. H., Robertson, P., Curtis, R., & Frick, M. H. (2013). Students with Anxiety: Implications for Professional School Counselors. Professional School Counseling, 16(4), 222–234. [↩]
- Van Schalkwyk, G. J., & Lijadi, A. A. (2019). Creating Space for Children’s Voices: Utility of the Collage Life Story Elicitation Technique. Journal of Psychological Research, 1(3). [↩]
- Dorsey, A., Scherer, E., Eckhoff, R., & Furberg, R. (2020). Measurement of Human Stress: A Multidimensional Approach. [↩]