
Abstract
Human mobility, especially in terms of international travel, plays a significant role in disease transmission, as was evidenced during the COVID-19 pandemic. However, healthcare systems are not fully prepared to tackle global pathogens and treatment is less expedient than desired. There is potential for machine learning methods to improve outcomes but international health data is lacking. This exploratory study examines whether a Random Forest model, trained on a synthetic dataset of traveler records, can distinguish between and draw patterns from disease categories among individuals traveling between India and the United States. A synthetic cohort of 300 traveler records was generated using a literature-informed GLMM-hurdle movement model and infection simulation incorporating demographic, geographic, temporal, and clinical features across ten prevalent diseases: COVID-19, Influenza, Dengue, Malaria, Tuberculosis, Hepatitis, Chikungunya, Leptospirosis, Typhoid, and no disease. The tuned Random Forest achieved an accuracy of 78.3% and a macro-AUC of 0.968, outperforming Logistic Regression (75.0%, AUC 0.940) and XGBoost (73.3%, AUC 0.953). Network analysis of city-level travel connectivity within the synthetic dataset identified high-connectivity nodes. These findings are constrained by the synthetic nature of the data and the sample size, and cannot be generalized to real-world epidemiological patterns without further validation. This proof-of-concept study demonstrates the feasibility of applying machine learning classification to multi-feature traveler datasets and identifies key methodological challenges that must be addressed in future work.
Keywords: Infectious Diseases, Machine Learning, Random Forest Modeling, Health Policy, Epidemic, Global Health, Synthetic Data
Introduction
Infectious diseases remain among the leading causes of mortality worldwide, with millions of deaths attributed to infections annually. Leading infectious diseases of global concern include Mycobacterium tuberculosis, Hepatitis B, COVID-19, Dengue, Malaria, and Influenza. Many lower-income countries continue to face significant challenges in controlling the spread of these diseases and in providing timely, effective treatment to affected populations1. The COVID-19 pandemic underscored the extent to which diseases transcend national borders: air travel enabled the virus to spread from its point of origin to countries across the globe within days, demonstrating that international connectivity is a critical factor in the epidemiology of infectious disease2. From an epidemiological perspective, human mobility is directly linked to disease transmission. Recent research has shown that human mobility patterns can shift substantially during public health emergencies, affecting how infectious diseases spread across regions3. Lessani et al. (2024) conducted a systematic review of the literature on human mobility and infectious disease transmission, finding that international migration has increased substantially over the past decade, with 281 million international migrants recorded in 2020 alone2. Pal et al. (2020) specifically examined the role of international flight dynamics in the importation of COVID-19 cases, analyzing over 180,000 flights and 39.9 million passenger seats to identify high-risk transit hubs4. International travel flows have been successfully modeled using gravity models, which predict movement volumes based on population sizes and geographic distance, providing a validated framework for generating realistic synthetic travel datasets5,6.
Despite this growing body of evidence, significant gaps remain in the ability of healthcare systems to rapidly identify pathogens introduced through international travel. Many hospitals lack the infrastrucsure for advanced molecular diagnostics, including gene-sequencing equipment that could rapidly identify infectious agents. Osei Sekyere (2025) documented the economic, regulatory, and clinical barriers to the adoption of next-generation sequencing in infectious-disease diagnostics7. This diagnostic gap is compounded by the absence of robust international systems for publishing disease data and regularly updating information about new outbreaks and strains. Unnithan et al. (2023) emphasized the urgent need for education and training reforms in infectious disease management in India specifically8. India is of particular importance in the context of travel-associated disease transmission. With approximately 31 million people traveling from India each year, the country is a major travel hub and a significant node in global disease networks6. India bears a substantial burden of infectious disease: Sharma and Bhattacharya (2013) documented a range of emerging and re-emerging infections including Dengue, Malaria, Chikungunya, Typhoid, Leptospirosis, and Tuberculosis9. Ram and Thakur (2022) quantified this burden using national survey data, finding that approximately 33% of India’s ailing population suffers from infectious diseases10. The volume of bidirectional air travel between India and the United States makes this corridor a meaningful case study for travel-associated disease classification.
Understanding the risk of disease transmission remains a global health security priority. While emerging machine learning approaches offer potential for predicting disease burden, their application to travel-associated disease classification remains limited. This study addresses that gap by framing disease identification among India–US travelers as a supervised multi-class classification problem. Specifically, this study asks: can a Random Forest classifier, trained on a synthetic traveler dataset incorporating geographic, temporal, and clinical features across ten disease categories, meaningfully distinguish between disease outcomes among travelers from India and the United States? The objective is not to produce a deployable predictive tool, but rather to explore the feasibility of this methodological approach and to identify the key challenges that would need to be resolved before such models could be applied to real-world outbreak and public health data.
Literature Review
Scholars have increasingly asserted that Machine Learning Models might play a significant role in addressing this disease gap. According to Nivethitha et al., AI offers promising solutions in countries with high disease burden such as India11. Although Nivethitha discusses current studies that have been utilized in early detection, the author suggests that more research and development in using ML models in infectious diseases is necessary. Random Forest models, in particular, have demonstrated strong performance in multi-class classification tasks involving mixed feature types. Probst et al. (2019) provided a comprehensive review of hyperparameter tuning strategies for Random Forest models, establishing that the algorithm’s approach of constructing multiple decision trees from bootstrapped samples and aggregating their predictions through majority voting offers natural resistance to overfitting and the ability to capture nonlinear relationships among features12. Recent comparative studies have evaluated Random Forest alongside other classifiers for health-related prediction tasks. A 2025 study published in Scientific Reports compared Random Forest, Support Vector Machines, Logistic Regression, and K-Nearest Neighbors for disease classification using stratified 5-fold cross-validation, finding that Random Forest achieved the highest F1-score among the models tested13. Machine learning models have also been applied to imported disease screening among immigrant populations, achieving 84.9–93.3% accuracy across multiple diseases using demographic and clinical features14.
A persistent challenge in applying machine learning to disease classification is class imbalance, wherein certain disease categories are represented far less frequently than others in the training data. A comprehensive review of 173 studies on cost-sensitive learning for imbalanced medical data documented the scope of this problem and evaluated solutions including SMOTE, ADASYN, and cost-sensitive modifications to standard algorithms15. These findings informed our approach to synthetic data generation, resulting in a more balanced distribution across ten disease categories.
The use of synthetic data in healthcare research has grown substantially due to privacy concerns, barriers to accessing real patient data, and the need for controlled experimental environments. Gonzales et al. (2023) conducted a narrative review of 72 studies using synthetic health data and identified major applications in privacy preservation and accelerated data access, while also highlighting limitations such as potential data leakage and unrealistic feature relationships16. Goncalves et al. (2020) evaluated multiple synthetic data generation approaches and proposed validation metrics for assessing statistical fidelity and utility17. Similarly, Giuffre and Shung (2023) emphasized that synthetic datasets must be rigorously validated to avoid introducing systematic bias or clinically implausible relationships18.
Despite increasing interest in synthetic healthcare datasets, relatively limited work has focused on travel-associated infectious disease modelling using epidemiologically informed synthetic mobility data. Existing studies have primarily examined domestic surveillance systems, clinical prediction tasks, or specific outbreak events. Few studies have combined gravity-model-based synthetic travel flow generation with infection modelling to evaluate multi-class disease classification within international travel corridors such as India–United States.
To address this gap, the present study used a gravity-model-based GLMM-hurdle mobility model, with parameters based on published estimates from Ferreira (2012)5. The Random Forest algorithm was selected because it works well for multi-class classification problems with different types of features, nonlinear relationships, and some class imbalance. It also provides feature importance rankings, which help show which variables contributed most to the model’s predictions.
Methods/Analysis
First attempts to gather data were made to identify data points through looking at World Health Organization, Center for Disease Control, and Center for Infectious Disease Research and Policy data. Most did not provide travel data or had limited availability. Therefore, these sources were not sufficient. To provide the required travel-linked health records, a synthetic dataset was generated. The synthetic dataset was created in R to model international travel flows between India and the United States19. It contains 300 records, where each record represents a unique combination of origin city, destination city, and travel date, along with traveller characteristics, infection outcomes, symptoms, testing, and detection results. The travel-flow data contains many zeros because many possible city pairs may have no travellers on a given date. Simple count models, such as Poisson or negative binomial models, are not ideal because they do not separate city pairs with no travel from city pairs that do have travel but may have low or variable passenger volumes. To address this, the dataset creator used a GLMM-hurdle model. The first part of the model estimates whether any travel occurs between an origin and destination city on a given date. This is the “hurdle” step and uses a binary logistic model. The second part estimates the number of travellers, but only for city pairs where travel occurs. For this positive-count step, the model uses a zero-truncated negative binomial distribution, which is appropriate because passenger counts are positive and overdispersed20,21. The model includes important travel-flow factors such as city population and great-circle distance. It also includes random effects for origin and destination cities, which help capture unmeasured differences across cities, such as tourism, economic ties, and diaspora links. Travel dates were sampled uniformly from January 1, 2020 to December 31, 2025. The final dataset consists of 300 distinct origin–destination-date combinations drawn without replacement from the full set of India–United States city pairs and possible dates. Ten disease categories were included: malaria, dengue, tuberculosis, hepatitis, COVID-19, influenza, chikungunya, leptospirosis, typhoid, and
“None.” For each travel record, the model estimated the probability of acquiring disease “d” using pathogen prevalence at the origin city, pathogen prevalence at the destination city, in-flight transmission risk, and seasonal patterns22. The probability was calculated as p(d) = [1 − (1 − prev_origin)(1 − prev_dest)(1 − ε_flight)] × S(t). In this formula, prev_origin and prev_dest are the pathogen-specific prevalence rates at the origin and destination, ε_flight represents the risk of acquiring infection during travel, and S(t) adjusts for seasonal trends, such as post-monsoon dengue peaks or winter influenza increases. Prevalence estimates were based on data patterns from the India Integrated Disease Surveillance Programme and the US CDC National Notifiable Diseases Surveillance System for 2020–202523,24. The dataset also includes symptoms, testing, and detection. Symptomatic status was assigned probabilistically, symptoms were selected from disease-specific symptom lists, and testing was modeled using RT-PCR assumptions for sensitivity and specificity. Finally, the dataset was checked to confirm that the generated data preserved meaningful relationships between variables such as distance, month, year, and infection outcomes. All categorical handling was performed programmatically through scikit-learn’s encoding utilities25.
A standard Random Forest Model was chosen after thorough research as it aligns well with the intentions of the project and is a reliable method of prediction. Random Forest models are made by using bootstrapped data sets and making different decision trees that each use a different bootstrapped data set. At each split, only a selective number of variables from the data set is considered. Ultimately, this variety is why Random Forest Models are more effective than normal decision trees. After these variables are selected, data is run down all the trees, keeping track of the results. Depending on which option received the most votes, it is concluded that this is the correct choice; this is called bagging. To know if the model is accurate, the testing or out-of-bag data is run through all the trees to see if the model classifies the sample as what was the correct target column in the data set. The proportion of out-of-bag samples that were incorrectly vs. correctly classified define accuracy12. Table outputs for Random Forest Models have four variables: Precision, Recall, F1, and Support. Precision asks: When the model predicts this disease, how many times was it right out of how many times it said it was this disease? The percentage dictates the precision. Recall asks: How often did the model predict another disease when it was not that disease? The percentage is how much it successfully predicted. F1 is the Harmonic mean of precision and recall, the combined score of model accuracy for that disease. Finally, support is the number of rows of data in the testing data set that the disease had26.
Python version 3.9.627 and Python SciKit-Learn25 were used for this project. The data was split into training and test sets using an 80/20 stratified split to preserve class proportions across both sets. The target column was labelled as “disease.” The analysis was first run using the default Random Forest parameters (“Model 1”) and then Hyperparameter tuning was optimized using RandomizedSearchCV (n_iter=30) with 5-fold stratified cross-validation optimizing macro-F1, over the parameter space: n_estimators, max_depth, min_samples_split, min_samples_leaf, max_features, bootstrap, and class_weight. The optimal hyperparameters are reported in the table below and are denoted by “Model 2”. Hyperparameters were optimized to balance model flexibility against overfitting. The number of trees in the forest was tuned to stabilize predictions by averaging out variance across the trees, while tree depth and the minimum samples required to split or form a leaf node were constrained to prevent individual trees from fitting excessively to noise in the training data. The proportion of features considered at each split was tuned to maintain diversity across trees while still allowing access to the most informative predictors, and a fixed random seed of 42 was used to ensure the results could be reproduced.
Hyperparameter Table
| Hyperparameter | Description | Value |
| n_estimators | Number of decision trees in the forest | 800 using RandomizedSearchCV |
| max_depth | Maximum depth of each tree (None = unlimited) | Selected at 30 using RandomizedSearchCV |
| min_samples_leaf | Minimum samples required at a leaf node | 1 using RandomizedSearchCV |
| min_samples_split | Minimum samples required to split a node | Selected at 10 using RandomizedSearchCV |
| max_features | Number of features considered at each split | 0.8 using RandomizedSearchCV |
| random_state | Random seed for reproducibility | 42 |
For analysis through a weighted network, to more clearly visualise the data set, a weighted network was created and edited to maximise clear visualisation of node size difference as well as outgoing cities. To do this, in-degree and out-degree values were calculated, with the in-degree property counting the number of edges pointing to a node and the out-degree property counting outgoing edges from a node, with nodes being cities28.
Results
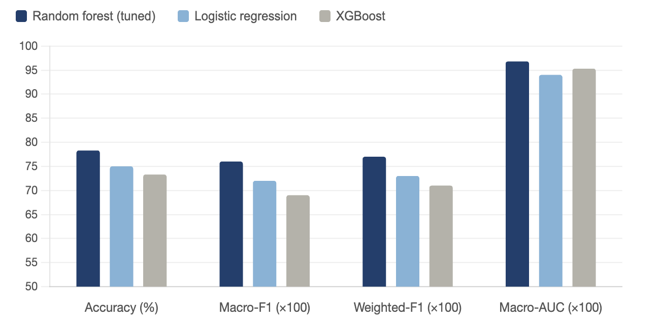
The tuned Random Forest model achieved an overall accuracy of 78.3% and a macro-AUC of 0.968, outperforming both Logistic Regression (75.0%, AUC 0.940) and XGBoost (73.3%, AUC 0.953). These results should be interpreted within the context of the synthetic dataset and not extrapolated to real-world disease prediction.
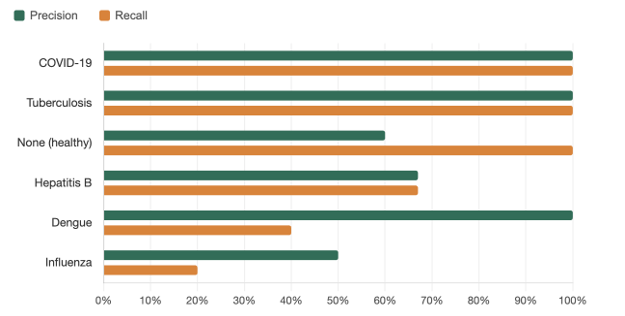
The tuned model performed best on classes with the clearest separating features in the synthetic data: COVID-19 and Tuberculosis achieved 100% precision and recall, and the “None” (no disease) class achieved 100% recall. These high scores likely reflect the structure of the synthetic data, in which these conditions were assigned distinct symptom and diagnostic profiles. Therefore, these results should be interpreted as evidence that the model recovered patterns embedded in the synthetic data, rather than real-world diagnostic accuracy.
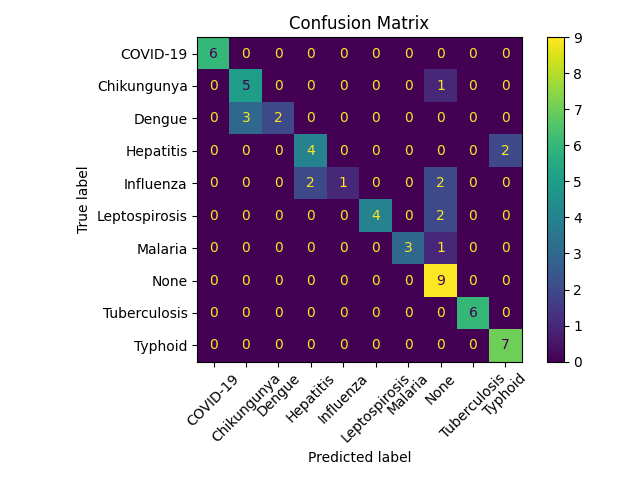
The model struggled most on Dengue (40% recall) and Influenza (20% recall). Inspection of the confusion matrix reveals specific misclassification patterns: Dengue cases were frequently misclassified as Chikungunya, and Hepatitis cases were sometimes confused with Influenza. This is not surprising given that these disease pairs share overlapping symptom profiles in the synthetic data’s symptom class. These findings are informative methodologically: they suggest that the model is sensitive to the degree of symptom overlap embedded in the generative model, and that improving the precision of symptom-disease mappings in the synthetic data would likely improve classifier performance on these classes.
When comparing the tuned Random Forest model to other types of models, the tuned Random Forest achieved the strongest overall performance, outperforming Logistic Regression and XGBoost across all reported metrics. Logistic Regression performed reasonably well, indicating some linear separability in the data, but struggled with nonlinear relationships and class imbalance. XGBoost, while typically powerful, did not surpass Random Forest, likely due to the relatively small dataset size (300 records). Random Forest’s structure allows it to model nonlinear patterns effectively while remaining stable with irregular patterns and small sample sizes, resulting in superior performance on this dataset and potentially real world dataset which may also be similarly small sample sizes.
See Table 1 Below.
| Covid 19 | Dengue | Hepatitis | Influenza | Tuberculosis | None | Total | |
| Precision | |||||||
| Model 1 (Default RF) | 100% | 100% | 67% | 100% | 100% | 56% | 84% |
| Model 2 (Tuned RF) | 100% | 100% | 67% | 100% | 100% | 60% | 84% |
| Recall | |||||||
| Model 1 | 100% | 40% | 67% | 20% | 100% | 100% | 77% |
| Model 2 | 100% | 40% | 67% | 20% | 100% | 100% | 78% |
| Accuracy | |||||||
| Model 1 | 76.7% | ||||||
| Model 2 | 78.3% | ||||||
| AUC | |||||||
| Model 1 | 94.9% | ||||||
| Model 2 | 96.8% |
Pictured below is a confusion matrix created in order to better visualize the model’s accuracy for each disease respectively.
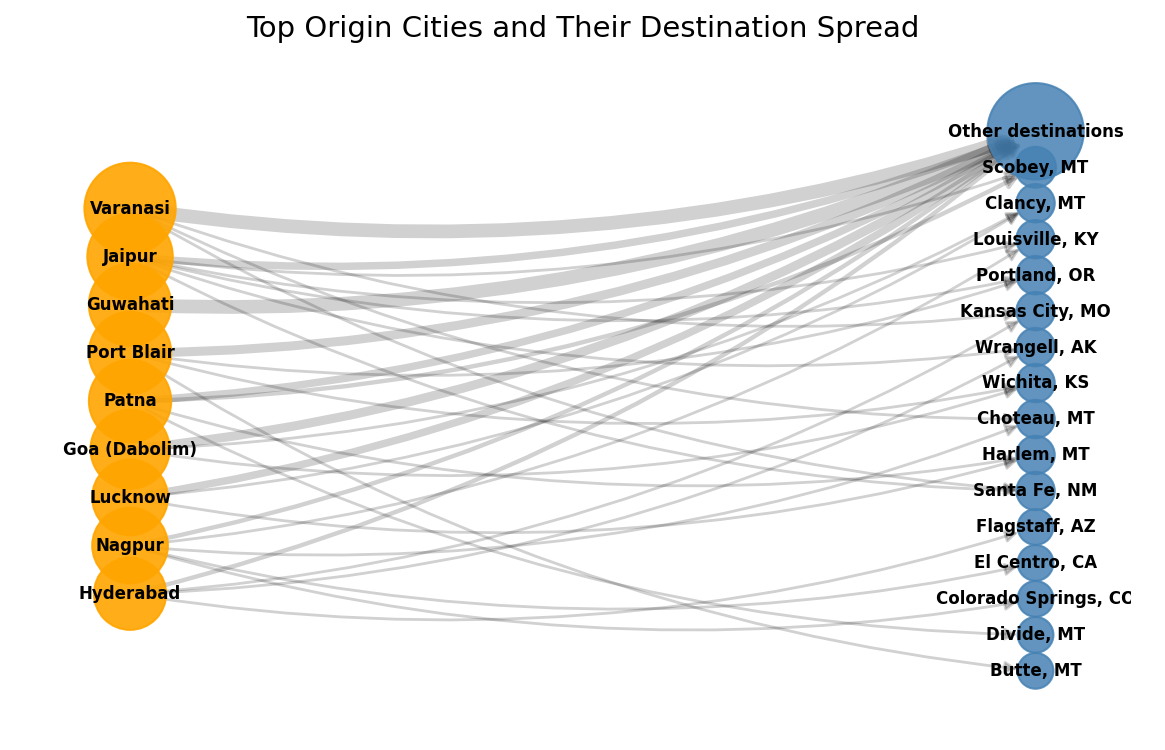
Out-degree and in-degree counts were recorded in preparation for the visualization of a weighted network. It is important to clarify that the 300 records used for classification correspond to gravity-model-derived city-pair-date observations rather than empirical passenger counts. Accordingly, the resulting network analysis characterizes the model’s connectivity structure rather than measured passenger transit volumes. Through these statistics, leading cities with the highest level of departures and therefore theoretically higher disease risk were identified to be Varanasi and Jaipur.
| US Cities (descending order) | In-Degree Count | India Cities (descending order) | Out-Degree Count |
| Wichita | 4 | Varanasi | 11 |
| Houston | 3 | Jaipur | 9 |
| Scobey, MT | 3 | Port Blair | 8 |
| Clancy, MT | 3 | Patna | 8 |
| Seely Lake, MT | 3 | Guwahati | 8 |
The appearance of small-population cities with high degree counts in Table 2 and Figure 2 is an artifact of the model’s city-pair sampling process, not a reflection of real-world travel patterns.
These outputs were saved for the creation of a weighted network, which is pictured below and highlights the top city pairs, which in the case of this synthetic data set are generally well distributed. In this visualization, larger node sizes are used for cities with more incoming or outgoing directed edges for a stronger visualization.
Discussion
The random forest model was generally able to identify disease based on patient characteristics better than standard linear models, and may be a blueprint for additional study. The model had a final accuracy of 78%, which means that the model identified enough signal for disease classification, but the result should not be interpreted as a specific measure of disease burden. This can be attributed to the small data set used for training the model. Machine Learning models in Python perform better with larger data sets29 due to the increase in training and testing data, unlike the 300 records used for this project.
The weighted city travel network visualized in this study reflects the connectivity structure embedded in the synthetic data generation process, which assigned travel flows based on city-pair probabilities derived from the GLMM-hurdle movement model. Cities with high in-degree or out-degree counts in the network (such as Wichita for US arrivals and Varanasi for Indian departures) represent cities with high modeled travel volumes in the synthetic data, not empirically validated disease transmission hubs. The network analysis is presented as a methodological illustration of how city-level connectivity data can be visualized and used to identify high-flow nodes in a travel dataset — a step that would be meaningful if applied to validated real-world travel and surveillance data.
Future work applying this framework to real travel flow and surveillance data could use network centrality measures to identify genuine high-risk corridors and prioritize screening resources30. However, this requires nationally representative travel records, real-time disease surveillance data, and external validation.
This study has several limitations that must be considered when interpreting its findings. Although the synthetic dataset employs a validated GLMM-hurdle movement model, infection probabilities, and a balanced distribution across ten disease categories — the data remains synthetic. The model’s outputs reflect the statistical structure embedded in the generative process, and while a validation GLM confirms that meaningful dependencies exist between covariates and outcomes (distance and season significantly predict infection counts, p < 0.05), the results cannot be directly extrapolated to real-world epidemiological patterns without validation against actual surveillance or clinical data. Therefore, this project may be stronger with the use of a more detailed mechanistic model. Mechanistic models build real-world stories much better than Random Forest Models do; they capture as many scenarios as possible to predict the likely spread of a disease and potential disease hotspots31. It requires a variety of inputs and well-grounded assumptions to execute and attempts to simulate biological processes that might make one more vulnerable to or protected from a disease. Due to the level of study of the author, a Random Forest Machine Learning Model was chosen.
The sample size of 300 records remains small for a ten-class classification problem. With an 80/20 stratified split and five-fold cross-validation, each fold’s test set contains approximately 60 records, yielding roughly six records per disease class. However, the per-class sample sizes remain below ideal thresholds for robust multi-class classification. Future work should explore larger synthetic datasets and assess the sensitivity of model performance to sample size. The infection model uses uniform diagnostic parameters (RT-PCR sensitivity 0.95, specificity 0.99) across all ten diseases, which does not reflect the substantial variation in diagnostic feasibility across pathogens. Rapid airport screening is realistic only for COVID-19, Influenza, and Malaria, while diseases with long incubation periods (Tuberculosis, Hepatitis B) or non-specific early presentations (Leptospirosis, Typhoid) are not applicable to point-of-entry detection. A more realistic simulation would incorporate pathogen-specific diagnostics, sampling windows, and screening protocols at places of travel and stay.
Finally, the model does not distinguish between pre-existing infection acquired before travel, in-transit acquisition during the flight, and post-arrival detection. The infection probability combines origin and destination city prevalence with a small in-flight risk, but this may be an oversimplification. Despite these limitations, this study demonstrates the feasibility of applying machine learning classification to synthetically generated traveler datasets and identifies the key methodological requirements for advancing this approach toward practical application in travel-associated disease surveillance.
To scale a project like such globally, nation-wide cooperation would be necessary to have updated outbreak information and access to more confidential records, as well as a shared agreement in combining and utilizing data for the greater health of the global population. If doctors had travel and outbreak information native to their intake systems and as part of a patient questionnaire, they would be much better informed of the types of diseases likely coming in from particular cities and countries. They could make use of a Machine Learning system to quickly glean information to provide care for travelers and safeguard the health of the country. The urgency demonstrated by the response of the recent COVID-19 global pandemic suggests that countries will be motivated to undertake this effort and understand the need for international cooperation on travel-linked health data.
References
- M. Drexler; Institute of Medicine (US). Disease Threats. What You Need to Know About Infectious Disease. National Academies Press (US), 2010. https://www.ncbi.nlm.nih.gov/books/NBK209711/ [↩]
- M. N. Lessani, Z. Li, F. Jing, S. Qiao, J. Zhang, B. Olatosi, X. Li. Human mobility and the infectious disease transmission: a systematic review. Geo-Spatial Information Science. Vol. 27, pg. 1824–1851, 2024. https://doi.org/10.1080/10095020.2023.2275619 [↩] [↩]
- C. Peng, N. Chen, B. Ming, A. Zhang, Y. Zuo, P. C. Ventura, H. Yu, M. Ajelli, J. Zhang. Understanding human mobility patterns under a public health emergency. Infectious Disease Modelling. Vol. 11, pg. 241–255, 2025. https://doi.org/10.1016/j.idm.2025.10.009 [↩]
- R. Pal et al. Impact of international travel dynamics on domestic spread of 2019-nCoV in India. Global Health. Vol. 16, No. 45, 2020. https://doi.org/10.1186/s12992-020-00575-2 [↩]
- L. Ferreira. A framework for assessing the effects of disease outbreaks on air transport. Journal of Air Transport Management. Vol. 18, No. 1, pg. 45–52, 2012 [↩] [↩]
- S. Kumar, ed. India Tourism Data Compendium 2025. Ministry of Tourism, Government of India, 2025. https://tourism.gov.in/sites/default/files/202509/India%20Tourism%20Data%20Compendium%202025_1.pdf [↩] [↩]
- J. Osei Sekyere. Next-generation sequencing in infectious-disease diagnostics: economic, regulatory, and clinical pathways to adoption. MicrobiologyOpen. Vol. 14, pg. e70104, 2025. https://doi.org/10.1002/mbo3.70104 [↩]
- V. Unnithan, P. Kumar, A. Anvekar, S. Pandari. Infectious disease outbreaks in India: urgent need for education and training reforms. Pathogens and Global Health. Vol. 117, pg. 3–4, 2023. https://doi.org/10.1080/20477724.2022.2155575 [↩]
- A. Sharma, S. Bhattacharya. Emerging/re-emerging viral diseases & new viruses on the Indian horizon. Indian Journal of Medical Research. Vol. 138, No. 1, pg. 447–455, 2013. https://doi.org/10.4103/0971-5916.118541 [↩]
- B. Ram, R. Thakur. Epidemiology and economic burden of continuing challenge of infectious diseases in India: analysis of socio-demographic differentials. Frontiers in Public Health. Vol. 10, pg. 901276, 2022. https://doi.org/10.3389/fpubh.2022.901276 [↩]
- V. Nivethitha, R. A. Daniel, B. N. Surya, G. Logeswari. Empowering public health: leveraging AI for early detection, treatment, and disease prevention in communities — a scoping review. Journal of Postgraduate Medicine. Vol. 71, No. 2, pg. 74–81, 2025. Epub 2025 Jun 9. https://doi.org/10.4103/jpgm.jpgm_634_24. PMID: 40488301; PMCID: PMC12236417 [↩]
- J. Probst, M. N. Wright, A. L. Boulesteix. Hyperparameters and tuning strategies for random forest. Wiley Interdisciplinary Reviews: Data Mining and Knowledge Discovery. Vol. 9, pg. e1301, 2019. https://doi.org/10.1002/widm.1301 [↩] [↩]
- Y. Rimal, N. Sharma, S. Paudel, A. Alsadoon, M. P. Koirala, S. Gill. Comparative analysis of heart disease prediction using logistic regression, SVM, KNN, and random forest with cross-validation for improved accuracy. Scientific Reports. Vol. 15, pg. 93675, 2025. https://doi.org/10.1038/s41598-025-93675-1 [↩]
- J. L. Fernández-Martínez, J. A. Boga, E. de Andrés-Galiana, et al. A machine learning model for evaluating imported disease screening strategies in immigrant populations. The American Journal of Tropical Medicine and Hygiene. Vol. 105, No. 5, pg. 1413–1419, 2021. https://doi.org/10.4269/ajtmh.20-1443 [↩]
- I. Araf, A. Idri, I. Chairi. Cost-sensitive learning for imbalanced medical data: a review. Artificial Intelligence Review. Vol. 57, pg. 80, 2024. https://doi.org/10.1007/s10462-023-10652-8 [↩]
- A. Gonzales, G. Guruswamy, S. R. Smith, D. Samartzis, D. J. Schlueter. A narrative review of synthetic data in healthcare: applications, limitations, and future directions. npj Digital Medicine. Vol. 6, No. 1, pg. 203, 2023. https://doi.org/10.1038/s41746-023-00962-3 [↩]
- A. Goncalves, P. Ray, B. Soper, J. Stevens, L. Coyle, A. P. Sales. Generation and evaluation of synthetic patient data. BMC Medical Research Methodology. Vol. 20, pg. 108, 2020. https://doi.org/10.1186/s12874-020-00977-1 [↩]
- M. Giuffrè, D. L. Shung. Harnessing the power of synthetic data in healthcare: innovation, application, and privacy. npj Digital Medicine. Vol. 6, pg. 186, 2023. https://doi.org/10.1038/s41746-023-00927-3 [↩]
- R Core Team. R: A Language and Environment for Statistical Computing. R Foundation for Statistical Computing, Vienna, Austria, 2023. https://www.R-project.org/ [↩]
- C. X. Feng. A comparison of zero-inflated and hurdle models for modeling zero-inflated count data. Journal of Statistical Distributions and Applications. Vol. 8, Article 8, 2021. https://doi.org/10.1186/s40488-021-00121-4 [↩]
- A. Arab. Spatial and spatio-temporal models for modeling epidemiological data with excess zeros. International Journal of Environmental Research and Public Health. Vol. 12, No. 9, pg. 10536–10548, 2015. https://doi.org/10.3390/ijerph120910536 [↩]
- A. Mangili, M. A. Gendreau. Transmission of infectious diseases during commercial air travel. The Lancet. Vol. 365, pg. 989–996, 2005. https://pmc.ncbi.nlm.nih.gov/articles/PMC7134995/ [↩]
- Global Health Data Exchange. India Integrated Disease Surveillance Programme (IDSP): Weekly Outbreaks. Institute for Health Metrics and Evaluation, 2026. https://ghdx.healthdata.org/series/india-integrated-disease-surveillance-programme-idsp-weeklyoutbreaks [↩]
- Centers for Disease Control and Prevention. National Notifiable Diseases Surveillance System (NNDSS): Notifiable Infectious Disease Data Tables. CDC, 2026. https://www.cdc.gov/nndss/infectious-disease/index.html [↩]
- F. Pedregosa, G. Varoquaux, A. Gramfort, V. Michel, B. Thirion, O. Grisel, M. Blondel, P. Prettenhofer, R. Weiss, V. Dubourg, J. VanderPlas, A. Passos, D. Cournapeau, M. Brucher, M. Perrot, E. Duchesnay. Scikit-learn: machine learning in Python. Journal of Machine Learning Research. Vol. 12, pg. 2825–2830, 2011. https://jmlr.org/papers/v12/pedregosa11a.html [↩] [↩]
- S. A. Hicks, I. Strümke, V. Thambawita, M. Hammou, M. A. Riegler, P. Halvorsen, S. Parasa. On evaluation metrics for medical applications of artificial intelligence. Scientific Reports. Vol. 12, pg. 5979, 2022. https://doi.org/10.1038/s41598-022-09954-8 [↩]
- G. Van Rossum, F. L. Drake. Python 3 Reference Manual. Python Software Foundation, 2009. https://www.python.org [↩]
- A. A. Hagberg, D. A. Schult, P. J. Swart. Exploring network structure, dynamics, and function using NetworkX. Proceedings of the 7th Python in Science Conference (SciPy 2008). pg. 11–15, 2008. https://proceedings.scipy.org/articles/TCWV9851 [↩]
- A. Althnian, D. AlSaeed, H. Al-Baity, A. Samha, A. B. Dris, N. Alzakari, A. Abou Elwafa, H. Kurdi. Impact of dataset size on classification performance: an empirical evaluation in the medical domain. Applied Sciences. Vol. 11, pg. 796, 2021. https://doi.org/10.3390/app11020796 [↩]
- D. Balcan, V. Colizza, B. Gonçalves, H. Hu, J. J. Ramasco, A. Vespignani. Multiscale mobility networks and the spatial spreading of infectious diseases. Proceedings of the National Academy of Sciences. Vol. 106, No. 51, pg. 21484–21489, 2009 [↩]
- J. Lessler, D. A. T. Cummings. Mechanistic models of infectious disease and their impact on public health. American Journal of
Epidemiology. Vol. 183, No. 5, pg. 415–422, 1 March 2016. https://doi.org/10.1093/aje/kww021 [↩]