

Abstract
Background. Machine learning models predict antimicrobial resistance (AMR) well in high-income countries but do not work in locations where there is no local surveillance. Despite uncontested evidence that AMR contributed to the deaths of over 1.14 million individuals in 2021, there are no adequate isolate-level data to inform empirical treatment in countries like Kazakhstan. We ask whether AMR can be predicted for a country that did not contribute any training isolates, based exclusively on macroeconomic data, public information about antibiotic usage, and organism and antibiotic identities.
Methods. About 11.3 million susceptibility results from 1.08 million isolates from 85 countries (excluding Kazakhstan) were used for training a CatBoost model. Resistance probability estimates were calculated by temporal hold-out, six-country hold-out validation, and an aggregate cross-country validation reproducing the Kazakhstan task in held-out countries. Resistance probability estimates were evaluated using AUC, recall, and expected calibration error (ECE).
Results. On the post-2020 hold-out set, CatBoost achieved an AUC of 0.851, a recall of 0.756, and a calibrated ECE of 0.014. Across six held-out countries (prevalence 11–45%), discrimination transferred well (AUC 0.80 – 0.86) while calibration degraded in higher-prevalence settings, where resistance was under-predicted. Of 454 organism–antibiotic–year inferences in Kazakhstan, 65.4% exceeded the 20% threshold, with Acinetobacter baumannii highest.
Conclusions. Macro-feature transfer can support AMR testing in data-limited countries/territories, indicating which combinations to test first and not serving as a replacement for surveillance.
Keywords: antimicrobial resistance; cross-country transfer learning; CatBoost; surveillance gap; Kazakhstan.
Introduction
Antimicrobial resistance (AMR) affects people and their communities, directly contributing to the deaths of 1.14 million people in 2021 due to AMR alone1 and 4.71 million deaths overall associated with AMR. By 2050, AMR is estimated to lead to 10 million cases a year worldwide2 and losses to global GDP of up to 3.4 trillion USD annually by 20303. In reality, AMR is a global problem, but its impact is not felt uniformly; in LMICs this can be attributed to a lack of the necessary infrastructure, laboratory diagnostic tools, and infection control capacities. Isolate data from global surveillance (WHO GLASS, ATLAS, SIDERO-WT) are highly skewed towards data from high-income countries, and resistance in LMICs is woefully under-represented. Central Asia, including Kazakhstan, is a clear blind spot in global AMR monitoring due to limited microbiology laboratory capacity, suboptimal antimicrobial surveillance systems in post-Soviet countries, and an incomplete nationwide AMR surveillance program in Kazakhstan4. This motivated us to examine cross-country generalization, which we define as predicting resistance in a country where no data were used to train or validate the model, in this case applied to Kazakhstan, where no Kazakhstani data were used in training or validation of the model (global data only).
Epidemiological predictors such as local temperature have been linked to AMR without genomic information5, and phenotypic methods have also proved successful. All existing methods of validation, however, rely on isolates collected specifically within the study area, so for Kazakhstan, such isolates are not available, and Kazakhstan has rather few data sources. The most serious error is a false negative (i.e., not reporting a resistant isolate as resistant), which results in undertreatment of an infection or inappropriate empirical treatment. This surveillance gap is addressed by a CatBoost model trained on global data and evaluated using only publicly accessible macroeconomic indicators and antibiotic consumption data as input features.
This is, to our knowledge, the first time data-free cross-country prediction of AMR is applied in a Central Asian country – Kazakhstan. First, three non-local approaches are proposed, namely temporal splitting, six-country hold-out, and rolling-origin CV. Second, we demonstrated the feasibility of these common data in order to select priority tests that can be applied in areas with less data available (hypothesis generation), a task that could be easily replicated in numerous areas that are sparsely surveyed. In Kazakhstan, where no national isolate-based system is established, the principle is based on the choice of which organism–antibiotic combination should be tested first. The resistance probability estimates generated by the model based on the global surveillance data, without using any clinical data from Kazakhstan and with only macro-level features and antibiotic consumption data, would be sufficient for prioritizing antibiotics using the 20 percent clinical actionability threshold.
Methods
Study Design
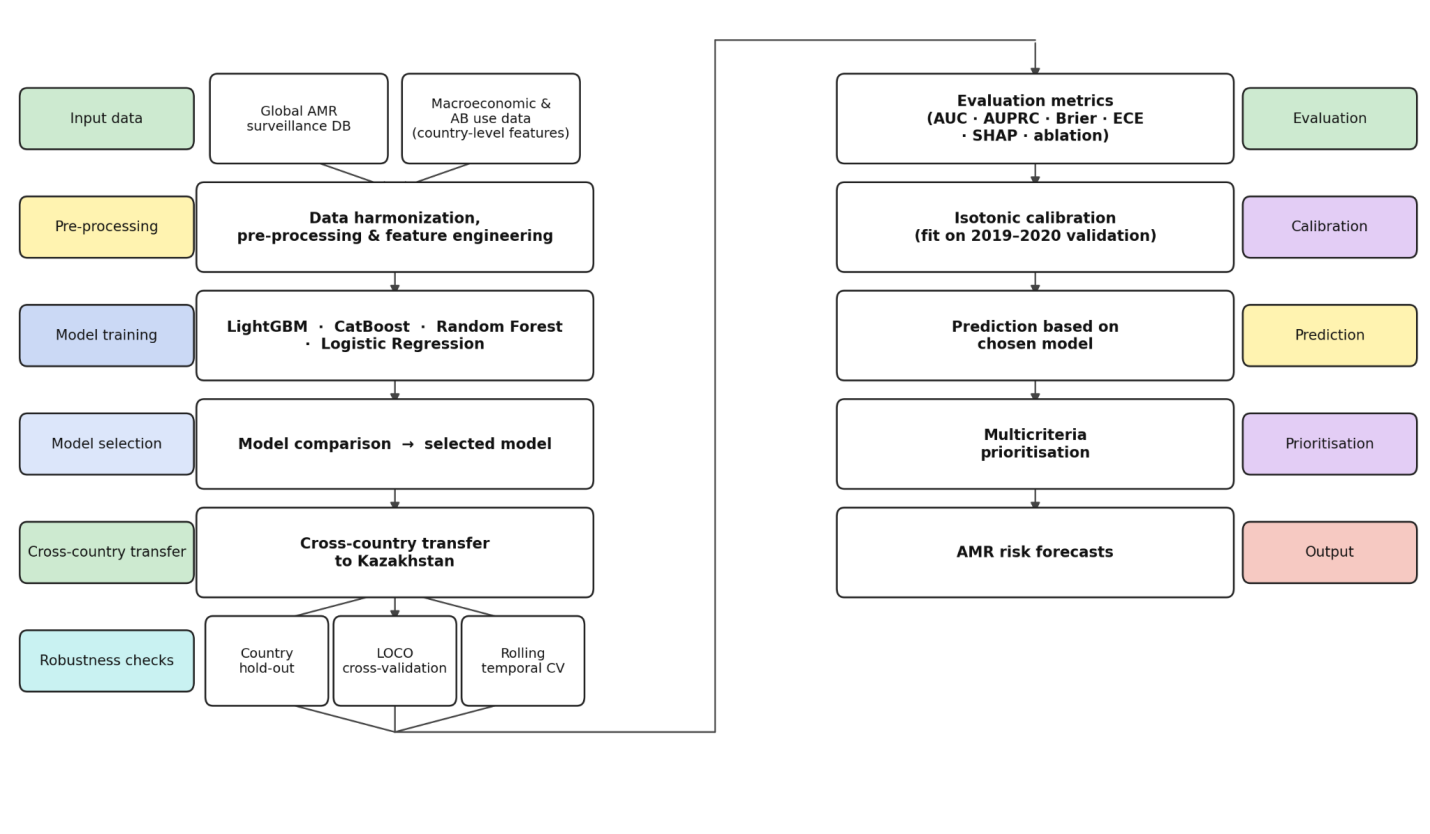
A cross-country prediction approach to forecasting AMR patterns for Kazakhstan without the need for local data to be used for model training is introduced in this paper. The proposed pipeline is shown in Figure 1. Two input datasets are used – global AMR surveillance and macro-economic and antibiotic consumption at the national level. Firstly, the global AMR dataset is preprocessed, harmonized, and feature engineered; next, four machine learning models, including LightGBM, CatBoost, Random Forest, and Logistic Regression, are trained to determine the most suitable model among the candidates, excluding Kazakhstan from the sample. Once selected, this model will be transferred to the Kazakhstan domain using only macroeconomic and antibiotic consumption features as inputs. Three robustness measures are applied:hold-out, country hold-out, and rolling-origin CV; all three are possible to apply to the data with no local ground truth. Once resistance probabilities are calibrated by the model chosen (with isotonic regression trained on the period of 2019-2020), multicriteria prioritisation leads to the final risk forecast.
Data
Data Sources and Acquisition
Two types of datasets were used: a global dataset used for all model training, validation, and hyperparameter tuning, and a target dataset for Kazakhstan, where inference and post-hoc face validity were conducted and did not affect any model fitting process. Isolate-level data were obtained from three global surveillance databases accessed via Vivli.org: ATLAS (Pfizer)6, SIDERO-WT (Shionogi)7, KEYSTONE8, following applications for data access. The data on consumption of antibiotics (DDD per 1,000 inhabitants per day) were obtained from Wang et al.9. Kazakhstan has no national AMR surveillance system, thus no isolate-level susceptibility data were available for model training. All features were country-level proxy features in the same feature space as the training dataset for the Kazakhstan target dataset. The national average antibiotic consumption rates from four published articles10,11,12,13 were used. The Kazakhstan feature grid was completed with six macroeconomic indicators (GDP per capita, health expenditure (% of GDP), population density, access to basic water, access to sanitation, and hospital beds per 1,000; all from World Bank Open Data, 2017–2023)14, annual mean surface temperature15, and WHO AWaRe Access percentages11,16. The features were only evaluated for their ability to produce resistance probability estimates and were not used in training or calibration of models; only published Kazakhstani resistance rates were evaluated for face validity, and they were never used in model training or calibration.
Data Harmonization
Standard names were used for column names to ensure consistency, and inconsistencies in country names were resolved using a mapping table. Codes that were assigned to an antibiotic were discarded if the code was incorrectly entered as the name of an antibiotic. One of two forms of susceptibility classification was applied, depending on the source database. ATLAS provided pre-computed susceptible (S)/intermediate (I)/resistant (R) interpretations, which were applied directly and accounted for 95.1% of the total labelled results. SIDERO-WT and KEYSTONE reported raw minimum inhibitory concentration (MIC) data, which were binarized using organism-specific clinical breakpoints (EUCAST Clinical Breakpoints v13.0 (2023)17 where available, and CLSI M100-Ed33 (2023) for organism–antibiotic combinations not covered by EUCAST). The remaining 4.9% of results were derived from MIC-based labels. Intermediate isolates were dropped to ensure a clear division between susceptible and resistant isolates. The names of antibiotics in the Kazakhstan dataset were converted to lowercase, and partial matching was performed with the global set of antibiotics; antibiotics that could not be matched were excluded from the dataset.
Feature Engineering
The AMR data were combined with macroeconomic and consumption features into a yearly country-level dataset. Features showing right skewness, where most countries have moderate values but a few wealthy countries have very high values (such as GDP and consumption data), were logarithmised using log(1 + x). For Kazakhstan, no population density data were available from the World Bank; therefore, this was calculated manually using population and surface area data. Chronological forward-filling was applied to missing values, and the global mean for each feature over the training period (prior to 2018) was used for any remaining missing values, so that no validation or test data influenced the filling. The final feature set comprised 13 features: 3 categorical (organism, antibiotic, antibiotic class) and 10 numeric (year, 9 macroeconomic features). When applied to the entire training set, forward-filling resolved most missing macro-feature values; global mean imputation was required for a median of 9.4% of country-year observations per feature, with the highest missingness in aware access pct (86.2%, 53 countries) and consumption DDD per class (57.9%, 52 countries). Core World Bank indicators (GDP per capita, population density, health expenditure) had the lowest missingness (7.9%), reflecting the fewest countries lacking World Bank reporting coverage. All features are listed in Table 1.
| Feature Type | Features |
| Categorical | organism, antibiotic, antibiotic_class |
| Numerical | year, log_gdp_per_capita, health_expenditure_pct_gdp, population_density_per_sq_km, log_consumption_ddd_per_class, sanitation_access_pct, water_access_pct, hospital_beds_per_1000, mean_temp_celsius, aware_access_pct |
Cross-Country Generalization Design
The primary model was constructed based on global AMR data and applied to Kazakhstan as an unseen region, assuming that no information about AMR status in Kazakhstan itself was known, but only proxy variables related to macroeconomic indicators and antibiotic consumption. The model was not trained, validated, or subjected to early stopping on any data from Kazakhstan. National antibiotic consumption data (defined daily doses per 1,000 inhabitants per day, 2017–2023) were combined with the six priority pathogens identified by WHO (E. coli, K. pneumoniae, S. aureus, P. aeruginosa, A. baumannii, E. faecium) to produce 454 (96 antibiotic-years × 6 organisms, after removing 122 cells across 26 intrinsic pairs per EUCAST Expert Rules v3.2 (2020)) organism–antibiotic–year inferences for Kazakhstan’s inference grid. All features were imputed and log-transformed as was done with the worldwide dataset (Sections 2.2.2–2.2.3), though the pharmacological class was also constructed.
The primary model was trained on all 85 countries (Kazakhstan contributes no isolates) using the temporal split; as Kazakhstan supplies no data, this is a global temporal model rather than a leave-one-country-out fold. For sensitivity assessment related to the choice of reference population, a post-Soviet model (Russia, Ukraine, Belarus, Lithuania, Latvia, Estonia)4,10
was also fitted, drawn from countries that share the legacy of the Soviet healthcare system. A data-driven structural-peer group was further explored using k-means clustering of standardized country-level macroeconomic and consumption indicators (k = 6); however, Kazakhstan emerged as a singleton cluster, with its closest neighbours being mostly post-Soviet and Eastern European middle-income countries. As no distinct peer group could be formed, no structural-peer comparison was conducted, and inference relied on the global temporal model.
Model Development
The following algorithms were experimented with: gradient-boosted models (LightGBM, CatBoost) and ensemble/interpretable baselines (Random Forest, Logistic Regression). For the gradient-boosted models, positive-class weight (scale_pos_weight) was used to handle class imbalance (resistant/susceptible ≈ 1:4), while balanced class weights were applied for Logistic Regression and Random Forest. To prevent evaluation countries from influencing model selection, hyperparameters were tuned once on a pool that excluded all held-out evaluation countries, Kazakhstan, and its regional peers, and were then held fixed across every country-hold-out fold; only the class-imbalance weight and the early-stopping iteration were recomputed within each fold from its own training data.
Evaluation Methods
General Evaluation Metrics
The following metrics were used to assess the models’ performance: ROC-AUC (Area Under the Curve, ROC-AUC referred to as AUC throughout), AUPRC (Area Under the Precision-Recall Curve), recall, F1 score, calibration-based metrics (Brier score and BSS: Brier Skill Score), and ECE (Expected Calibration Error). For this reason, recall and AUPRC were selected as co-primary metrics because overall accuracy is misleading under class imbalance18.Clinically, a false-susceptible call is the costlier error, since it risks inappropriate treatment of a resistant infection.
Calibration Methods
Calibration was evaluated using ECE and BSS. Isotonic regression was fitted on the 2019–2020 validation cohort and applied to the test set and the Kazakhstan inference grid. Because calibration data came mainly from higher-income countries, transferring absolute probabilities may incur domain shift; the extent of this shift was assessed empirically in the held-out countries (Section 4.6) rather than assumed.
Pairwise Model Comparison Method
Six paired comparisons of AUCs were performed between the four candidate models using the DeLong test19. The main procedure was Benjamini-Hochberg FDR correction: a collection of 6 raw p-values (one for each test) was assembled, and each p-value was corrected for FDR using the standard step-up procedure (p-values were ranked, and each was compared to the modified critical value 0.05 × (i/6), where i is the rank). At α = 0.05, significance was determined based on the corrected p-value. For a full picture, Bonferroni-corrected p-values (typically a conservative correction with a large n) are also reported along with Benjamini-Hochberg FDR correction.
Validation Methods
For geographic generalization, six countries were each held out entirely (no training or early-stopping data from the held-out country). A temporal robustness evaluation technique was adopted: rolling-origin (expanding-window) cross-validation. The training set consisted of all data up to the year specified, and the validation set consisted of data from the following year. Thus, validation data were always in the future relative to the training data (≤2016 → 2017, ≤2017 → 2018, ≤2018 → 2019, ≤2019 → 2020). The leakage-safe discipline of the main pipeline was followed: parameters (imputation, scale_pos_weight, isotonic calibration) were re-derived using the training data from each fold, and early stopping was applied to an inner subset of the training years, not the validation year. Discrimination (AUC, AUPRC) was computed from raw scores, while calibration-dependent measures were computed from probabilities after isotonic calibration.
Spearman’s rank correlation analysis was used to examine the trend in predicted resistance in Kazakhstan, with false-discovery rate (FDR) correction based on the Benjamini-Hochberg procedure at the organism level (2017–2023) for the six pathogens.
Feature Analysis Methods
Feature importance was computed for the CatBoost model using the PredictionValuesChange metric, while SHAP values were computed on the stratified test set (n = 5,000) using TreeExplainer20. Note that the two measures can yield different rankings when there is temporal correlation among features: PredictionValuesChange measures the difference across all predictions, and SHAP measures the marginal contribution of each feature.
Face Validity Method
The primary model’s calibrated resistance probabilities were compared with the resistance rates reported in published clinical studies in Kazakhstan to check face validity. Antibiotic–pathogen combinations were chosen that were reported with explicit resistance percentages for the pathogen with clear endpoints, and combinations of these antibiotic–pathogen relations were present in the inference grid. For each of the combinations, the predicted value was the average calibrated probability for the years in question. There was an expected downward bias because the model estimates national-level resistance while the studies reported higher-acuity hospitalized subpopulations, which necessitated a directional interpretation of the comparisons with an absolute deviation of more than 25 percentage points recorded as a substantive difference. Since there were a limited number of similar combinations (n = 4), a formal statistical test was not used.
Data Availability
The data and code reported in this article are made available on Zenodo (https://doi.org/10.5281/zenodo.20713093 ). The deposit contains a single reproducibility notebook implementing the full pipeline, together with the supplementary reference tables (reference_tables.pdf: organism-specific MIC breakpoints, antibiotic-to-class and Kazakhstan antibiotic name mappings, and per-model hyperparameters) and the complete antibiotic–organism–year resistance-probability grid for Kazakhstan (kz_prediction_table.csv). The global isolate-level training data (ATLAS: Pfizer6 ; SIDERO-WT: Shionogi7; Paratek : KEYSTONE8 are governed by Data Use Agreements with Vivli and cannot be redistributed freely; reproducing the full training pipeline therefore requires a separate data-access application through Vivli.
Ethics
Only de-identified, aggregate, or publicly available data and isolate-level susceptibility data obtained under data-use agreements were used in this study. The study did not include human subjects, biological specimens, or identifiable patient information, and informed consent was not required. This study was reviewed and determined to be exempt from institutional review board (IRB) review.
Results
Data Overview
The final dataset included 11,275,172 susceptibility results from the countries, spanning the 19-year period between 2004 and 2023, indicating resistance or susceptibility to a specific antibiotic. Resistant results accounted for 19.8% (2,236,071 resistant samples out of 11,275,172). Under the temporal split, there were 7,203,908 training records (≤2018, 18.9% resistant), 1,601,179 validation records (2019–2020, 21.6% resistant), and 2,470,085 hold-out test records (>2020, 21.4% resistant).
Model Performance
The hold-out dataset, >2020, was used for two models that were equally good, and were highest for AUC (CatBoost 0.851 and LightGBM 0.851), with the former also being highest on AUPRC (0.652); CatBoost was chosen as the final model (Section 2.5.1, Table 2). Gradient-boosted models were significantly better than the other models after Benjamini–Hochberg correction of DeLong p-values (p_BH < 0.001), with no significant difference between the models (ΔAUC = 0.0000, p = 0.91). Isotonic regression did not change CatBoost AUC (Table 2), and reduced its ECE from 0.173 to 0.0140 and raised its Brier skill score to 0.318.
| Metric | CatBoost | LightGBM | Random Forest | Logistic Regression |
| AUC | 0.8513 | 0.8512 | 0.8199 | 0.7940 |
| AUPRC | 0.6519 | 0.6481 | 0.5771 | 0.5269 |
| Brier | 0.1149 | 0.1153 | 0.1255 | 0.1335 |
| BSS | 0.3178 | 0.3142 | 0.2537 | 0.2061 |
| ECE | 0.0137 | 0.0122 | 0.0076 | 0.0135 |
| Recall@0.2 | 0.7559 | 0.7822 | 0.7376 | 0.7411 |
| Prec@0.2 | 0.4596 | 0.4447 | 0.4264 | 0.3962 |
| F1@0.2 | 0.5717 | 0.5671 | 0.5404 | 0.5163 |
| Recall@0.5 | 0.4008 | 0.4139 | 0.3255 | 0.2763 |
| Prec@0.5 | 0.7373 | 0.7082 | 0.7032 | 0.6523 |
| F1@0.5 | 0.5193 | 0.5225 | 0.4450 | 0.3882 |
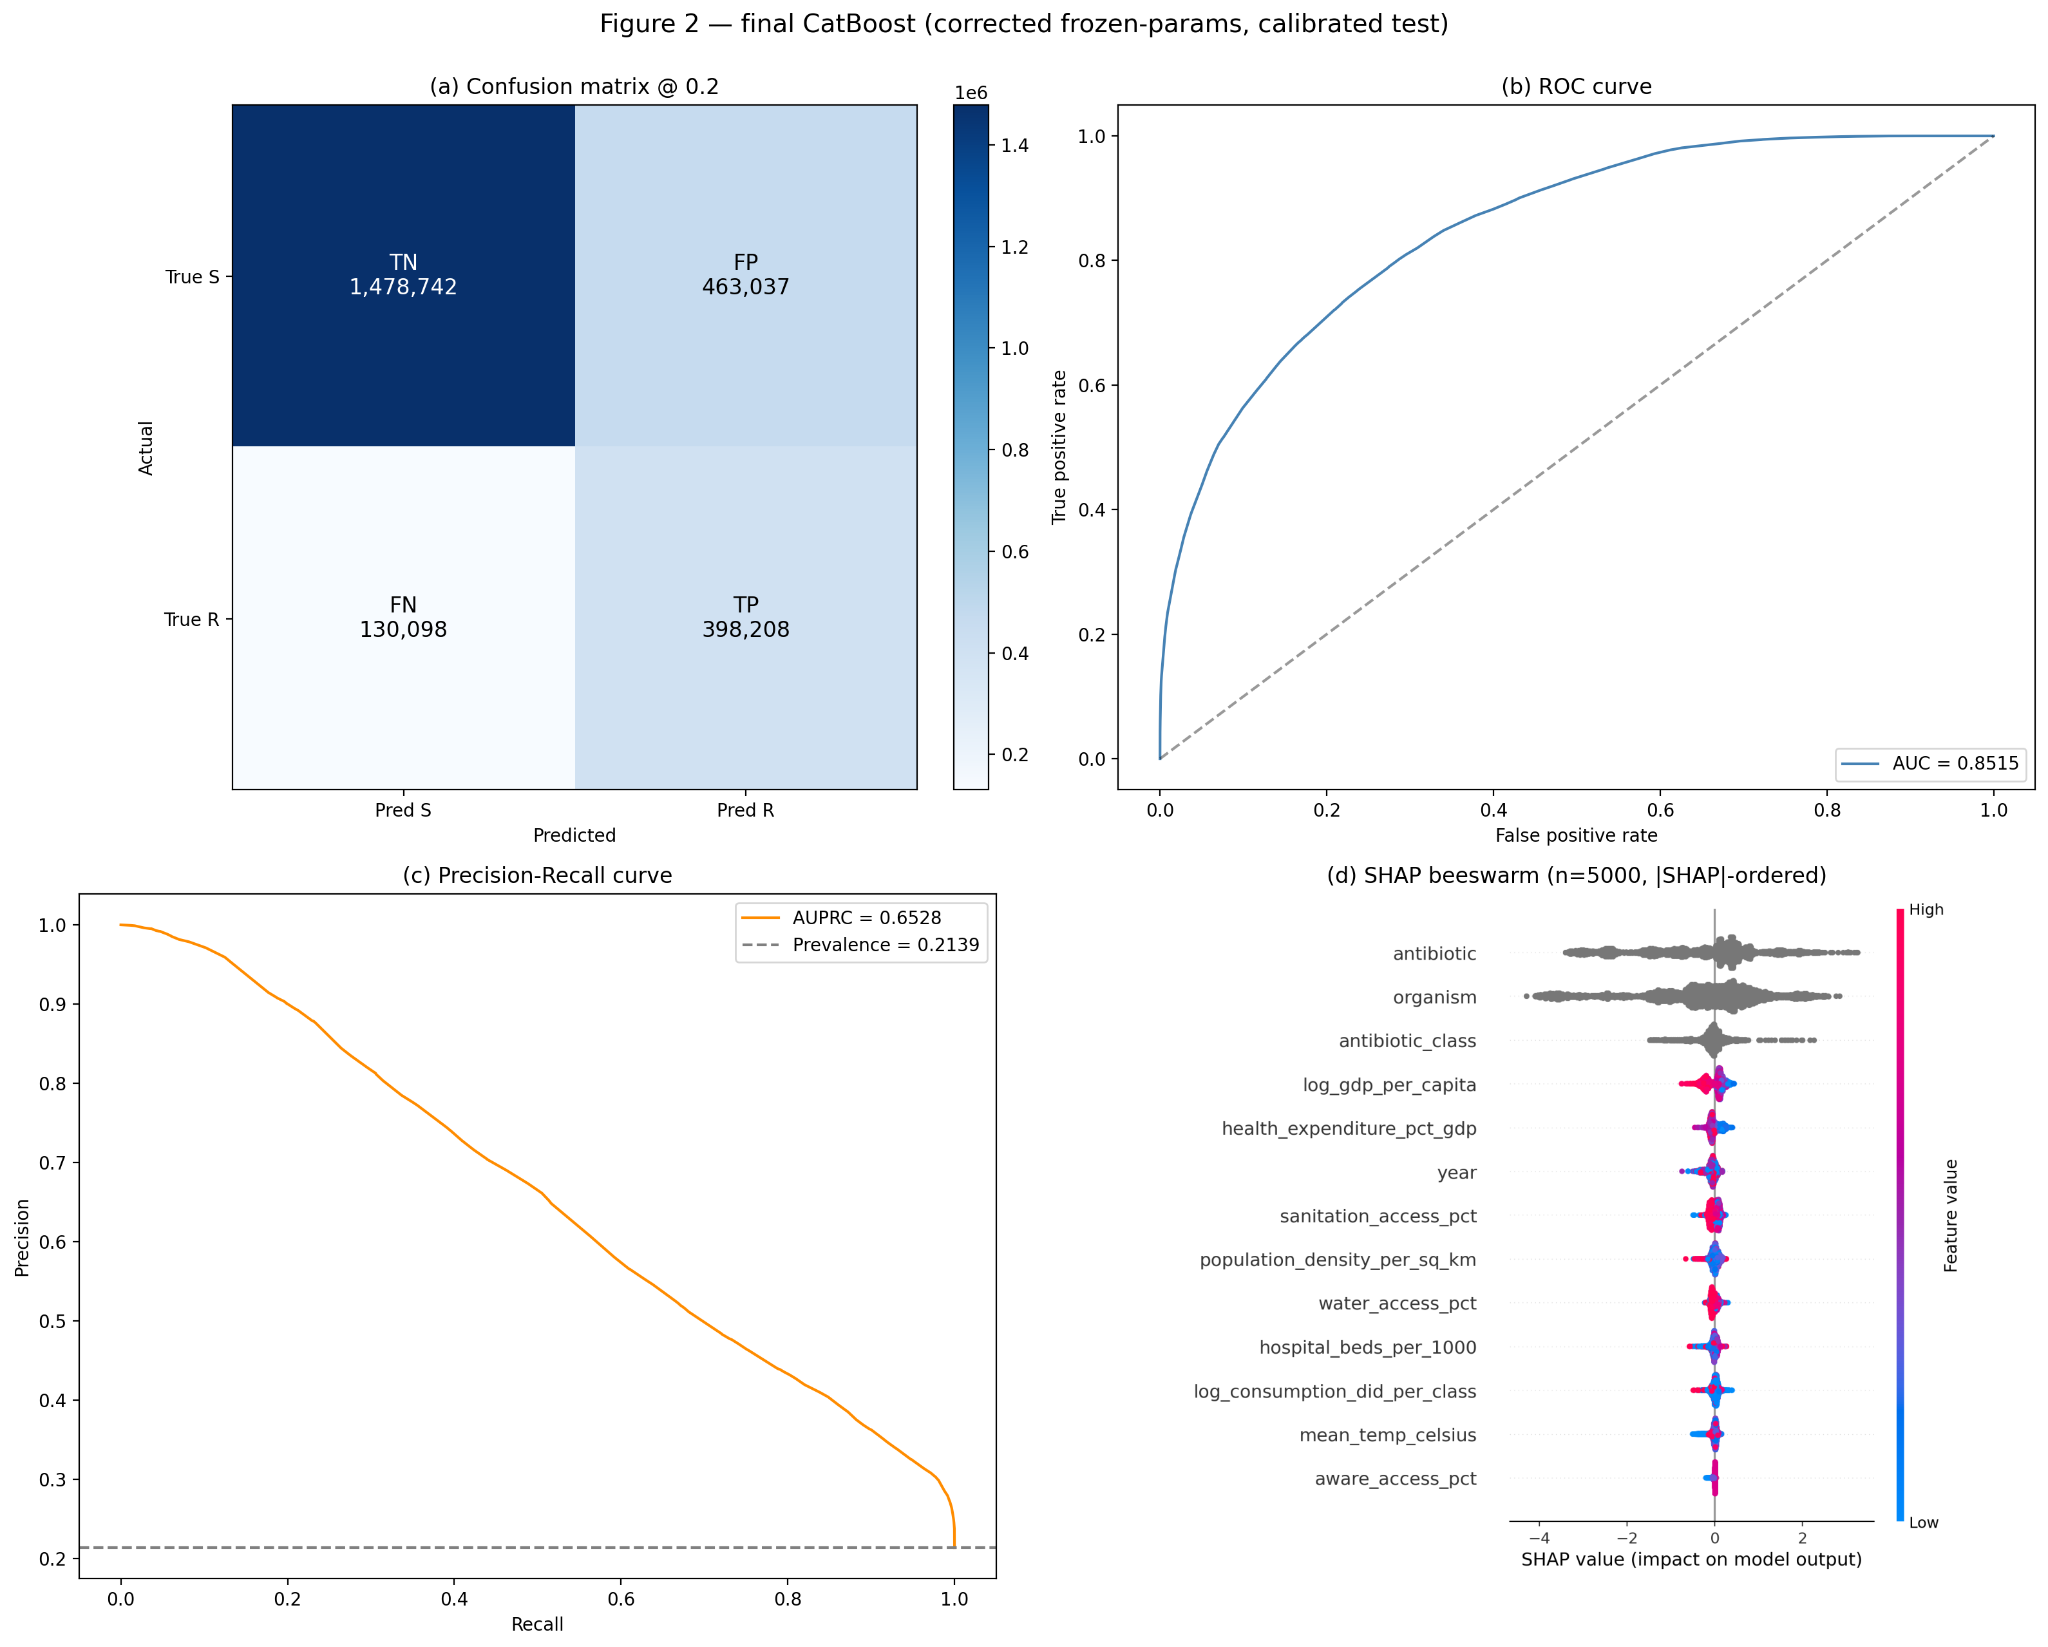
Rolling-origin cross-validation, conducted over five expanding windows (≤2016→2017; ≤2017→2018; ≤2018→2019; ≤2019→2020; ≤2020→>2020), showed a mean AUC of 0.869 ± 0.015, ranging from 0.85 to 0.89 despite resistance prevalence varying from 17.6% to 22.2% across windows. Thus, there was no “outlier” year that could be identified as an outlier or that had an impact on performance. All of the rolling-origin folds were trained with data up to the given date, excluding those from the same year but after the date, and similar performance across the folds (AUC 0.85–0.89) suggests that older data are still predictive and that the model is not simply constructed from newer data. At a threshold of 0.20, a confusion matrix was created showing true negatives = 1,478,742, false negatives = 130,098, false positives = 463,037, and true positives = 398,208 (Figure 2a). The ROC curve (Figure 2b) gave AUC = 0.8515, and the precision–recall curve (Figure 2c) gave AUPRC = 0.652 (baseline = 0.214).
Feature Analysis
The two most important features, in terms of total predictive importance, combined accounted for 63.2%, namely organism (35.9%) and antibiotic (27.3%). The most important numeric features were year (4.5%), sanitation access (4.4%), log GDP per capita (3.1%) and log antibiotic consumption DDD per class (2.9%). Pooled AUC values only varied within ±0.004 if an individual macroeconomic feature was omitted, and omission of organism and antibiotic identity reduced AUC from 0.848 to 0.618, demonstrating that the individual macroeconomic features do not contribute much to discrimination: organism and antibiotic identity are primary in driving the pooled discrimination. However, the pooled AUC mainly reflects differences in intrinsic resistance among pairs of species and is relatively resistant to within-pair variation from country to country. In each country, the three simpler versions of the model (identity-only, global prevalence lookup, and identity-plus-year) gave nearly identical predictions, with mean within-pair cross-country correlations of −0.327, −0.559, and −0.216, respectively, whereas the full version with all macroeconomic and consumption factors had a positive correlation of 0.389 and the greatest prediction spread (0.045), and the system was capable of describing the observed between-country differences in resistance prevalence characteristics of a pair; only the full version with all macroeconomic and consumption factors had cross-country variation (positive) and the system was capable of describing the observed between-country differences in resistance prevalence characteristics of a pair. Thus, macroeconomic characteristics play a limited role in explaining pooled discrimination and explain the differences across countries. The feature importance does not necessarily mean causation. The SHAP beeswarm plot (Figure 2d) demonstrated that log consumption DDD exhibited values around the zero point with a slight upward trend in SHAP, whereas high log GDP per capita was correlated with negative SHAP values, and high health expenditure was correlated with negative SHAP values. The order of the two rankings of “Year” is a result of the difference in the ranking methods (as described in Section 2.5.5).
Validation Results
The results of validation using clustering and temporal hold-out are shown in Table 3. The post-Soviet model achieved an AUC of 0.8987; the global temporal model (all countries; Kazakhstan contributes none) achieved an AUC of 0.8802 and an AUPRC of 0.7023. We calculated bootstrap prediction intervals for six held-out countries with a broad prevalence range (Table 4), finding that the width of the prediction interval was related to the number of training isolates per pair (r ≈ −0.34, and a lower number of training isolates led to wider intervals). The construction was a priori, and the six hold-out countries represent a broad prevalence range (11–45%) and different regions, not as a function of performance; isolates after 2020 for Russia were not available. Per-country (Table 4) results also suggest that performance is not related to random country selection, but rather to the prevalence of the country. The absolute probabilities had different transferability depending on the setting (calibrated Brier scores, from 0.068 in Germany to 0.227 in India). The global temporal model was adopted as a basis; the average calibrated resistance probability calculated from 454 Kazakhstan inferences was 0.338, and 65.4% of them surpassed the actionability threshold of 20%. Acinetobacter baumannii (0.643) was the highest, followed by Enterococcus faecium (0.464) and Klebsiella pneumoniae (0.404).
| Group | n_countries | n_train | n_val | val_AUC | val_AUPRC | Brier_raw | Brier_cal |
| post- soviet | 6 | 179,237 | 60,583 | 0.8988 | 0.8088 | 0.1378 | 0.1180 |
| Global temporal model (KZ) | 85 | 7,203,908 | 1,601,179 | 0.8802 | 0.7089 | 0.1529 | 0.1052 |
| Country | n_test | Prevalence | AUC_cal | AUPRC_cal | Recall@0.2_cal | Prec@0.2_cal | F1@0.2_cal | Brier_cal |
| Germany | 97975 | 0.1114 | 0.8557 | 0.5624 | 0.5347 | 0.4526 | 0.4903 | 0.0683 |
| Turkey | 54869 | 0.3388 | 0.8067 | 0.6864 | 0.7031 | 0.5790 | 0.6350 | 0.1856 |
| France | 111088 | 0.1328 | 0.8450 | 0.5597 | 0.6696 | 0.3599 | 0.4681 | 0.0828 |
| India | 110824 | 0.4533 | 0.7925 | 0.7535 | 0.7344 | 0.6482 | 0.6886 | 0.2235 |
| China | 172986 | 0.2505 | 0.7955 | 0.5866 | 0.8153 | 0.4135 | 0.5487 | 0.1503 |
| Brazil | 60683 | 0.3295 | 0.8278 | 0.7230 | 0.7146 | 0.5987 | 0.6515 | 0.1639 |
Kazakhstan Resistance Inference
| Organism | n_cells | Mean (2017–2023) | 95% CI | 2017 | 2023 | Trend |
| A. baumannii | 66 | 0.6429 | 0.5759-0.7073 | 0.6531 | 0.6682 | rising |
| K. pneumoniae | 83 | 0.4044 | 0.3592 0.4617 | 0.3580 | 0.4627 | rising |
| E. faecium | 63 | 0.4639 | 0.3988 0.5091 | 0.3742 | 0.6251 | rising |
| P. aeruginosa | 56 | 0.2850 | 0.2356 0.3372 | 0.2909 | 0.3116 | rising |
| E. coli | 90 | 0.2621 | 0.2361 0.3041 | 0.2128 | 0.3391 | rising |
| S. aureus | 96 | 0.0883 | 0.0650 0.1096 | 0.0952 | 0.1187 | rising |
Table 5 lists the mean calibrated resistance probability for the six pathogens that are priority targets for the WHO, for the period from 2017 to 2023 and with 95% intervals from the training-resample ensemble of 25 models, to reflect uncertainty. We calculated bootstrap intervals for all 454 predictions, the largest of which were 46 (~10%) predictions concentrated in sparsely supported pairs (see below), and were marked as highly uncertain. The mean predicted resistance was 0.643 for Acinetobacter baumannii, 0.088 for Staphylococcus aureus (95% confidence interval [CI] 0.065–0.110), 0.404 for Klebsiella pneumoniae, and 0.464 for Enterococcus faecium. All six pathogens showed rising predicted resistance from 2017 to 2023 (e.g. E. faecium 0.374→0.625, E. coli 0.213→0.339). These predictions are a function of the input feature (year) and are therefore not tested for a statistical trend, but are shown as a descriptive trajectory. The trends in this graph are weak because they are based on only seven observations per organism per year, and should be taken as suggestions rather than an established rise.
| Organism | Antibiotic | Observed_pct | predicted_pct | difference | direction | year_range |
| A. baumannii | Gentamicin | 88.89 | 79.51 | +9.38 | within 25pp | 2022-2023 |
| A. baumannii | Ceftriaxone | 100.0 | 89.55 | +10.45 | within 25pp | 2022-2023 |
| A. baumannii | Ciprofloxacin | 100.0 | 83.51 | +16.49 | within 25pp | 2022-2023 |
| A. baumannii | Fluoroquinolones (class) | 100.00 | 81.51 | +18.49 | within 25pp | 2022-2023 |
There were two methods to test the 20% actionability threshold. The specificity was 0.92, precision was 0.86, sensitivity was 0.68, and the positive agreement rate was 80.5% with a threshold value of 0.20. By using this classification with the observed data, each organism–antibiotic–year combination was classified as predictive or not predictive in each of the six countries that were held out, suggesting that the classification is a useful separation of organism–antibiotic–year combinations that are predictive and those that are not. Note that the flagged fraction varied with the expected shift between 0.05 and 0.50, but there was no change in flagged fraction between neighbouring steps (Jaccard ≥ 0.90) for all these values; therefore, the prioritisation is not based on the value itself, 0.20, but on the changes in the fraction between records. With thresholds lowered, there was increased sensitivity and almost all combinations were selectively flagged (using a threshold of 0.05 resulted in a sensitivity of 0.89, but flagged nearly all combinations providing not useful selectivity for prioritisation); hence, the threshold was set at 0.20, at which point precision and specificity were [high/acceptable] yet limited actionability gains were achieved.
To determine an aggregate organism–antibiotic–year task, as required in the Kazakhstan use case, the procedure was reproduced in the six countries that were excluded from the analysis and compared with the observed resistance (Table 7). The mean absolute error had a moderate value of 0.129 ± 0.056; the RMSE value was moderate, at 0.201 ± 0.070; the calibration slope was 0.997 ± 0.109 (the calibration intercept was 0.084 ± 0.067); there was a tendency towards under-dispersion, but the predictions were well ordered. For each country, aggregate MAE ranged from 0.052 in Germany to 0.192 in India, and prediction-interval coverage ranged from 0.750 in Germany to 0.310 in India. Isolate discrimination alone cannot be relied upon as a guarantee of fitness for the aggregate ranking task: AUC scores were consistently high (0.79–0.85) when the test was analyzed at the isolate level.
| Country | n_cells | MAE | RMSE | Brier | Cal. slope | Cal. intercept | PI cov. | Agree@0.2 | Isolate AUC |
| Turkey | 270 | 0.186 | 0.284 | 0.081 | 1.153 | 0.131 | 0.411 | 0.789 | 0.809 |
| France | 883 | 0.077 | 0.137 | 0.019 | 0.922 | 0.019 | 0.653 | 0.851 | 0.843 |
| India | 474 | 0.192 | 0.260 | 0.068 | 1.006 | 0.178 | 0.306 | 0.707 | 0.793 |
| Brazil | 376 | 0.139 | 0.223 | 0.050 | 0.980 | 0.109 | 0.452 | 0.790 | 0.827 |
| China | 934 | 0.128 | 0.199 | 0.040 | 0.846 | 0.060 | 0.510 | 0.802 | 0.791 |
| Germany | 744 | 0.052 | 0.105 | 0.011 | 1.075 | 0.008 | 0.750 | 0.892 | 0.853 |
| Pooled (mean ± SD) | — | 0.129 ± 0.056 | 0.201 ± 0.070 | 0.045 ± 0.027 | 0.997 ± 0.109 | 0.084 ± 0.067 | 0.514 ± 0.163 | 0.805 ± 0.063 | 0.819 ± 0.026 |
Discussion
Key Findings
It was hypothesized that determinants of AMR could be used to predict AMR at a cross-country level without collecting local data. The global hold-out AUC was 0.851; the global temporal-holdout AUC was 0.8802 (was 0.8812, a non-significant difference of 0.001). Both numbers reflect the performance in training countries, but not in Kazakhstan; no Kazakhstani isolates are available, and Kazakhstan performance is not measurable. In six countries in which resistance has been observed, the Kazakhstan procedure was duplicated to measure the transfer that is dependent upon it (in this instance, an aggregate organism–antibiotic–year probability) rather than to classify individual isolates (Sections 3.4–3.5). Organism was the single most important variable (35.9% of total importance), and no removal of any macroeconomic feature had an effect greater than 0.004 on adequate classification. Therefore, most of the cross-country resistance ranking (XCR) (Section 3.3) is attributable to the species of organism and antibiotic. For Kazakhstan variation, only macroeconomic and consumption factors contribute, and these are not significant for global discrimination. The correlation of higher socioeconomic indicators (GDP) with lower predicted resistance was also parallel to the socioeconomic trend mentioned by Laxminarayan et al.22 and the most worrying pathogen was found to be A. baumannii (mean 0.643). In total, the number of inferences that were more than 20% actionable was 65.4%.
Implications
Most countries do not have AMR surveillance at the isolate level; most have published antibiotic consumption and/or country-level data, and in the meantime there is a viable framework to help prioritise limited AMR surveillance resources. A health system can, however, still be provided with a ranked organism-specific risk profile to help decide which pathogen–antibiotic combinations should be confirmed first. There are two quantities to be distinguished. Ranking of resistance (or discrimination) of the combinations carries over in a similar way across borders, without local calibration, in terms of the organism and antibiotic identity. Absolute probability is dependent on local calibration and on source-to-target similarity. These two are different, but combinations can be ranked properly even if the absolute probabilities deviate by tens of percentage points (Section 4.5). The framework is, therefore, recommended for ranking and prioritisation, and cautionary reporting of absolute probabilities is given in Section 4.6.
Model Selection
CatBoost and LightGBM are practically the same as far as discrimination is concerned (AUC 0.851 vs 0.851; DeLong ΔAUC = 0.0000, p = 0.91). CatBoost was selected based on its pre-specified co-primary metric, AUPRC (0.652 compared to LightGBM’s 0.650), but its Brier skill score is only marginally better than LightGBM’s, and the two models are otherwise similar. Isotonic calibration reduced CatBoost’s ECE to 0.0140 (in the 20% range accepted as good stewardship practice), the point at which action is warranted.
Applications and Potential Research Directions
Most existing AMR prediction models rely on genome sequencing23 or local epidemiology, including climate data, and may be limited in surveillance- and/or sequencing-poor areas. This method does not involve the use of locally isolated pathogens; it is based on macro-proxy data to predict resistance rates of all six priority pathogens. The AUCs of the hold-out data of the present method, 0.851, are in the range of per-drug genomic AUC models (0.83–0.94)24 and species-specific MALDI-TOF models (0.81–0.85)25, and are better than the patient-specific AUC models from EHR machine-learning models (0.80)26, although none of the latter methods need local, genomic, or patient-specific data. Although under a different evaluation setup than the completely data-free, target-free setup used here, the cross-country XGBoost model achieved an AUC of 0.9627 (under a different evaluation setup than the fully data-free, target-excluded setup used here). It is not intended to predict the resistance of an organism/antibiotic but is a prioritisation tool to determine which organism/antibiotic to test first as most likely to be resistant. The sampling strategy would be more directed at combinations with high prediction uncertainty for resistance and/or high clinical consequence, targeting those combinations more likely to be clinically significant and to have a chance of being resistant (Table 5).
Predicted resistance was biased towards penicillins as K. pneumoniae and E. faecium were naturally resistant to ampicillin, and this was recovered by the model, without the need to use any local data, giving face validity to the model. Cephalosporins were most common in the other classes for A. baumannii and K. pneumoniae, while fluoroquinolones were most common for E. faecium. The face validity testing was performed in only four combinations of A. baumannii from one cohort in Karaganda; no formal test was used, and the population had higher acuity than that targeted by the model. Absolute predictions were also found to be 9–18 percentage points lower than observed rates, with A. baumannii still retaining a high-risk score (all >70%). This is therefore considered a weak internal check on the ranking rather than formal external validation, since prospective Kazakhstani isolates need to be obtained for formal external validation (Section 4.7).
Limitations
The limitation is that there are no isolate-level data available across countries to train and test models. The first results will be confirmed using additional data for Kazakhstan. Not all isolates resistant to an intermediate level of the antimicrobial agent were present, nor were all of the other antimicrobial agents that are commonly used in the region. Prediction intervals in Table 5 are based on estimation uncertainty from the training-resample ensemble – not on the coverage of observed resistance – and hence should be used with caution and should not be considered as an absolute measure of prediction reliability. The data are predominantly from high-income countries. This is because the few annual observations used to make the upward temporal trend predictions (hypothesis generation signals) were low (7 per organism) and failed to reach significance after Benjamini–Hochberg or Bonferroni correction. The number of cells with at least 30 isolates (84.6%) was validated, and cells with fewer isolates trend toward higher resistance, so the errors reported correspond to a lower bound of the errors of transfer in the highest-risk combination to flag. The 85 countries that are part of this 19-year data set exhibit heterogeneity in the following four aspects: laboratory method; S/I versus MIC labelling; breakpoint standards; and sampled populations and surveillance density. This is the systematic variation that cannot be completely harmonised and can be absorbed as noise. This issue does not apply for Kazakhstan, since no training data exist; hence, any systematic differences that may exist in the training data will be propagated into the predictions. The pooled AUPRC gives an overview of performance across all organism–antibiotic combinations; errors by country in Table 7 may not be representative of those with extreme class imbalance; per-pair resistance counts were not computed, but per-country errors indicate differences in accuracy by organism–antibiotic combination. The unevenness of the calibration transfer, and the fact that this was due to the prevalence of base resistance and not macro-feature distance, were demonstrated by countries with prevalence similar to the training distribution having good calibrations (Germany and France, calibrated ECE 0.010–0.020) while high-prevalence countries did not (India, calibrated ECE 0.18). Evaluation of the absolute improvement that was achieved in estimating rare (or intrinsically high-resistance) combinations was not assessed, and is an avenue for future research. Absolute probability numbers specified in the original data cannot be easily transferred and should be used with caution in high-burden settings, like Kazakhstan, where prevalence is changing. This work was not benchmarked with routine culture-based susceptibility testing as it is designed not to replace routine testing, but to complement it; if it had been designed as a replacement for routine testing, then it should have been implemented prospectively to demonstrate the operational value of prioritising as compared to routine testing.
Future Directions
An immediate validation of 100–200 local isolates of the high-risk species A. baumannii, K. pneumoniae, and E. faecium will be performed whereby the agreement interval will be narrowed from ±25% (used for validation of the retrospective period) to ±10%. The framework can be expanded, not only to other sectors with appropriate national statistical coverage (e.g. much of Central Asia, sub-Saharan Africa and Southeast Asia), but also extended outside of them.
Conclusion
Due to the lack of data on antimicrobial resistance (AMR) in Kazakhstan, a non-genetic approach was adopted, including a country-specific approach with probabilities calculated based on information about AMR, antibiotic use and macro-economics from other countries around the world. CatBoost’s performance was the highest of all its competitors with an AUC of 0.851, an AUPRC of 0.652, and a recall of 0.756 for 11.3 million susceptibility results from 1.08 million isolates in 85 countries, the worst of which were A. baumannii, E. faecium, and K. pneumoniae. The framework does not replace the surveillance process and is meant to be a hypothesis-generation tool to consider combinations for the first test. It is not ready for clinical and public health use: no Kazakh isolates are available in training or evaluation, and predictions are not yet confirmed using local ground truth, and should be confirmed in the future to inform treatment or policy. It is restricted to this: only provisionally mapping where there is no surveillance and which can be confirmed and/or updated with simply global data.
References
- M. Naghavi, S. E. Vollset, K. S. Ikuta, et al. [GBD 2021 Antimicrobial Resistance Collaborators]. Global burden of bacterial antimicrobial resistance 1990–2021: a systematic analysis with forecasts to 2050. The Lancet. Vol. 404, pg. 1199–1226 , 2024, https://doi.org/10.1016/S0140-6736(24)01867-1. [↩]
- J. O’Neill. Tackling drug-resistant infections globally: final report and recommendations. The Review on Antimicrobial Resistance, 2016, https://amr-review.org/. [↩]
- World Bank. Drug-resistant infections: a threat to our economic future. World Bank, Washington, DC, 2017, http://hdl.handle.net/10986/26707. [↩]
- Z. Kosherova, D. Zhazykhbayeva, A. Aimurziyeva, D. Bayesheva, Y. Semenova. The implementation of antimicrobial consumption surveillance and stewardship in human healthcare in post-Soviet states: a systematic review. Antibiotics. Vol. 14, Article 749, 2025, https://doi.org/10.3390/antibiotics14080749. [↩] [↩]
- D. R. MacFadden, S. F. McGough, D. Fisman, M. Santillana, J. S. Brownstein. Antibiotic resistance increases with local temperature. Nature Climate Change. Vol. 8, pg. 510–514, 2018, https://doi.org/10.1038/s41558-018-0161-6. [↩]
- Pfizer. ATLAS database [data set]. Vivli, 2023, https://amr.vivli.org/faq/atlas/. [↩] [↩]
- Shionogi. SIDERO-WT database [data set]. Vivli, 2023, https://amr.vivli.org/faq/sidero-wt-programme/. [↩] [↩]
- Paratek. KEYSTONE database [data set]. Vivli, 2023, https://amr.vivli.org/faq/keystone/. [↩] [↩]
- L. Wang, H. Chen, Y. Zhang, Y. Tian, X. Hu, J. Wu, X. Li, H. Jia, H. Wang, C. Yu, Y. Yang, L. Fang, H. Song. Global antibiotic consumption and regional antimicrobial resistance, 2010–21: an analysis of pharmaceutical sales and antimicrobial resistance surveillance data. Lancet Global Health. Vol. 13, pg. e1880–e1891, 2025, https://doi.org/10.1016/S2214-109X(25)00308-0. [↩]
- Y. Semenova, A. Yergaliyeva, A. Aimurziyeva, A. Manatova, A. Kuntuganova, L. Makalkina, N. Aldiyarova, D. Semenov, L. Lim. A nationwide evaluation of antibiotic consumption in Kazakhstan from 2019 to 2023. Antibiotics. Vol. 13, Article 1123, 2024, https://doi.org/10.3390/antibiotics13121123. [↩] [↩]
- G. Zhussupova, D. Utepova, G. Orazova, S. Zhaldybayeva, G. Skvirskaya, K. Tossekbayev. Evaluation of antibiotic use in Kazakhstan for the period 2017–2019 based on WHO Access, Watch and Reserve classification (AWaRe 2019). Antibiotics. Vol. 10, Article 58, 2021, https://doi.org/10.3390/antibiotics10010058. [↩] [↩]
- L. Kassym, A. Kussainova, D. Semenov, A. Aimurziyeva, S. Uzbekova, Y. Semenova. National trends in azithromycin consumption during 2017–2023 in Kazakhstan: impact of the COVID-19 pandemic and the imperative for enhanced clinical guidelines. Scientific Reports. Vol. 15, Article 6309, 2025, https://doi.org/10.1038/s41598-025-91216-4. [↩]
- L. Lim, L. Kassym, A. Kussainova, B. Aubakirova, Y. Semenova, A. Jakupi. Optimizing antibiotic stewardship and reducing antimicrobial resistance in Central Asia: a study protocol for evidence-based practice and policy. PLoS ONE. Vol. 20, Article e0307784, 2025, https://doi.org/10.1371/journal.pone.0307784. [↩]
- World Bank. World Development Indicators [data set]. 2023, https://data.worldbank.org/. [↩]
- Our World in Data. Monthly average surface temperature [data set]. 2023, https://ourworldindata.org/grapher/average-monthly-surface-temperature. [↩]
- World Health Organization. AWaRe classification of antibiotics. 2023, https://www.who.int/publications/i/item/WHO-MHP-HPS-EML-2023.04. [↩]
- European Committee on Antimicrobial Susceptibility Testing. Breakpoint tables for interpretation of MICs and zone diameters, version 13.0. 2023, http://www.eucast.org. [↩]
- H. He, E. A. Garcia. Learning from imbalanced data. IEEE Transactions on Knowledge and Data Engineering. Vol. 21, pg. 1263–1284, 2009, https://doi.org/10.1109/TKDE.2008.239. [↩]
- E. R. DeLong, D. M. DeLong, D. L. Clarke-Pearson. Comparing the areas under two or more correlated receiver operating characteristic curves: a nonparametric approach. Biometrics. Vol. 44, pg. 837–845, 1988, https://doi.org/10.2307/2531595. [↩]
- S. M. Lundberg, S.-I. Lee. A unified approach to interpreting model predictions. Advances in Neural Information Processing Systems. Vol. 30, pg. 4765–4774, 2017. [↩]
- V. Strochkov, V. Beloussov, S. Orkara, A. Lavrinenko, M. Solomadin, S. Yegorov, N. Sandybayev. Genomic characterization of multidrug-resistant Acinetobacter baumannii in pneumonia patients in Kazakhstan. Diagnostics. Vol. 15, Article 704, 2025, https://doi.org/10.3390/diagnostics15060704. [↩]
- R. Laxminarayan, A. Duse, C. Wattal, A. K. M. Zaidi, H. F. L. Wertheim, N. Sumpradit, E. Vlieghe, G. L. Hara, I. M. Gould, H. Goossens, C. Greko, A. D. So, M. Bigdeli, G. Tomson, W. Woodhouse, E. Ombaka, A. Q. Peralta, F. N. Qamar, F. Mir, S. Kariuki, Z. A. Bhutta, A. Coates, R. Bergstrom, G. D. Wright, E. D. Brown, O. Cars. Antibiotic resistance — the need for global solutions. The Lancet Infectious Diseases. Vol. 13, pg. 1057–1098, 2013, https://doi.org/10.1016/S1473-3099(13)70318-9. [↩]
- A. Drouin, G. Letarte, F. Raymond, M. Marchand, J. Corbeil, F. Laviolette. Interpretable genotype-to-phenotype classifiers with performance guarantees. Scientific Reports. Vol. 9, Article 4071, 2019, https://doi.org/10.1038/s41598-019-40561-2 [↩]
- D. Aytan-Aktug, P. T. L. C. Clausen, V. Bortolaia, F. M. Aarestrup, O. Lund. Prediction of acquired antimicrobial resistance for multiple bacterial species using neural networks. mSystems. Vol. 5, Article e00774-19, 2020, https://doi.org/10.1128/mSystems.00774-19. [↩]
- N. Wiesmann, D. Enders, A. Westendorf, R. Koch, F. Schaumburg. Prediction of antimicrobial resistance from MALDI-TOF mass spectra using machine learning: a validation study. Journal of Clinical Microbiology. Vol. 63, Article e01186-25, 2025, https://doi.org/10.1128/jcm.01186-25. [↩]
- Y. Kim, I. Jeong, J.-H. Park, et al. Multi-task learning based early prediction model for antibiotic resistance using multi-institutional cohort data. Scientific Reports. Vol. 16, Article 11891, 2026, https://doi.org/10.1038/s41598-026-41185-z. [↩]
- S. Valavarasu, Y. Sangu, T. Mahapatra. Prediction of antibiotic resistance from antibiotic susceptibility testing results from surveillance data using machine learning. Scientific Reports Vol. 15, Article 30509, 2025, https://doi.org/10.1038/s41598-025-14078-w [↩]