
Abstract
Background/Objective: High accuracy on a benchmark built from altered copies of images may not mean that a model can recognize new signers or recordings. We tested what Sign Language MNIST, a 24-letter static fingerspelling dataset, can reliably show.
Methods: We examined 34,627 released images. We tested four perceptual-hash rules against 1,680 known source photographs and 8,400 controlled derivatives. We then compared image-random and source-disjoint classification on those known lineages. Finally, we evaluated models on an independent dataset of five subjects using an explicit 24-class label map.
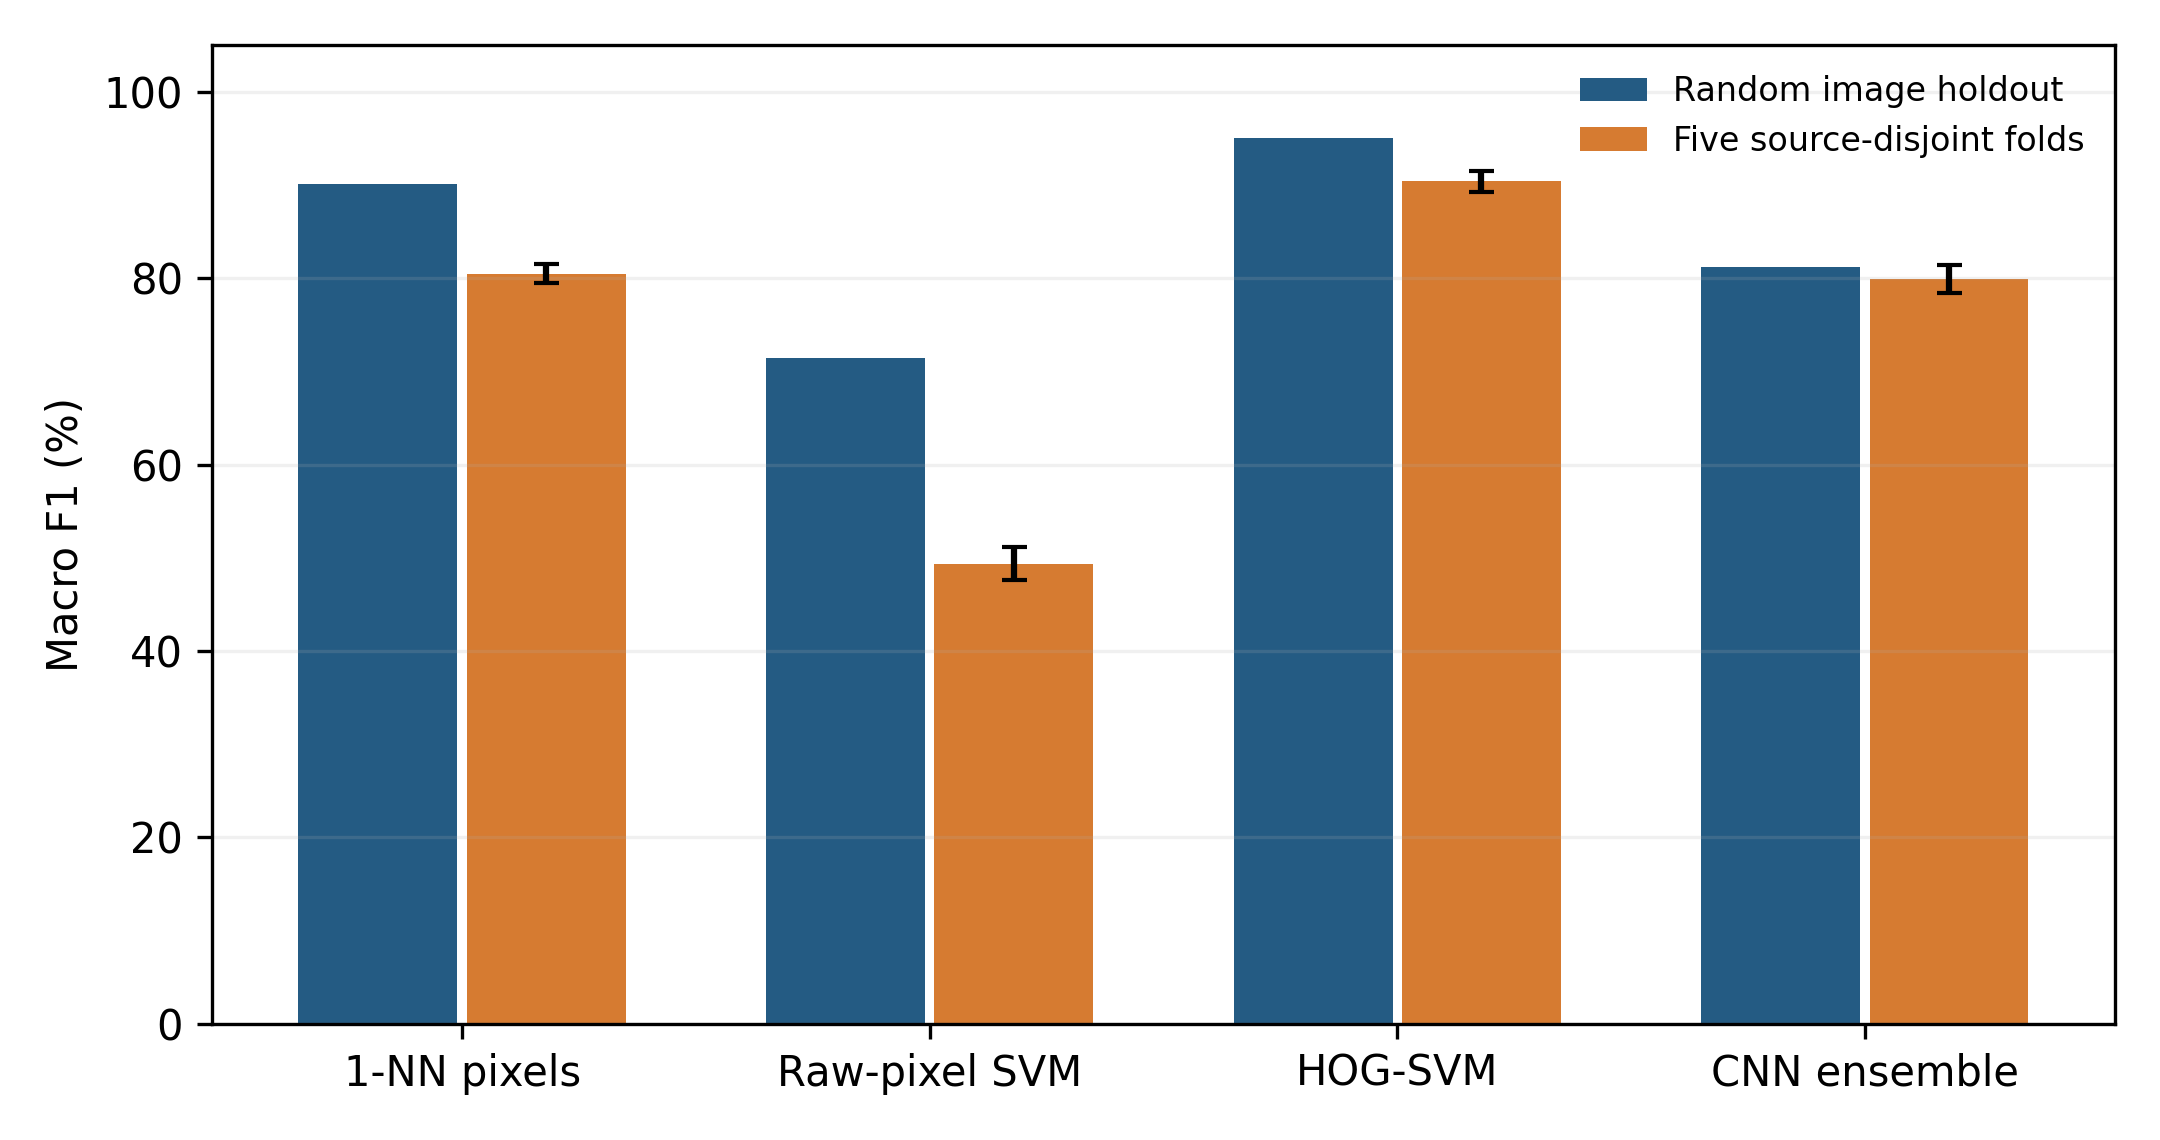
Results: Exact perceptual-hash grouping placed 97.03% of released images in groups with more than one image. However, exact-hash links had only 94.44% precision and 8.96% sensitivity for known source identity. No tested hash threshold met the prespecified 99% precision criterion. On the controlled data, one-nearest-neighbor macro F1 decreased from 90.08% with image-random testing to a fivefold mean of 80.48% with source-disjoint testing. Near-perfect internal benchmark scores also contrasted with a maximum of 7.50% subject-letter accuracy in zero-shot external transfer. An explicit label audit found no class-index shift.
Conclusions: Similarity groups can reveal dependence, but they cannot replace recorded source IDs. The main result is a measured limit on what this benchmark can support, not a new maximum accuracy score. Reliable accessibility claims require source identifiers, signer-disjoint partitions, and evaluation on independently collected data.
Keywords: American Sign Language; fingerspelling; data leakage; perceptual hashing; source-disjoint evaluation; external validation
Introduction
American Sign Language (ASL) is a complete language. An isolated hand image captures only one narrow part of it1. Recent fingerspelling and continuous-signing datasets include motion, signer variation, and context that a static alphabet benchmark does not. FSboard contains smartphone-recorded fingerspelling from many signers2. How2Sign includes continuous ASL video and several data types3. Sentence-level research also shows that recognizing fingerspelled words within signing remains difficult4. Static-letter classification is therefore a useful controlled vision task, but it is not a substitute for ASL translation.
Prior static-image studies used convolutional neural networks (CNNs) with images from several viewpoints to learn hand-shape features5. Other studies used support vector machines (SVMs) to classify geometric hand-pose features6. This work supports comparing raw pixels, spatial descriptors, and learned CNN features. However, a high image-level score alone does not show that a model will work for a new person or camera.
Prior research and the evaluation gap
Sign-language research increasingly separates signers during evaluation. ASL Citizen is a community-sourced benchmark that keeps users separate7. A large Turkish Sign Language challenge also used signer-independent testing8. Studies of Irish Sign Language hand shapes and continuous sign-language translation reported lower performance when test signers were excluded from training9,10. Signer-diversity augmentation tries to reduce this gap11. FluentSigners-50 and a Greek Sign Language learning corpus also include several signers and recording conditions12,13. Other work shows that camera viewpoint matters and that real fingerspelling appears within longer discourse14,15. Performance may also differ across demographic groups16. These studies show why signer diversity matters. They do not identify the original photograph behind each altered image in Sign Language MNIST.
Computer-vision research has found a related problem: repeated or closely related images can make a benchmark appear easier than it is. SelfClean and a revised dermatology benchmark combined automated near-duplicate detection with human or metadata checks17,18. They did not assume that a similarity score proved shared origin. An image-copy challenge tested robustness to image transformations directly19. A recent comparison of pHash with other image representations also found that hash performance depends on the type of transformation20. A geospatial-image audit showed that duplicates can cross published training and validation boundaries21. Label-error audits show that uncertain test data can even change model rankings22. COVID-19, OCT, and MRI studies found that image-level splits can overstate performance when related images come from the same subject or volume23,24,25. WILDS provides a framework for testing models when the data distribution changes26. MedMNIST v2 also shows why small-image benchmarks need clear source documentation and fixed partitions27. Dataset documentation frameworks call for explicit provenance and limits on intended use28. The main lesson is simple: researchers must define and verify which observations are truly independent.
Sign Language MNIST contains 27,455 training images and 7,172 test images. The dataset description says that these images were created by transforming a much smaller source collection29. The linked source repository organizes photographs and hand boxes by user30. However, the released CSVs do not give each row a source-photo or signer ID. This creates an important gap. Identical pixels, visual similarity, a shared original photograph, a shared signer, and transfer to a different dataset are not the same relationship. A single accuracy score can hide these differences.
Our primary contribution is a controlled test of the proposed pHash grouping rule. We use images with known origins to measure how well the rule identifies shared sources. We then revise the interpretation of the released benchmark. Two supporting analyses compare image-random and source-disjoint testing on the controlled images and audit a 24-class external-transfer test. Our directional hypothesis was that macro F1 would be lower under true source-disjoint evaluation than under image-random evaluation. We used one-nearest-neighbor classification as a diagnostic because it is sensitive to memorization. We report the size of each difference instead of choosing a significance threshold after seeing the results. The study covers isolated static letters A-I and K-Y. It does not cover motion-based J and Z, continuous signing, or translation.
Methods
Dataset and label mapping
The official Sign Language MNIST CSVs were kept separate throughout the benchmark reanalysis. Pixel intensities were divided by 255. Only the official training file was used for random validation and exact-pHash cross-validation. The official test file was used only for the published benchmark comparison. The public source archive used for this revision contained 1,680 labeled JPEGs and bounding-box CSVs. It included 10 photographs for each of 24 letters from each of seven users. The dataset page describes approximately 1,704 originals29, but the available records do not explain the 24-image difference. Source crops were converted to grayscale and resized to 28 × 28 pixels. We did not treat a nearest-source match as creator-supplied metadata.
The original integer labels follow the alphabet but omit 9 and 25, which correspond to J and Z. Table 1 shows the full mapping. Both internal and external data used the same 0-to-23 index. The audit code performs three checks. It verifies that the official CSVs contain the expected labels, each external folder name matches its letter, and the saved prediction order matches 2,400 external frame labels. A 24 × 24 subject-letter confusion matrix provides another error check. These checks show that the labels are consistent in the code. They do not prove that every folder is linguistically annotated correctly.
| Original | Letter | Index | Original | Letter | Index |
|---|---|---|---|---|---|
| 0 | A | 0 | 13 | N | 12 |
| 1 | B | 1 | 14 | O | 13 |
| 2 | C | 2 | 15 | P | 14 |
| 3 | D | 3 | 16 | Q | 15 |
| 4 | E | 4 | 17 | R | 16 |
| 5 | F | 5 | 18 | S | 17 |
| 6 | G | 6 | 19 | T | 18 |
| 7 | H | 7 | 20 | U | 19 |
| 8 | I | 8 | 21 | V | 20 |
| 10 | K | 9 | 22 | W | 21 |
| 11 | L | 10 | 23 | X | 22 |
| 12 | M | 11 | 24 | Y | 23 |
Perceptual-hash audit and calibration
SHA-256 digests of the 784 pixel values identified byte-identical rows. We also computed a 64-bit perceptual hash (pHash) from each 28 × 28 image. The hash used the upper-left 8 × 8 discrete-cosine coefficients. The median of the 63 non-DC coefficients set the bit threshold31. Pairs were compared only within the same letter. We formed descriptive similarity groups at Hamming-distance limits of zero, two, four, and six bits. The zero-bit rule was chosen before model accuracy was examined because it had the highest pairwise precision in the controlled calibration. We required a positive predictive value of at least 99% before calling any rule a valid test of shared source. Group sizes were summarized overall, by letter, and by inferred user. The inferred-user labels came from an imperfect reconstruction method.
For calibration, we made five derivatives of every known source crop. The changes used independently seeded rotation, brightness or contrast changes, translation, resampling, or noise. Together with the originals, this produced 10,080 images. Each within-letter pair was labeled positive if both images came from the same source photograph and negative otherwise. We calculated pairwise sensitivity, specificity, and precision from the linked and unlinked pairs. A false merger was a group that contained more than one known source. A false split occurred when images from one known source appeared in more than one group. These synthetic changes tested the hash rule, but they did not recreate the unknown Kaggle transformation process. Different photographs of a repeated hand pose remained negative source pairs even when they looked almost identical.
Known-source controlled experiment
We used the same 10,080 labeled images for a test in which the source of each image was known. A stratified 80/20 random image split used seed 25. We compared it with five StratifiedGroupKFold outer folds. Each outer fold kept a source photograph and all five of its derivatives together. No source ID in a source-disjoint test fold appeared in training or inner validation. The random holdout had one test partition, while the source-disjoint condition had five. These results describe the controlled collection. They are not a source-disjoint re-evaluation of the released CSVs.
We used four fixed diagnostic models. The first was one-nearest-neighbor on normalized pixels. The second was a standardized linear raw-pixel SVM with C = 0.132. The third was a linear SVM with C = 0.1 on 1,296 histogram-of-oriented-gradients (HOG) features33. The fourth was a three-seed CNN ensemble. The CNN followed a standard image-classification design34. It had three convolution-pooling stages with 32, 64, and 128 filters, two dense stages with 50% dropout, and a 24-class softmax output. AdamW used a learning rate of 0.001, a batch size of 128, and at most 25 epochs. Inner validation selected the checkpoint with the lowest validation loss, with early stopping after five epochs without improvement. The inner validation data came only from each outer training portion. In the source-disjoint condition, they were also grouped by source. Random rotation, translation, and zoom were used only during training. CNN refits used seeds 25, 37, and 49. Their predicted probabilities were averaged for ensemble classification. The raw-pixel SVM scaler was fitted only on the outer training data. No validation or test data were used to fit it.
Classification protocols and models
For comparison with the submitted analysis, we kept three evaluation conditions for the released CSVs. The first was a stratified image-random 80/20 validation split of the official training file. The second used five exact-pHash-group folds within that file. The third used the untouched official test file. Exact-pHash grouping prevents identical same-letter hashes from crossing a fold. However, the calibration showed that these folds cannot be called source-disjoint. In the nested fivefold model comparison, grouped inner folds selected the SVM C value from 0.01, 0.1, and 1.0. Group-disjoint inner validation selected standard and compact residual CNN settings. Each model was then refitted on the outer training fold with three seeds. The epoch count came from the seed-25 inner-validation run and was used for all three refit seeds. Residual connections provided an architecture comparison, not a newly proposed method35. Macro F1 was the main multiclass outcome. Accuracy, macro precision, and macro recall were secondary outcomes. In a separate five-seed test, CNNs with no augmentation and training-only augmentation used the same architecture, validation data, and checkpoint rule.
After the fold-3, seed-37 residual refit failed, we ran an additional test to find the cause. We repeated the same refit for 20 epochs. At epochs 11 and 20, we measured performance in training mode and inference mode on the outer-training and outer-test partitions. We also repeated the exact 11-epoch refit. We evaluated it before and after one pass over the outer-training images with training behavior enabled and no gradient updates. This pass updated the moving statistics in the 11 BatchNormalization layers. A direct array comparison confirmed that every trainable weight stayed unchanged. These tests described a failure that had already been observed. They did not choose a replacement model or change any main result.
We kept source and user reconstruction only as a sensitivity analysis. Within each letter, every released image was matched to the closest of 70 source crops using pHash distance and normalized-pixel correlation. The user margin was the best score from another user minus the best score overall. This value is always nonnegative, so a positive margin does not prove that the match is correct. On 8,400 controlled derivatives, the method recovered the correct source photograph 77.63% of the time and the correct user 90.82% of the time. Under translation, those values fell to 16.37% and 60.83%. At a margin threshold of 12.10, source recovery increased to 96.10%, but coverage of controlled queries fell to 50%. This threshold cannot guarantee 96.10% accuracy on released images because their sources and transformations are unknown. We do not treat any reconstructed source or user identity as ground truth.
External validation
The independent fingerspelling sequences from Pugeault and Bowden contain the same 24 static-letter categories from five subjects36,37. We prespecified 20 frames from the central half of each subject-letter sequence. This produced 2,400 frames and 120 subject-letter units. We applied the Sign Language MNIST models without retraining. We tested full-frame grayscale resizing, a center crop, and a depth-guided crop. The main outcome was majority-vote accuracy across the 120 subject-letter units. We did not count repeated video frames as 2,400 independent tests. A leave-one-subject-out HOG-SVM trained within the external dataset checked whether the crops and labels contained learnable information. We verified the class mapping in Table 1 before interpreting the external predictions.
Statistical analysis and reproducibility
All percentages were recalculated from saved predictions or JSON outputs rather than copied from the original manuscript. The calibration included every within-letter pair. The zero-bit descriptive rule was chosen without looking at classifier scores. The controlled random-versus-source comparison is descriptive because it compares one random split with five source-disjoint folds. Existing CNN comparisons report the mean and sample standard deviation across five seeds. The nested exact-hash comparison reports pooled out-of-fold macro F1. Group-bootstrap intervals are provided in Supporting Information. The external Wilson interval uses the 120 subject-letter units. The supporting package contains code, seeds, software versions, mapping checks, calibration counts, confusion matrices, and numeric outputs. Ethical considerations: This study used publicly available, de-identified image data. No participants were recruited or contacted, and institutional review board approval was not required.
Results
Similarity structure and hash calibration
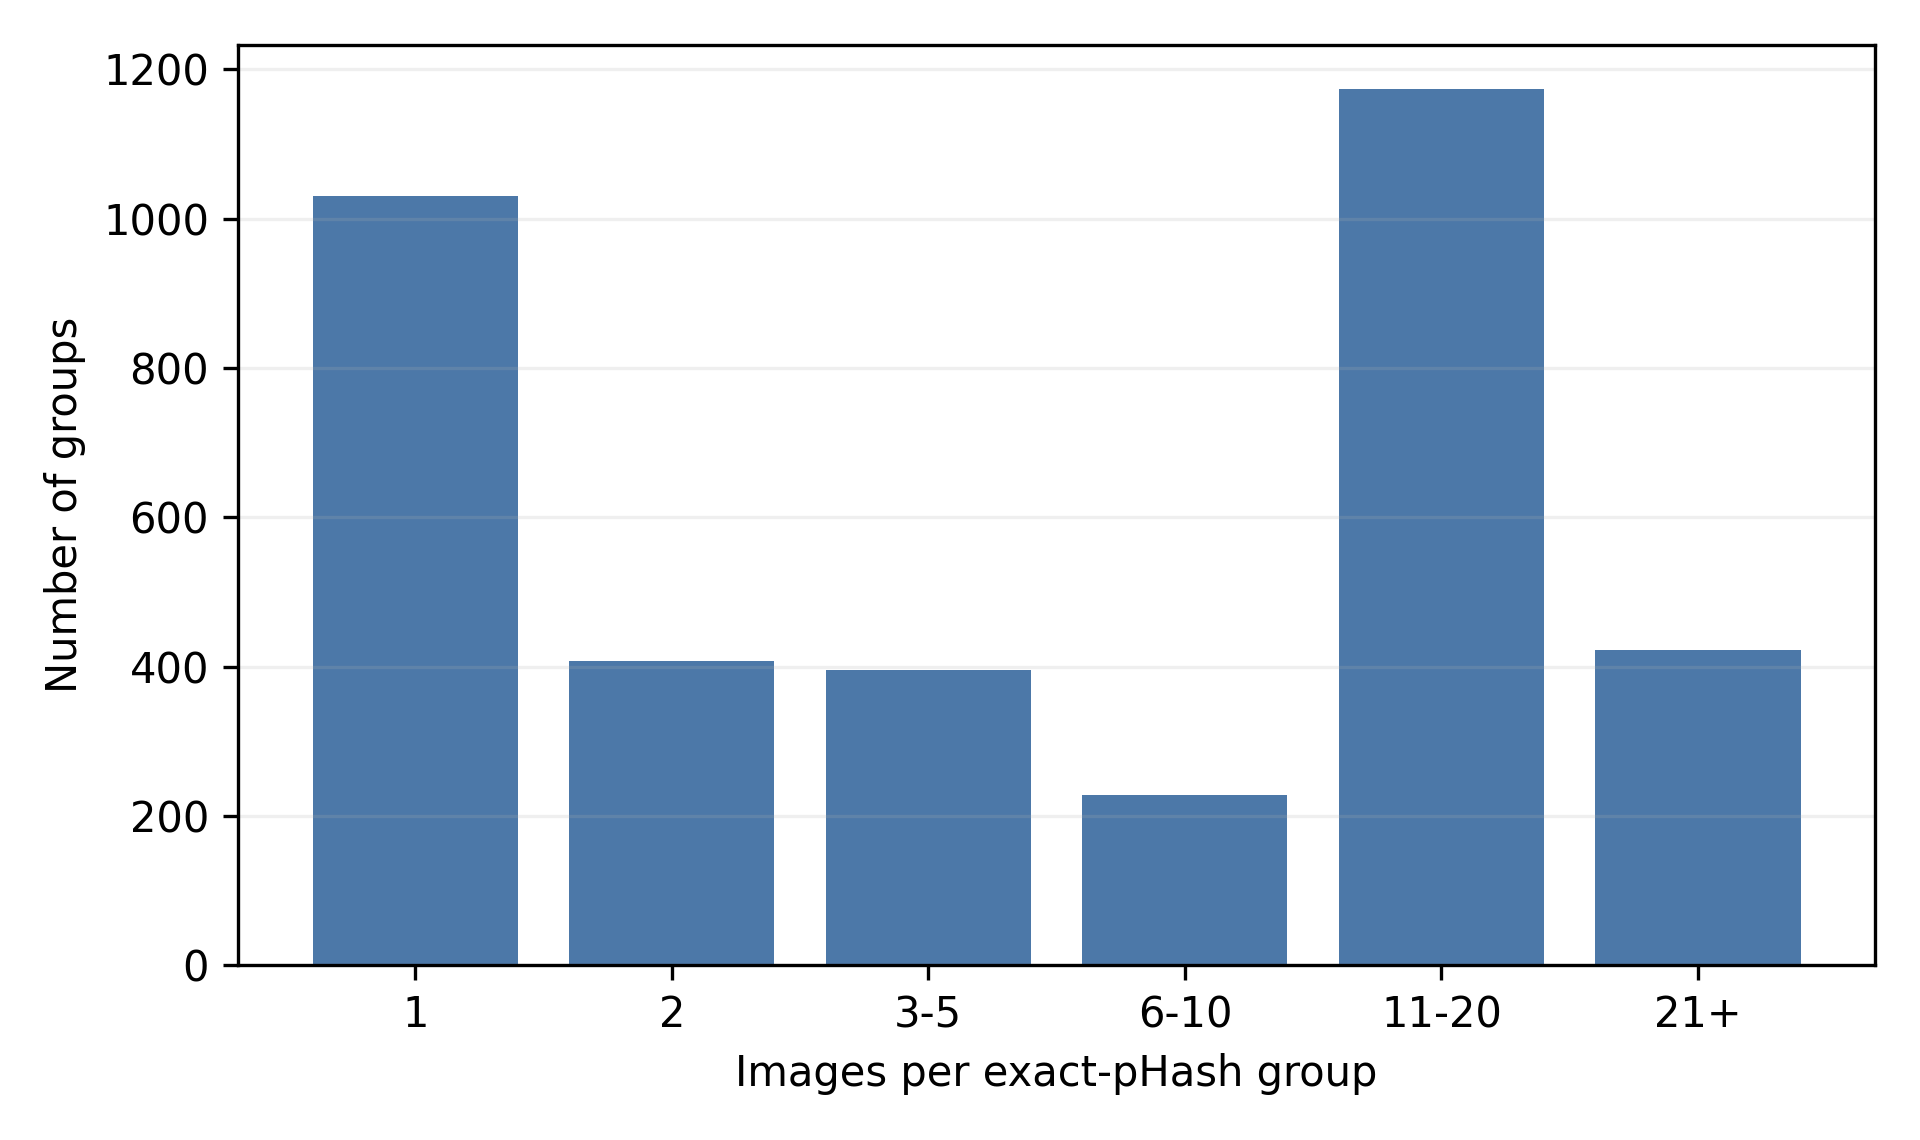
No two released pixel rows were byte-identical. However, exact same-letter pHashes formed 3,656 groups across 34,627 images. Of these, 1,030 groups were singletons. The remaining 33,597 images, or 97.03%, belonged to groups with more than one image. The median group contained five images, and the largest contained 61. Eleven groups included images from both the official training and test files. By letter, the multi-image fraction ranged from 95.01% for Q to 98.01% for C. Across seven inferred users, it ranged from 95.97% to 98.06%. The per-user values carry uncertainty because the users were reconstructed from image similarity. Supporting Information gives the full counts by letter and inferred user. Figure 1 shows the group-size distribution. Group membership is an observed hash relationship, not proof that images came from the same photograph.
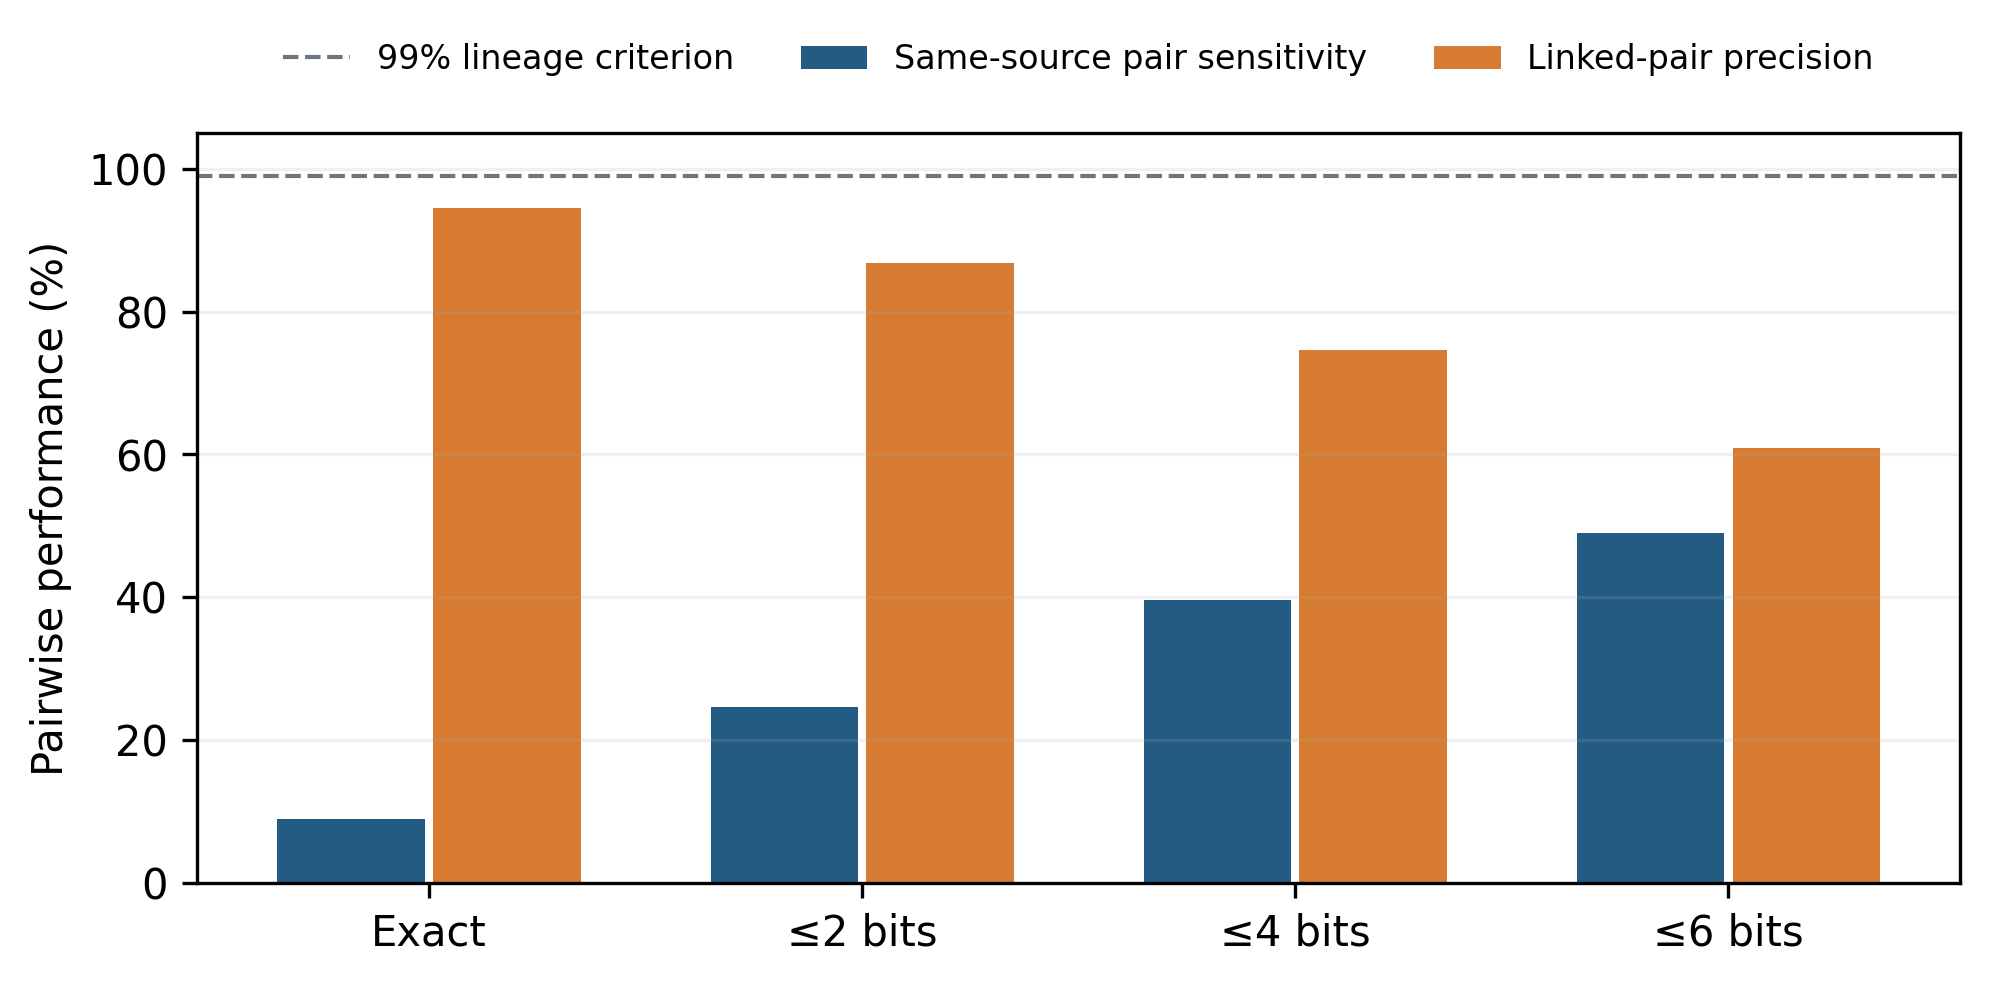
The known-source calibration changed how these groups should be interpreted. It included 25,200 same-source pairs and 2,086,560 different-source pairs within letters. The exact-hash rule linked 2,257 true pairs but missed 22,943. It also linked 133 pairs from different source photographs. All 133 pairs showed the same user and letter. The images looked very similar, but their source files were different. Exact-hash sensitivity was 8.96%, precision was 94.44%, and specificity was 99.994% (Table 2; Figure 2). Every one of the 1,680 true sources was split across at least two exact-hash groups. Raising the Hamming threshold to six bits increased sensitivity to 48.96%. However, precision fell to 60.94%, and 424 groups contained more than one source. None of the four rules met the 99% precision requirement. The zero-bit rule was still the most conservative descriptive threshold, but no tested rule could verify source lineage.
| Rule | Sensitivity | Specificity | Precision | False-merger groups | Split sources |
|---|---|---|---|---|---|
| Exact hash | 8.96% | 99.994% | 94.44% | 29 / 8,249 (0.35%) | 1,680 / 1,680 (100%) |
| ≤2 bits | 24.68% | 99.954% | 86.74% | 153 / 6,029 (2.54%) | 1,678 / 1,680 (99.88%) |
| ≤4 bits | 39.57% | 99.837% | 74.59% | 306 / 4,415 (6.93%) | 1,667 / 1,680 (99.23%) |
| ≤6 bits | 48.96% | 99.621% | 60.94% | 424 / 3,449 (12.29%) | 1,634 / 1,680 (97.26%) |
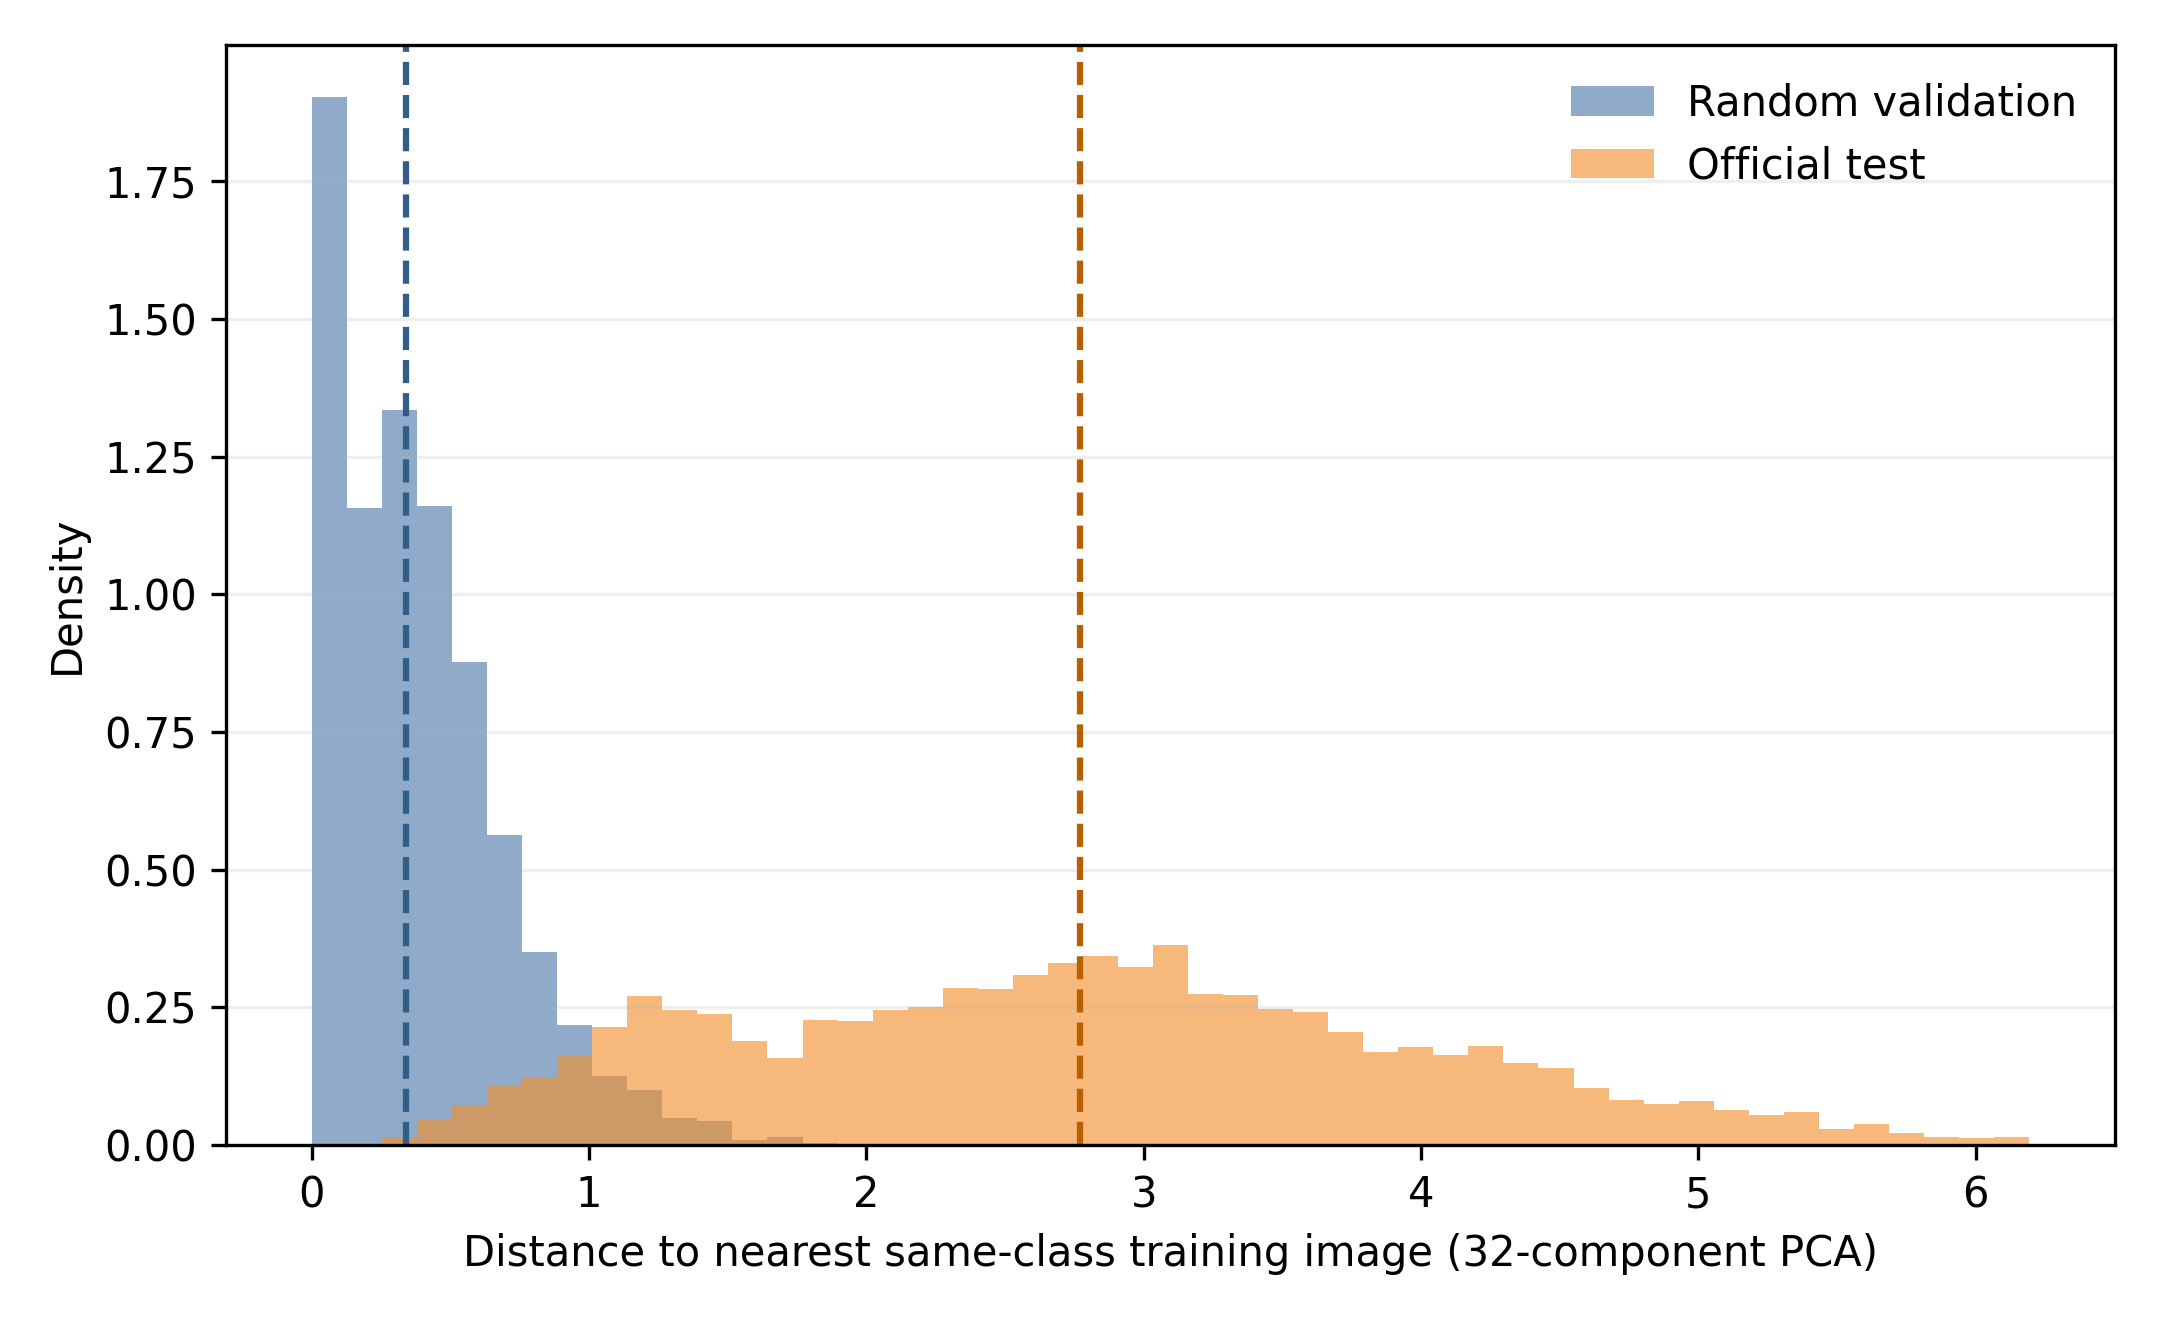
The official test images were less similar to the training images than the random validation images were. In a 32-component PCA space fitted only on training data, the median distance to the nearest same-letter training image was 0.338 for random validation. It was 2.769 for the official test, or 8.19 times larger. This result shows a shift in image similarity, not a source-independent test. Full-pixel distances on 1,000 prespecified images per partition showed the same pattern (Supporting Information). Figure 3 shows the full distance distributions.
Controlled source-disjoint classification
In the known-source collection, the random test partition shared 1,228 source photographs with the training partition. The five source-disjoint folds had no source overlap, as confirmed by the code. Table 3 compares the resulting macro F1 values. This is the only analysis in the paper with verified separation by source photograph. The scores do not measure source-disjoint performance on the released Sign Language MNIST CSVs because the source of each CSV row is unknown.
| Model | Image-random holdout | Source-disjoint folds | Difference |
|---|---|---|---|
| 1-nearest-neighbor pixels | 90.08% | 80.48 ± 0.99% | 9.60 points |
| Raw-pixel SVM | 71.47% | 49.36 ± 1.75% | 22.11 points |
| HOG-SVM | 95.03% | 90.36 ± 1.14% | 4.66 points |
| Standard CNN ensemble | 81.15% | 79.92 ± 1.48% | 1.23 points |
Benchmark and external model performance
On the released CSVs, ordinary random validation was nearly perfect even for one-nearest-neighbor classification (Table 4). Exact-pHash separation lowered its selected-fold macro F1 to 83.10%, while its official-test score was 79.97%. The calibration found both false links and missed same-source pairs. The exact-hash column is therefore a similarity-group stress test, not a clean source-independent estimate. Without augmentation, the CNN reached 100% macro F1 on random validation but 91.77 ± 1.83% on the official test. With training-only augmentation, it reached 99.27 ± 0.24% on random validation and 97.85 ± 0.88% on the official test. The near-perfect random score would not have identified the condition that performed better on the official test.
| Model | Random validation | Exact-hash validation | Official test |
|---|---|---|---|
| 1-nearest-neighbor pixels | 99.96% | 83.10% | 79.97% |
| Raw-pixel SVM | 100.00% | 87.78% | 78.41% |
| HOG-SVM | 100.00% | 95.11% | 93.65% |
| Standard CNN, no augmentation | 100.00% | 91.90 ± 1.25% | 91.77 ± 1.83% |
| Standard CNN, training augmentation | 99.27 ± 0.24% | 96.93 ± 1.85% | 97.85 ± 0.88% |
The nested fivefold exact-hash analysis kept outer evaluation folds separate from inner model selection. Pooled macro F1 was 79.77% for raw-pixel SVM, 97.17% for HOG-SVM, 98.06% for the standard-CNN ensemble, and 98.68% for the residual ensemble. The standard CNN was only 0.89 percentage points above HOG-SVM. Its paired group-bootstrap 95% interval ranged from -0.003 to 1.86 points. The residual ensemble was 0.62 points above the standard ensemble, with an interval from -0.12 to 1.35 points. These results do not show a reliable advantage for either CNN architecture. They are also not source-independent estimates.
Individual residual CNN fits were especially unstable. In outer fold 3, seed 37 produced 24.32% macro F1 and predicted only 14 of 24 classes. Recall was zero for ten letters. By contrast, seed 25 reached 99.30% macro F1 on the same fold. Seed 37 reached at least 89.25% in every other fold. Therefore, neither the fold nor the seed alone explained the failure. The additional rerun reproduced the failure. At the selected epoch 11, training accuracy in batch mode was 99.80%. In inference mode, macro F1 was only 25.70% on the outer-training images and 24.32% on the outer test fold. By epoch 20, inference-mode macro F1 reached 99.92% on outer training and 100% on the outer test fold. We then made one no-gradient pass over the training data after the 11-epoch refit. This pass changed BatchNormalization moving statistics but left every trainable weight unchanged. Macro F1 increased to 94.30% on outer training and 94.20% on the outer test fold. The extreme result therefore came from a fold-by-seed interaction. The normalization statistics were not ready when an epoch count chosen with seed 25 was applied to seed 37. These updated values explain the mechanism; they do not replace the original performance estimate. The residual official-test ensemble still classified all 7,172 official images correctly. This isolated 100% score cannot establish stability or transfer to other data.
The reconstructed-user analysis must be interpreted cautiously. Across seven inferred-user holdouts, average macro F1 was 66.14% for HOG-SVM, 66.93% for the standard CNN, and 72.95% for the residual CNN. Source-matching errors were common, especially after translation. These folds therefore cannot be called verified tests on unseen signers. At a user-margin threshold of 12.10, controlled-source recovery was 96.10% at 50% coverage. However, 80.92% of released images exceeded the same numerical threshold. This difference in coverage shows why the controlled calibration cannot guarantee correct source matches for released rows.
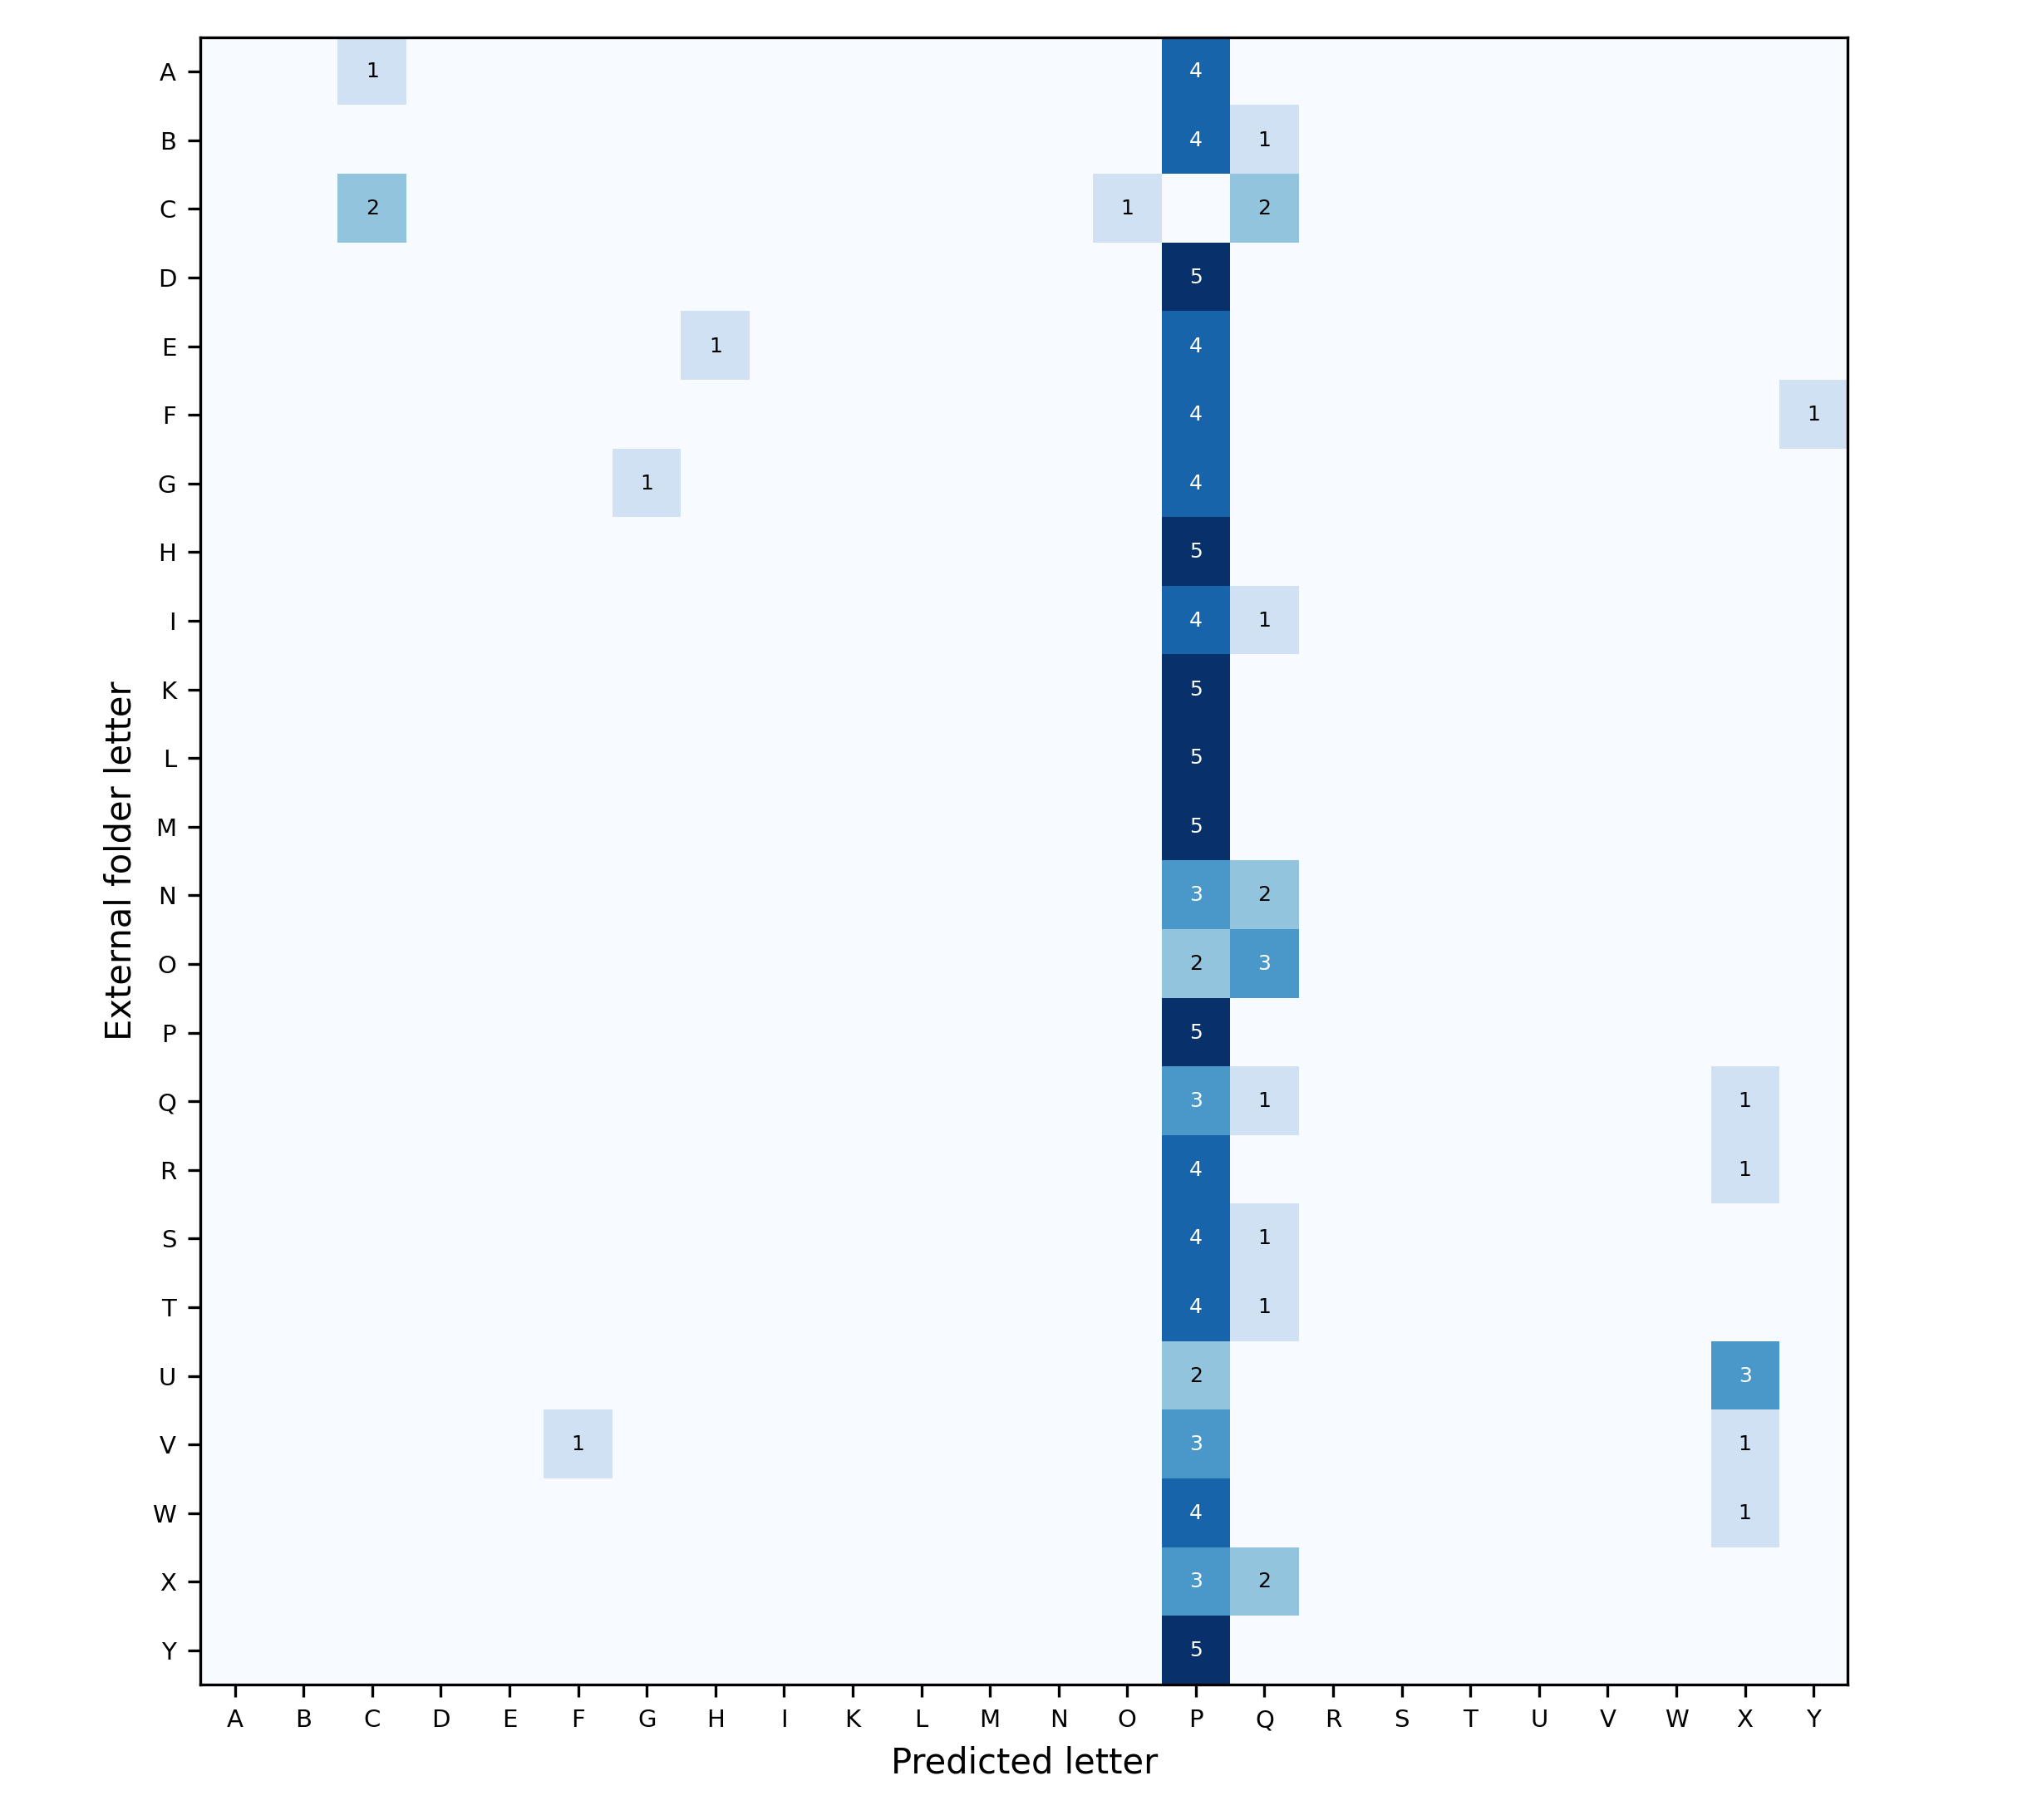
All three zero-shot external preprocessing methods produced near-chance subject-letter accuracy (Table 5). With depth-guided crops, the label-checked standard CNN recognized 9 of 120 units, or 7.50%. The Wilson 95% interval was 4.00-13.64%, and chance for 24 balanced letters is 4.17%. Its 24 × 24 confusion matrix showed correct votes only for C (two units), G (one), P (five), and Q (one). Figure 5 and the full numeric matrix allow readers to check for a possible label-index shift. The programmatic label check passed, so the low score was not caused by the suspected one-position encoding shift. The HOG-SVM control trained within the external dataset averaged 53.33 ± 13.63% across five leave-one-subject-out folds. This control shows that the external pipeline contains learnable information. The remaining gap may reflect differences in signer, camera, framing, orientation, background, or class conventions.
| Model | Full frame | Center crop | Depth-guided crop |
|---|---|---|---|
| Standard CNN ensemble | 7.50% | 5.00% | 7.50% |
| Residual CNN ensemble | 3.33% | 5.00% | 4.17% |
| HOG-SVM | 5.83% | 7.50% | 5.00% |
Discussion
This study asked how evaluation design changes what can be concluded from static ASL letter scores. The released data showed strong image dependence. However, the new calibration rejects a stronger claim from the submitted version: identical pHash groups are not verified source groups. On images with known sources, the exact rule linked different photographs from the same user and missed most true derivatives. A looser bit threshold found more true pairs but also produced more false mergers. The 97.03% multi-image statistic therefore describes a strong similarity pattern. It does not measure the percentage of images derived from a shared source photograph. The exact-hash model results remain useful as stress tests if they are described accurately.
The controlled collection gives a separate answer about source independence. All four diagnostic models supported the directional hypothesis: macro F1 was lower with source-disjoint testing than with image-random testing. The decrease was 9.60 percentage points for one-nearest-neighbor, 22.11 for raw-pixel SVM, 4.66 for HOG-SVM, and 1.23 for the standard-CNN ensemble. The smaller CNN decrease shows that data dependence does not affect every representation equally. One model architecture cannot define the size of the problem for the whole dataset. These are descriptive comparisons against one random split. Also, the synthetic derivatives may differ from the creator’s unknown process. The PCA distance shift and lower classifier scores on the released CSVs add evidence of dependence. Neither analysis can replace the missing source IDs. The safest conclusion is that random validation, exact-hash separation, official-file testing, and external testing answer different questions. None is a perfect estimate of real-world performance.
The verified 24-class mapping rules out one possible cause of the poor external result. It does not prove that the two datasets show every sign in visually equivalent ways. Correct external votes were concentrated in only a few letters. At the same time, the control model trained within the external dataset performed much better. These findings suggest that differences in image collection and representation need study before any model is considered for use outside the benchmark. This conclusion agrees with findings from multiview and signer-diverse sign datasets and with research on distribution shifts in other visual fields7,14,26. The residual network also shows that an ensemble and a strong official-test score can hide an unstable individual fit. Additional tests traced the fold-3, seed-37 failure to incomplete normalization statistics at the transferred epoch count. This is a warning about the training process. It does not show that residual networks are generally worse.
Implications
Future versions of the dataset should include a non-identifying source-photo ID for each derivative. They should also include a signer ID when consent permits and document the transformation process. Researchers should assign validation and test partitions before augmenting the source images. If these records are unavailable, authors should call pHash groups similarity groups. They should report measured sensitivity and precision instead of assuming that each group has one source. A useful follow-up study would compare several image representations with verified source and signer splits. It should also repeat random seeds and examine errors for each letter. For CNNs that use batch normalization, each seed should have its own training-only checkpoint rule. A prespecified update of normalization statistics is another option. One seed should not simply inherit the epoch count chosen for another seed. External studies should define image framing, hand orientation, class conventions, and the unit of analysis before testing begins. They should then report performance across signers and recording conditions. Any accessibility use case should be developed with Deaf and signing communities.
Limitations
The controlled calibration applies only to the transformations we tested. Its five synthetic changes resemble some documented changes, but they do not reproduce every undocumented step used to create the released CSVs. The source archive contains 1,680 photographs, while the dataset page describes approximately 1,704. This difference and the missing row-to-source map prevent a true source-disjoint test of the released benchmark. Some separate photographs show almost identical poses by the same user. Therefore, neither an equal hash nor visual inspection alone proves that two images share a source. The 99% precision requirement was a cautious rule for making source-lineage claims, not a universal threshold. The known-source random comparison used only one split. Its five source-disjoint folds also share some training observations. The displayed differences are therefore descriptive, not a formal significance test.
The nearest-source method forced every released image to match one source. Its user margin was always nonnegative because of how it was defined. Correct top-one recovery was imperfect in the controlled data and especially poor after translation. A high margin therefore cannot prove an identity when the transformation process is unknown. Results based on inferred users are sensitivity analyses only. The external dataset had five subjects and 120 combined subject-letter units. Its fixed crops were not adjusted to individual images. In addition, a consistent folder-to-index map does not prove that both datasets use identical versions of every sign or explain the shift between them. The control model trained on part of the external dataset, so its score cannot be compared directly with zero-shot transfer. The residual architecture used only three seeds per grouped fold. The normalization analysis was performed after the failure was seen and reused the same outer fold. It cannot show how often this failure would happen in new training runs.
Finally, Sign Language MNIST consists of isolated 28 × 28 grayscale images, excludes motion-based J and Z, and has undocumented demographic, skin-tone, handedness, and background diversity. No continuous-signing, live-camera, latency, usability, or deployment experiment was conducted. The study cannot establish real-world ASL translation, equitable performance, or readiness for assistive use.
Closing thought
The relevant question is not how close a benchmark score is to 100%. It is which new source, signer, or recording that score actually represents.
Supplementary Information
References
- National Institute on Deafness and Other Communication Disorders. American Sign Language. https://www.nidcd.nih.gov/health/american-sign-language, 2021. [↩]
- M. Georg, G. Tanzer, E. Uboweja, S. Hassan, M. Shengelia, S. Sepah, S. Forbes, T. Starner. FSboard: Over 3 million characters of ASL fingerspelling collected via smartphones. Proceedings of the IEEE/CVF Conference on Computer Vision and Pattern Recognition. pg. 13897-13906, 2025, https://openaccess.thecvf.com/content/CVPR2025/html/Georg_FSboard_Over_3_Million_Characters_of_ASL_Fingerspelling_Collected_via_CVPR_2025_paper.html. [↩]
- A. Duarte, S. Palaskar, L. Ventura, D. Ghadiyaram, K. DeHaan, F. Metze, J. Torres, X. Giró-i-Nieto. How2Sign: A large-scale multimodal dataset for continuous American Sign Language. Proceedings of the IEEE/CVF Conference on Computer Vision and Pattern Recognition. pg. 2735-2744, 2021, https://openaccess.thecvf.com/content/CVPR2021/html/Duarte_How2Sign_A_Large-Scale_Multimodal_Dataset_for_Continuous_American_Sign_Language_CVPR_2021_paper.html. [↩]
- G. Tanzer. Fingerspelling within sign language translation. Proceedings of the 2025 Conference of the Nations of the Americas Chapter of the Association for Computational Linguistics. pg. 385-464, 2025, https://doi.org/10.18653/v1/2025.naacl-long.19. [↩]
- W. Tao, M. C. Leu, Z. Yin. American Sign Language alphabet recognition using convolutional neural networks with multiview augmentation and inference fusion. Engineering Applications of Artificial Intelligence. Vol. 76, pg. 202-213, 2018, https://doi.org/10.1016/j.engappai.2018.09.006. [↩]
- J. Shin, A. Matsuoka, M. A. M. Hasan, A. Y. Srizon. American Sign Language alphabet recognition by extracting feature from hand pose estimation. Sensors. Vol. 21, pg. 5856, 2021, https://doi.org/10.3390/s21175856. [↩]
- A. Desai, L. Berger, F. Minakov, N. Milano, C. Singh, K. Pumphrey, R. E. Ladner, H. Daumé III, A. X. Lu, N. Caselli, D. Bragg. ASL Citizen: A community-sourced dataset for advancing isolated sign language recognition. Advances in Neural Information Processing Systems. Vol. 36, pg. 76893-76907, 2023, https://papers.nips.cc/paper_files/paper/2023/hash/f29cf8f8b4996a4a453ef366cf496354-Abstract-Datasets_and_Benchmarks.html. [↩] [↩]
- O. M. Sincan, J. C. S. Jacques Junior, S. Escalera, H. Y. Keles. ChaLearn LAP large scale signer independent isolated sign language recognition challenge: Design, results and future research. Proceedings of the IEEE/CVF Conference on Computer Vision and Pattern Recognition Workshops. pg. 3472-3481, 2021, https://openaccess.thecvf.com/content/CVPR2021W/ChaLearn/html/Sincan_ChaLearn_LAP_Large_Scale_Signer_Independent_Isolated_Sign_Language_Recognition_CVPRW_2021_paper.html. [↩]
- R. Holmes, E. Rushe, F. Fowley, A. Ventresque. Improving signer independent sign language recognition for low resource languages. Proceedings of the 7th International Workshop on Sign Language Translation and Avatar Technology. pg. 45-52, 2022, https://aclanthology.org/2022.sltat-1.7/. [↩]
- K. Artiaga, S. Kamila, H. Afli, C. Lynch, M. Hasanuzzaman. Rethinking sign language translation: The impact of signer dependence on model evaluation. Findings of the Association for Computational Linguistics: EMNLP 2025. pg. 18379-18391, 2025, https://doi.org/10.18653/v1/2025.findings-emnlp.997. [↩]
- H. Fu, L. Zhang, B. Fu, R. Zhao, J. Su, X. Shi, Y. Chen. Signer diversity-driven data augmentation for signer-independent sign language translation. Findings of the Association for Computational Linguistics: NAACL 2024. pg. 2182-2193, 2024, https://doi.org/10.18653/v1/2024.findings-naacl.140. [↩]
- M. Mukushev, A. Kydyrbekova, A. Imashev, V. Kimmelman, A. Sandygulova. Crowdsourcing Kazakh-Russian Sign Language: FluentSigners-50. Proceedings of the 13th Language Resources and Evaluation Conference. pg. 2541-2547, 2022, https://aclanthology.org/2022.lrec-1.271/. [↩]
- K. Papadimitriou, G. Potamianos, G. Sapountzaki, T. Goulas, E. Efthimiou, S.-E. Fotinea, P. Maragos. Greek Sign Language recognition for the SL-ReDu learning platform. Proceedings of the 7th International Workshop on Sign Language Translation and Avatar Technology. pg. 79-84, 2022, https://aclanthology.org/2022.sltat-1.12/. [↩]
- N. S. Dinh, T. D. Nguyen, D. T. Tran, N. D. H. Pham, T. H. Tran, N. A. Tong, Q. H. Hoang, P. Le Nguyen. Sign language recognition: A large-scale multi-view dataset and comprehensive evaluation. Proceedings of the Winter Conference on Applications of Computer Vision. pg. 7876-7886, 2025, https://openaccess.thecvf.com/content/WACV2025/html/Dinh_Sign_Language_Recognition_A_Large-Scale_Multi-View_Dataset_and_Comprehensive_Evaluation_WACV_2025_paper.html. [↩] [↩]
- K. Yin, C. Singh, F. O. Minakov, V. Milan, H. Daumé III, C. Zhang, A. X. Lu, D. Bragg. ASL STEM Wiki: Dataset and benchmark for interpreting STEM articles. Proceedings of the 2024 Conference on Empirical Methods in Natural Language Processing. pg. 14474-14490, 2024, https://doi.org/10.18653/v1/2024.emnlp-main.801. [↩]
- K. Atwell, D. Bragg, M. Alikhani. Studying and mitigating biases in sign language understanding models. Proceedings of the 2024 Conference on Empirical Methods in Natural Language Processing. pg. 268-283, 2024, https://doi.org/10.18653/v1/2024.emnlp-main.17. [↩]
- F. Gröger, S. Lionetti, P. Gottfrois, A. Gonzalez-Jimenez, L. Amruthalingam, Labelling Consortium, M. Groh, A. Navarini, M. Pouly. Intrinsic self-supervision for data quality audits. Advances in Neural Information Processing Systems. Vol. 37, pg. 92273-92316, 2024, https://doi.org/10.52202/079017-2930. [↩]
- F. Gröger, S. Lionetti, P. Gottfrois, A. Gonzalez-Jimenez, M. Groh, R. Daneshjou, Labelling Consortium, A. A. Navarini, M. Pouly. Towards reliable dermatology evaluation benchmarks. Proceedings of Machine Learning Research. Vol. 225, pg. 101-128, 2023, https://proceedings.mlr.press/v225/groger23a.html. [↩]
- Z. Papakipos, G. Tolias, T. Jenicek, E. Pizzi, S. Yokoo, W. Wang, Y. Sun, W. Zhang, Y. Yang, S. Addicam, S. M. Papadakis, C. Canton Ferrer, O. Chum, M. Douze. Results and findings of the 2021 Image Similarity Challenge. Proceedings of Machine Learning Research. Vol. 176, pg. 1-12, 2022, https://proceedings.mlr.press/v176/papakipos22a.html. [↩]
- M. F. Mahmud, Z. Nusrat, W. D. Pan. Comparative evaluation of perceptual hashing and deep embedding methods for robust and efficient image deduplication. Electronics. Vol. 15, pg. 1493, 2026, https://doi.org/10.3390/electronics15071493. [↩]
- Y. K. Adimoolam, C. Poullis, M. Averkiou. Data leakage detection and de-duplication in large scale geospatial image datasets. Proceedings of the IEEE/CVF Conference on Computer Vision and Pattern Recognition. pg. 72-81, 2026, https://openaccess.thecvf.com/content/CVPR2026/html/Adimoolam_Data_Leakage_Detection_and_De-duplication_in_Large_Scale_Geospatial_Image_CVPR_2026_paper.html. [↩]
- C. G. Northcutt, A. Athalye, J. Mueller. Pervasive label errors in test sets destabilize machine learning benchmarks. Proceedings of the Neural Information Processing Systems Track on Datasets and Benchmarks. Vol. 1, 2021, https://datasets-benchmarks-proceedings.neurips.cc/paper/2021/hash/f2217062e9a397a1dca429e7d70bc6ca-Abstract-round1.html. [↩]
- J. M. C. da Silva, P. M. B. Rezende, M. A. Ponti. Detecting and mitigating issues in image-based COVID-19 diagnosis. Proceedings of Machine Learning Research. Vol. 184, pg. 127-135, 2022, https://proceedings.mlr.press/v184/silva22a.html. [↩]
- I. E. Tampu, A. Eklund, N. Haj-Hosseini. Inflation of test accuracy due to data leakage in deep learning-based classification of OCT images. Scientific Data. Vol. 9, pg. 580, 2022, https://doi.org/10.1038/s41597-022-01618-6. [↩]
- E. Yagis, S. W. Atnafu, A. García Seco de Herrera, C. Marzi, R. Scheda, M. Giannelli, C. Tessa, L. Citi, S. Diciotti. Effect of data leakage in brain MRI classification using 2D convolutional neural networks. Scientific Reports. Vol. 11, pg. 22544, 2021, https://doi.org/10.1038/s41598-021-01681-w. [↩]
- P. W. Koh, S. Sagawa, H. Marklund, S. M. Xie, M. Zhang, A. Balsubramani, W. Hu, M. Yasunaga, R. L. Phillips, I. Gao, T. Lee, E. David, I. Stavness, W. Guo, B. Earnshaw, I. Haque, S. M. Beery, J. Leskovec, A. Kundaje, E. Pierson, S. Levine, C. Finn, P. Liang. WILDS: A benchmark of in-the-wild distribution shifts. Proceedings of Machine Learning Research. Vol. 139, pg. 5637-5664, 2021, https://proceedings.mlr.press/v139/koh21a.html. [↩] [↩]
- J. Yang, R. Shi, D. Wei, Z. Liu, L. Zhao, B. Ke, H. Pfister, B. Ni. MedMNIST v2: A large-scale lightweight benchmark for 2D and 3D biomedical image classification. Scientific Data. Vol. 10, pg. 41, 2023, https://doi.org/10.1038/s41597-022-01721-8. [↩]
- T. Gebru, J. Morgenstern, B. Vecchione, J. W. Vaughan, H. Wallach, H. Daumé III, K. Crawford. Datasheets for datasets. Communications of the ACM. Vol. 64, pg. 86-92, 2021, https://doi.org/10.1145/3458723. [↩]
- Tecperson. Sign Language MNIST. https://www.kaggle.com/datasets/datamunge/sign-language-mnist, 2017. [↩] [↩]
- Mon95. Sign Language and static-gesture recognition using scikit-learn. https://github.com/mon95/Sign-Language-and-Static-gesture-recognition-using-sklearn, 2016. [↩]
- Z. Tang, F. Yang, L. Huang, X. Zhang. Robust image hashing with dominant DCT coefficients. Optik. Vol. 125, pg. 5102-5107, 2014, https://doi.org/10.1016/j.ijleo.2014.05.015. [↩]
- C. Cortes, V. Vapnik. Support-vector networks. Machine Learning. Vol. 20, pg. 273-297, 1995, https://doi.org/10.1007/BF00994018. [↩]
- N. Dalal, B. Triggs. Histograms of oriented gradients for human detection. Proceedings of the IEEE Computer Society Conference on Computer Vision and Pattern Recognition. Vol. 1, pg. 886-893, 2005, https://doi.org/10.1109/CVPR.2005.177. [↩]
- Y. LeCun, L. Bottou, Y. Bengio, P. Haffner. Gradient-based learning applied to document recognition. Proceedings of the IEEE. Vol. 86, pg. 2278-2324, 1998, https://doi.org/10.1109/5.726791. [↩]
- K. He, X. Zhang, S. Ren, J. Sun. Deep residual learning for image recognition. Proceedings of the IEEE Conference on Computer Vision and Pattern Recognition. pg. 770-778, 2016, https://doi.org/10.1109/CVPR.2016.90. [↩]
- N. Pugeault, R. Bowden. Spelling it out: Real-time ASL fingerspelling recognition. Proceedings of the IEEE International Conference on Computer Vision Workshops. pg. 1114-1119, 2011, https://doi.org/10.1109/ICCVW.2011.6130290. [↩]
- N. Pugeault. ASL Finger Spelling Dataset. https://empslocal.ex.ac.uk/people/staff/np331/index.php?section=FingerSpellingDataset, 2011. [↩]