Abstract
VR enclosures like the Google Cardboard viewer, pair magnifying lenses with a smartphone display. When users leave the lenses facing the sun accidentally, the sunlight is focused into a hotspot on the display and causes damage. No directly comparable peer-reviewed study was identified in the literature reviewed that characterizes the layer-by-layer thermal failure sequence of a commercial smartphone LCD under the concentrated solar radiation. This study tries to fill the gap with an experimental study. First, we quantified the geometric solar concentration ratio at solar noon using a Google Cardboard V2 enclosure (37 mm PMMA lenses) – mapped a 1.8 ± 0.2 mm focal spot diameter, calculated a corresponding estimated peak focal irradiance of ~423,000 W/m², ~423 suns. Second, we confirmed the front polyvinyl alcohol (PVA) polarizer failed first by gradually deconstructing the damaged display; we further identified four distinct failure zones: normal, slight burn (permanent color shift, partial PVA depolarization), medium burn (always-on bright appearance, total polarizer function loss), and severe burn (dark brownish-red appearance, spectrally selective attenuation, measured backside surface temperature ~186°C). Under the 37 mm aperture lens configuration, the color filter array was structurally intact and no visible damage observed on any of the backlight unit sub-components under microscope. Third, thermal contact experiments with an iron tip confirmed permanent polarization function loss beginning at 85°C (lowest temperature tested). These findings establish the layer-by-layer failure cascade of a LCD under concentrated solar radiation, also highlight a critical consumer safety hazard in VR hardware.
Keywords: LCD, VR optics, concentrated solar irradiance, thermal failure analysis, polyiodide degradation, layer-resolved thermal failure cascade, LWIR thermography
Introduction
Liquid crystal displays (LCDs) are complex, multilayer optical and mechanical systems. Each layer has a unique thermal degradation threshold due to difference in material properties and manufacturing process. A standard mobile LCD consists of several key parts: cover glass, a front linear polarizer, color filter (CF) array glass, the liquid crystal (LC) layer, a thin-film transistor (TFT) array glass, a rear polarizer, and a backlight unit (BLU). Backlight produced by BLU illuminates the CF array; the LC layer, together with the front and rear polarizers, act as an optical light switch, with the driving electrical signals provided by the TFT array to turn pixels ON or OFF, controlling whether light from the BLU can pass through1,2,3.
Polarizers are critical components for controlling the backlight transmission. They are typically fabricated using a polyvinyl alcohol (PVA) film that is stretched to align its polymer chains. For mainstream mobile displays, manufacturers use iodine-type PVA polarizers – created by stretching a dyed PVA film to align linear polyiodide ions I3⁻ and I₅⁻ trapped inside the oriented polymer matrix4,5. This creates an anisotropic structure that absorbs light oscillating parallel to the chains while transmitting light perpendicular to them. PVA film is laminated between triacetate cellulose (TAC) protective sheets. When ambient light is incident on a typical in-plane switching (IPS) LCD, it passes sequentially through the front polarizer, the CF array, the LC layer, TFT array, the rear polarizer, and finally BLU. Iodine-type PVA polarizers absorb more than 50% of incident unpolarized light; conventional color LCD panels transmit only 5–14% of broadband incident light in the white state, with up to 86–95% of incident optical energy converted to heat6,7. However, the PVA polarizer is highly sensitive to thermal stress. At temperatures above approximately 90°C, iodine sublimates out of the PVA matrix – this disrupts the polyiodide complexes, causing permanent loss of polarizing efficiency8 and leading to backlight leakage when the display tries to show a dark OFF-state. As temperatures go higher, further thermal degradation of the PVA-iodine system produces wavelength-selective optical attenuation8,9. In contrast, the organic CF resists are much more durable, formulated as pigment-based photoresist materials10 that survive post-bake manufacturing cure cycles of 220°C to 230°C11. In the meantime, the BLU optical films sitting beneath the rear polarizer are shielded from direct solar heat by the layers above them. Between these two thermal extremes, the pressure-sensitive adhesive (PSA) layers bonding the optical functional layers together begin to soften and outgas; PSA layers in TFT-LCD polarizer assemblies have low glass transition temperatures, e.g. −26°C to −37°C and elastic moduli of 0.04–0.25 MPa12,13. Because manufacturer material specifications are proprietary, empirical testing is necessary to determine exactly which layer fails first and under what specific environmental conditions.
Virtual reality (VR) headsets have grown rapidly in popularity for gaming, remote learning, and scientific exploration. Low-cost, entry-level devices like the Google Cardboard Viewer pair simple magnifying lenses (refractive biconvex or Fresnel) with a user’s smartphone display. By placing the screen directly on the lens’s focal plane, the system creates a virtual stereoscopic image for the wearer. However, such design introduces a severe vulnerability: if a user leaves the headset facing upward under direct sunlight, the magnifying lenses become solar concentrators. The lenses focus broadband solar radiation into an extremely intense, localized hotspot14,15 on the front surface of the smartphone display, causing irreversible damage.
Prior research on solar-induced display damage has been largely related to automotive head-up displays (HUDs). In automotive systems, solar radiation enters through the windshield, can pass into the projector optics and melt the internal display panel16,17. However, these studies mainly focused on optical mitigations – such as mechanical shutters, diffusers, or micro-mirror arrays18, rather than experimental characterization of which display functional layers fail first, at what exact temperatures performance degradation begins, or what precise physical mechanisms drive the destruction. To date, no directly comparable peer-reviewed study was identified in the literature reviewed that reported the layer-resolved thermal failure sequence of a commercial smartphone LCD under the concentrated solar radiation of a polymethyl methacrylate (PMMA) VR lens. Filling this research gap will help VR users better understand product safety risks while providing designers and manufacturers with concrete data on the weakest components in the display stack – evidence essential for developing more effective engineering designs to prevent solar damage.
Solar radiation can cause thermal degradation of material and ultraviolet (UV) induced photochemical degradation. Fortunately, PMMA lenses exhibit very high transmission in the visible and near-infrared bands but drop off sharply in the UV spectrum19. This material property provides us a convenient experimental control, allowing us to isolate purely thermal degradation pathways from UV-induced photochemical degradation in this study.
Refractive Fresnel and biconvex lenses concentrate solar irradiance through refraction, with geometric concentration ratios determined by the lens aperture area relative to the focal spot area15,20. The irradiance at the focal plane is governed by the geometric concentration ratio C = Alens / Aspot, thus can be calculated from ambient solar flux as Efocal = C × Eambient.
Based on these factors, we have a hypothesis: the focused solar irradiance from a PMMA VR lens can heat the front PVA polarizer past its permanent thermal damage threshold of ~90°C. To evaluate this hypothesis, our study focuses specifically on solar thermal degradation by addressing three main objectives: (1) Quantify the geometric solar concentration ratio and estimated peak focal irradiance produced within a consumer Google Cardboard V2 enclosure under direct sunlight. (2) Characterize the layer-by-layer thermal failure sequence of a commercial LCD stack to identify exactly which functional layer fails first and at what temperature. (3) Validate the polarizer damage threshold independently using a contact calibration experiment with a temperature-controlled soldering iron tip and a crossed-polarizer approach for polarizer functional inspection.
Several boundaries limit the scope of this study. First, this study was done with two display panels from a single smartphone model (Motorola Moto G) using one specific VR headset design (Google Cardboard V2). Therefore, our findings may not directly apply to other display designs or lens configurations. Temperatures of the polarizer layers are not measured in-situ because front-side LWIR thermometry physically blocks the incoming solar flux, rear-side LWIR thermometry cannot resolve individual layer temperatures through the opaque stack, and embedding temperature sensors would fundamentally alter the thermal conductivity under study. Failure analysis of OLED displays could be an interesting comparative study and is reserved for future research, as this work focuses strictly on LCD technology. Similarly, the long-term exposure dependence of the thermal degradation is investigated in a separate study. Finally, while all equipment and tools used in this project were selected to remain low-cost, we try to keep a practical balance between sufficient scientific accuracy and financial affordability, and demonstrate that meaningful hardware characterization can be done within a high school laboratory setting.
Methods
Research design
This research is an experimental study, it consists of three main parts: (1) focal spot thermal characterization by exposing display samples to concentrated solar radiation, using two different types of absorptive samples to establish baseline reference for comparison (2) incremental burn behavior evaluation through a careful deconstruction procedure, i.e. first with an intact smartphone, then a separated display front stack, with thermal behavior measured and optical microscopy recorded at each step of the process (3) independent thermal contact experiments that replicates solar burn damage using a temperature-controlled soldering iron tip, combined with a crossed-polarizer functional validation to verify measured temperature and polarizer failure thresholds.
Equipment and materials
In this study we use a commercial Google Cardboard VR V2 housing equipped with dual biconvex PMMA lenses (aperture: 37 mm; nominal focal length: 45 mm) as solar concentration platform. The experimental LCD targets were extracted from a first-generation Motorola Moto G smartphone (model XT1032). Two panels/two phones from the same phone model were tested independently. We measured backside radiometric temperatures using a Thermal Master P2 Pro LWIR microbolometer camera (spectral range: 8–14 μm; resolution: 512 × 284 pixels) equipped with a macro lens attachment. The target emissivity was set to ε = 0.95 per user’s manual, which aligns with published emissivity values for organic polymers and carbon-black resin surfaces in the 8–14 μm band21. Measurement accuracy of LWIR thermography systems in this spectral band is affected by surface emissivity, measurement distance, and atmospheric transmissivity21,22,23. Published emissivity values for organic polymer surfaces in this band span 0.91–0.9722,23; uncertainty in ε of ±0.03 introduces a temperature uncertainty of approximately ±3°C–5°C. The camera manufacturer’s stated accuracy is ±1.5°C, so the total combined measurement uncertainty on reported temperatures is approximately ±6°C. To avoid specular reflections from the surfaces, we positioned the camera at an off-axis angle of approximately 10°. We conducted all outdoor exposures at solar noon under a monitored ambient illuminance of 120,000 lux, which corresponds to roughly 1,000 W/m² under standard AM1.5 broadband solar spectral conditions using the conversion factor of approximately 122 lux per W/m².24,25 Optical inspection and analysis were performed using a LEERSHI Gongye 1200 digital microscope at approximately 300× magnification. For the contact calibration experiment, we used a YIHUA 982 temperature-controlled soldering station. Finally, we inspected polarization function by placing a functional reference linear polarizer in a crossed-polarizer configuration (oriented at exactly 90°) over the damaged polarizer assembly to detect light leakage and optical degradation.
Focal spot measurement
We measured the size of the focal spot by briefly exposing thermally sensitive paper, positioned at the 45 mm focal plane, to the focused sunlight under the 120,000-lux test condition. The resulting circular burn mark was then measured using a digital Vernier caliper under optical microscope. The diameter of the burn mark in both the horizontal and vertical directions were measured for each sample – we took the average of these measurements across three separate paper trials as the mean focal spot reference diameter.
Variables and measurements
We evaluated several independent and dependent variables in this experimental study. The independent variables are: the hardware target configurations in Stages 1 – 5, the tip temperature of the soldering iron, and its corresponding contact dwell time. The primary dependent variable was the peak backside temperature of the display assembly. Secondary dependent variables were: characteristics of the damage zone morphology (macro-level and micro-level), across-comparison of the failure zone patterns (intact phone and isolated stack), and the baseline focal spot diameter.
Experimental Procedure
The experiments were conducted in eight stages, as follows.
Stage 1 (White Paper Baseline): This stage establishes a thermal baseline with a high-scattering, low-absorptance reference sample. We chose a thick, opaque white paper sheet and placed it at the focal plane of the Google Cardboard VR V2 viewer lens. With a LWIR camera, the white paper’s backside surface temperature behavior was continuously recorded over a 30-second duration.
Stage 2 (Cover Glass Baseline): to establish a second thermal baseline with a partial-absorption reference sample, we chose a standalone smartphone cover glass (approximately 0.5 mm thick) with 3M blue painter’s tape adhered to its rear surface. This reference sample was placed at the lens focal plane, and the blue tape’s backside surface temperature was recorded by the LWIR camara over a 20-second exposure – we actually started with 30 seconds trials but observed smoking close to 30 s, so we shortened it to 20 s to prevent paper fire risks.
Stage 3 (Incremental Burn with Intact Phone Display): in this stage, we placed an intact, fully functional Motorola Moto G smartphone at the lens focal plane to study the solar burn behavior under different exposure. The phone was exposed in one-second increments up to 15 s, with phone’s position shifted slightly after each exposure so that the burn marks can be separated. For reference, we also recorded solar burn marks under longer exposure of 1, 2 minutes. 2 intact panels/phones were tested.
Stage 4 (Diagnostics with Monochromatic Pattern): post the incremental burn in stage 3, the smartphone was powered on for damage assessment and diagnosis. Full-screen monochromatic test patterns, i.e. white, black, red, green, and blue were applied one at a time. After taking the photos, we marked the burned spots, then performed pixel-level damage inspection with an optical microscope. Microscope photos were taken first under display power ON, microscope illumination OFF condition and then under display power OFF, microscope illumination ON only condition.
Stage 5 (Front Stack Isolation and Continuous Burn): To test our hypothesis of polarizer damage, we deconstructed the smartphone, first we separated the display assembly from the smartphone chassis, then carefully disassembled the display panel, separated the front polarizer stack by removing the BLU assembly and the TFT glass/rear polarizer stack. The marked solar burns on the front stack were inspected again, and recorded. To further study the temperature behavior of the front polarizer under concentrated solar radiation and compare with the thermal baselines established in Stage 1 and 2, the separated front stack, i.e. the cover glass, front polarizer, and CF glass, was placed at the lens focal plane, and exposed to the concentrated solar radiation (same solar noon condition as in stage 1 and 2) continuously for 20 seconds. This specific duration was selected after a few trials to balance full thermal saturation and fire risk. The backside surface temperature during the 20 second exposure was continuously recorded by the LWIR camera. 2 panels (panel A and panel B) were tested, each with n = 3 trials (total N=6). Finally, we disassembled the BLU into its individual sub-component films, and saved them for separate visual inspection.
Stage 6 (Microscopic Verification and Cross-Comparison): This stage is to cross compare the new burned spots from Stage 5 exposure with those previously burned spots on the intact smartphone devices from Stage 3 exposure (specifically from the separate 15-second and 1-minute exposure trials) that were marked in Stage 4. All samples were inspected under microscope, with photos taken under reflected microscope illumination only.
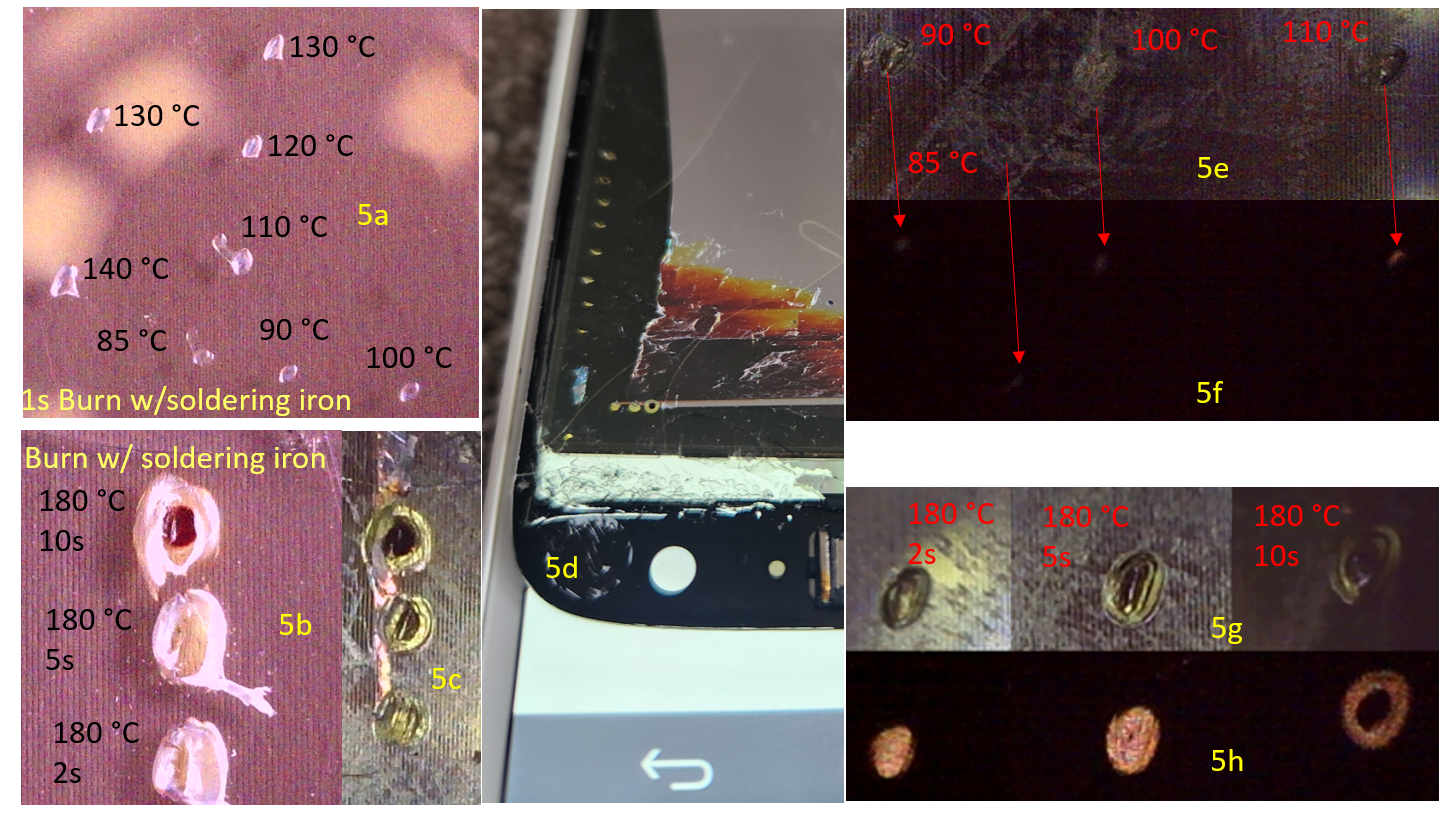
Stage 7 (Thermal Contact Experiments and Functional Validation): to independently validate the thermal damage and threshold, we designed a few separate experiments in three steps. Step 1 (Temperature Sweep): we put the bottom surface of the rear polarizer in direct contact with a temperature-controlled soldering iron tip to verify whether polarizer gets damaged at ~90°C. For example, we set the tip temperature at 85°C, put the tip in direct contact with sample surface for 1 second (dwell), then move to another location, set the tip temperature at 90°C, do a 1 second contact burn and repeat this for 100°C, 110°C, 120°C, 130°C, and 140°C. The contact marks were then inspected under the microscope. Step 2 (Dwell Time Sweep): to see if we can replicate solar burns produced from the Stage 5 continuous exposure (20 s) where the ~186°C backside temperature were measured, we set the soldering iron tip temperature at a fixed high extreme of 180°C, but varied the contact dwell times across 2, 5, and 10 seconds, then re-do the contact experiment on the same polarizer bottom surface. Step 3 (Exposed Adhesives and Crossed-Polarizer Verification): we further peeled off the APCF hard coat (partially) to expose the pressure-sensitive adhesive (PSA) so tip can contact closer to the core PVA polarizer layer (rear Polarizer and APCF/hard coat total thickness < 0.2mm). Fresh contact burns were then applied directly to the exposed PSA surface following the same procedure as in Step1 and 2. To detect localized light leakage on the rear polarizer, we adopted a crossed-polarizer configuration, where an external, functional reference front linear polarizer was oriented at exactly 90° and placed in between the rear polarizer and an illumination light source. All contact burns were inspected under the dark room condition.
Data analysis
The Thermal master P2 Pro LWIR camera took continuous thermal videos at 25 frames per second; the backside temperatures were the Max. value of the hotspot reported by the camera on each frame, we extracted the Max. value from each of the frame of the 20 second long LWIR video recordings using Python code. Concentration ratio was calculated as the ratio of lens aperture area to focal spot area assuming circular geometry. For Stage 5 temperatures, the mean and SD (∼186°C ± 4°C) are pooled across N = 6 total measurements (n = 3 per panel, two panels); Panel A and Panel B ranges are reported separately in Table 1.
Results
Focal spot characterization and solar concentration ratio
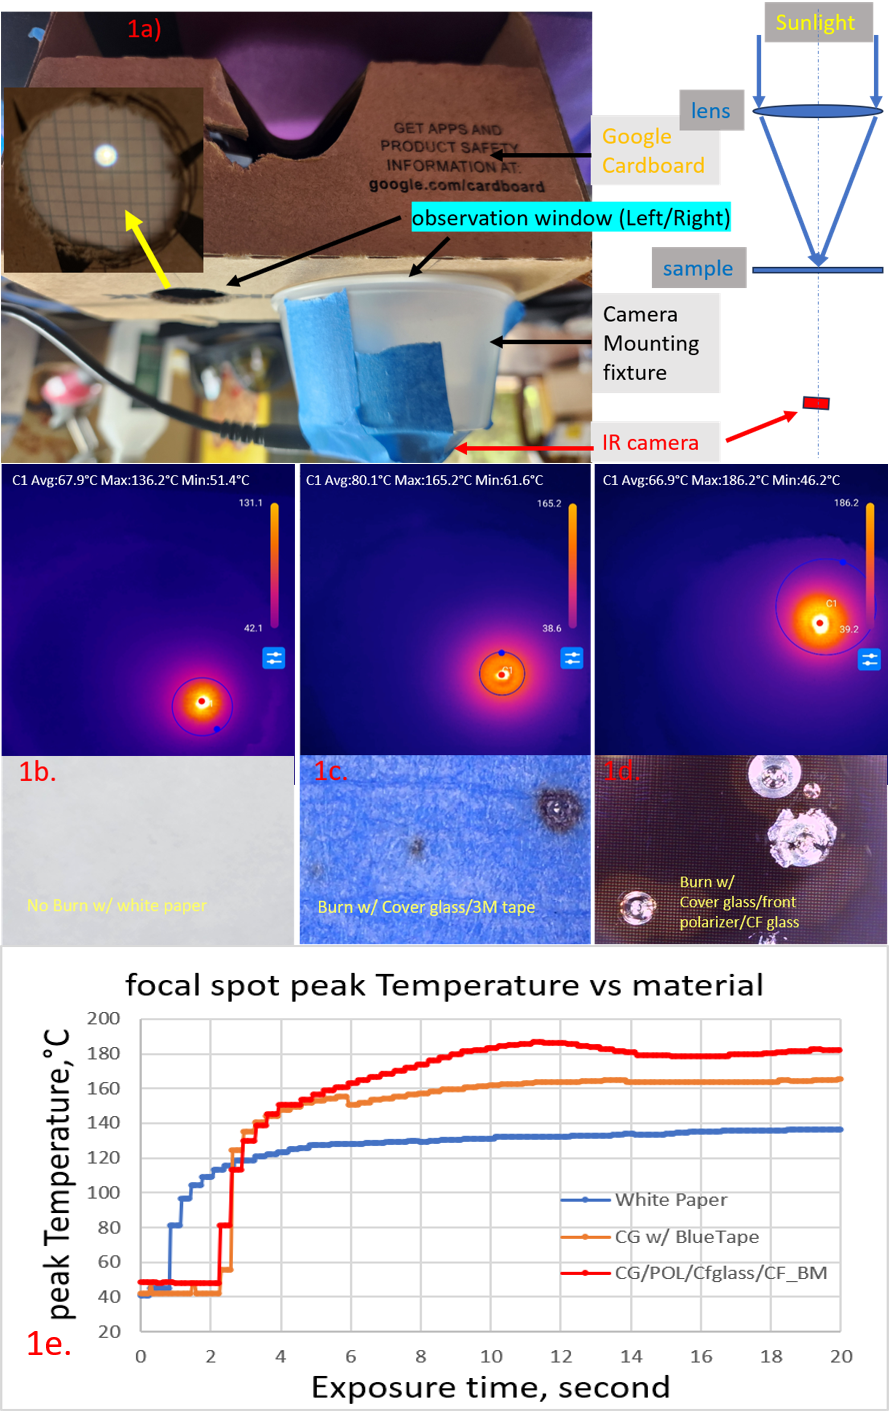
The focal spot reference diameter captured on the thermally sensitive paper was measured at 1.8 ± 0.2 mm, corresponding to a localized spot area Aspot of approximately 2.54 × 10⁻⁶ m². For comparison, direct visible-light photography of the focal image on the backside of the white paper – captured through the enclosure’s observation window, revealed a bright central spot surrounded by a fainter, wider halo extending beyond the 1.8 mm boundary (Figure 1a). This spatial profile indicates a non-uniform energy distribution within the focal spot. Consequently, the 1.8 mm measurement represents a threshold-limited lower bound on the true illuminated region, a distinction that is explored further in the Discussion section.
The total effective aperture area of the PMMA lens was calculated as Alens ≈ 1.075 × 10⁻³ m². With these geometric boundaries, we can calculate the Solar concentration ratio of this VR lens as:
At the assumed reference baseline ambient solar irradiance of 1,000 W/m² at solar noon24,25, the above concentration ratio yields an estimated peak focal irradiance of ∼423,000 W/m² – with the total raw radiant power captured by the lens aperture roughly 1.08 W. Taking into account a nominal 93% transmission efficiency through the PMMA lens, approximately 1W solar power is transmitted through the lens and focused into an area roughly 420 times smaller than the lens collection aperture. This extreme energy intensity is sufficient to drive thin, embedded polymer layers far beyond their intrinsic thermal thresholds within seconds of direct exposure.
Radiometric temperature bracketing and thermal saturation
As shown in Figure 1a, LWIR camera records the max. temperature of the hotspot as continuous video through the right-side observation window; the focused solar image on sample at the focal plane can be monitored from the left-side observation window. The recorded peak backside surface temperature-versus-time traces showed a distinct two-phase profile in all 3 experimental configurations: an initial rapid thermal ramp followed by a clear, well-defined plateau (Figure 1e), showing that the measured backside surface temperature reached approximate steady-state in less than 20 s continuous exposure; this plateau reflects stability of the backside surface measurement and does not necessarily indicate complete thermal equilibrium throughout the multilayer stack.
Our bracketing experiments revealed two primary thermodynamic trends. First, all three target configurations showed their thermal plateau in less than 20 seconds of continuous exposure. However, their steady-state limits differed significantly based on material absorptance: the white paper control peaked at approximately 136°C, the blue painter’s tape reference reached roughly 165°C, and the backside surface temperature of the isolated LCD front stack reached the highest peak at approximately 186°C. Second, while the isolated display front stack developed noticeable burn marks within the first few seconds of exposure, extending the exposure time beyond 20 seconds caused the blue tape reference to begin outgassing and smoking at approximately 30 seconds, whereas the white paper control sample remained structurally intact. Based on these findings, a 20-second exposure window was selected for the Stage 5 isolated stack trials to guarantee full thermal saturation without introducing unnecessary secondary fire risks.
We noticed the peak backside surface temperature of the isolated LCD front stack (~186°C) exceeded that of the white paper control (~136°C) by a 50°C – this big difference highlights the high efficiency of the multilayer display assembly as a solar heat trap. Physically, this trapping mechanism is mainly due to the low transmittance of LCD 5~14% – meaning up to 86~95% of the incident optical energy being absorbed and converted to heat by the absorptive front PVA polarizer (which absorbs over 50% of unpolarized incident light along its absorption axis), the underlying color filter (CF) array, the black matrix (BM) resin, and TFT/rear polarizer6,7. A comprehensive summary of the steady-state peak backside surface temperatures across all three target configurations is provided in Table 1.
| Configuration | Peak backside Surface temperature (°C) | Mean ± SD (°C) | n (trials) | |
| White paper | 130–140 | 136 ± 4 | 3 | |
| Cover glass/blue tape | 160–170 | 165 ± 4 | 3 | |
| Isolated LCD front stack | 178–190 (panel A) | 184–188 (panel B) | 186 ± 4 | Total 6 (3 per panel) |
Four-zone optical failure cascade
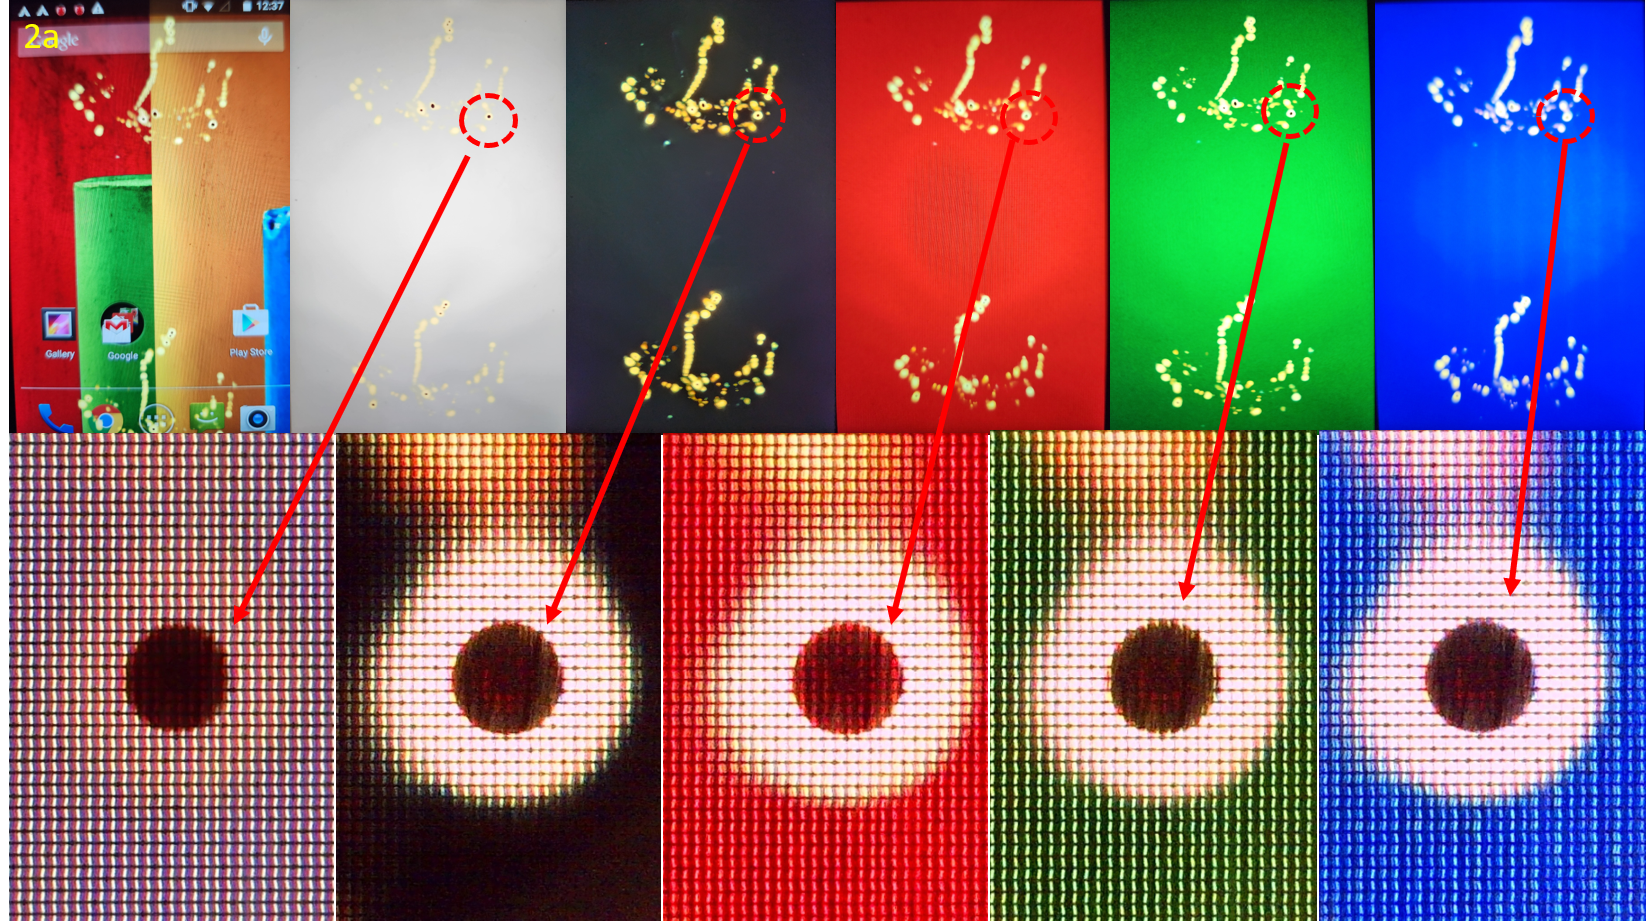
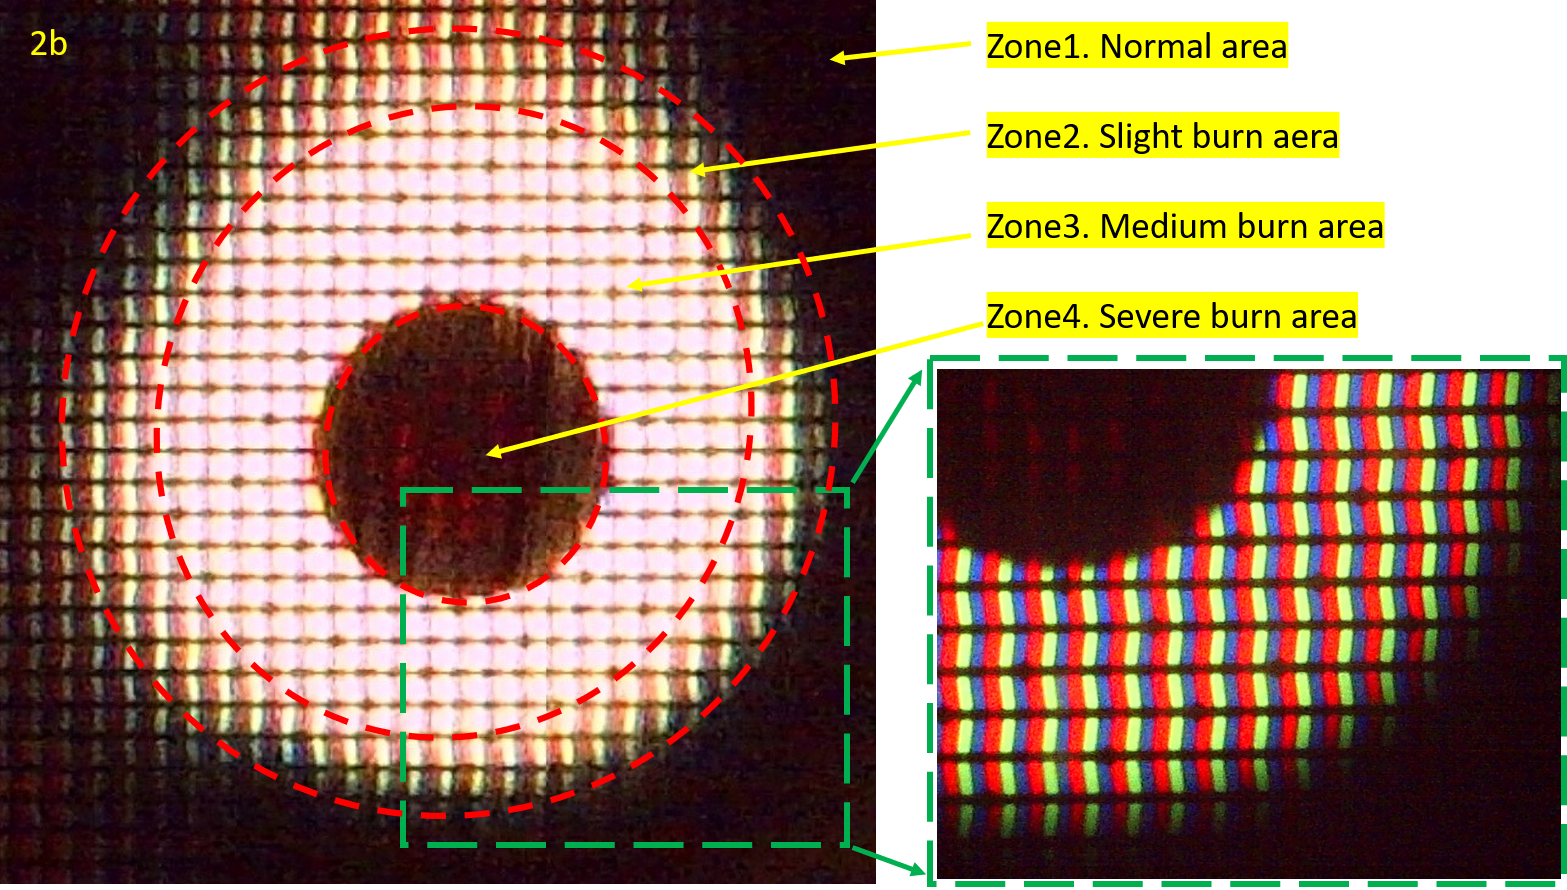
Monochromatic pattern diagnostics conducted during Stage 4 provided clear evidence of polarizer-mediated light leakage on all test screens. This phenomenon was most obvious on the full-screen black pattern, where the liquid crystal cells were expected to remain completely in their non-transmissive OFF-state. We inspected these regions under microscope, identified four spatially distinct failure zones that correspond to progressively higher localized irradiance profiles within the focal plane (Table 2, Figure 2).
Zone 1 (Normal, Baseline Control): The red, green, and blue (R/G/B) subpixel grid structures remained perfectly intact, showing full color saturation and expected switching behavior on all test patterns. The temperature in this region stayed below the actual damage thresholds of all display stack layers.
Zone 2 (Slight Burn / Permanent Color Shift): A clear greenish-to-brownish color tint became visible under all display patterns, indicating backlight leakage. A plausible explanation is Iodine sublimation from the PVA matrix8 degrades the polarizer extinction ratio but did not eliminate it completely – this allows a portion of the backlight to leak through the LC dark state while residual LC switching function is partially retained. Stage 7 Part 3 contact calibration and crossed-polarizer test confirmed permanent degradation of polarization function beginning at 85°C under 1-second direct contact (PSA surface) – the lowest temperature tested in that experiment, establishing 85°C as an empirical upper bound on damage onset (not a confirmed onset temperature, as no exposures below 85°C were conducted due to equipment limitations).
Zone 3 (Medium Burn / Total Polarization Loss): This region shows a highly uniform, bright yellowish-white zone under all five color patterns including the black test pattern. The observed brightness was higher than the standard, nominal ON-state, this is consistent with loss of front polarizer function and/or loss of LC modulation: without a functional linear front polarizer, and/or LC modulate, the full backlight flux transmits continuously, producing the always-on bright appearance regardless of displayed content. The above observation alone does not independently distinguish permanent polarizer function loss from permanent LC modulation loss. However, because the LC phase transition reverses3,26 upon cooling while PVA-iodine degradation is not irreversible8,9, the observation that Zone 3 failure persist at room temperature after cooling indicates the front polarizer is the primary cause of the permanent failure. Future work will prioritize definitive confirmation via a rescue test by replacing a fresh analyzer over the damaged region and driving monochromatic patterns.
Zone 4 (Severe Burn / Spectral Attenuation): At the center of the focused solar hotspot, this core zone shows a dark, brownish-red appearance on all color test patterns. Under high-magnification microscope we observed three main structural details from a 1-minute solar burn. First, the R/G/B subpixel column were still clearly visible, this directly confirms that the underlying color filter (CF) array stays structurally intact during the burn. Second, the light passing through this zone depended heavily on the color channel: it let the most light through in the red channel (>600 nm) but allowed almost zero light through in the blue-green bands (<550 nm). This dark brownish-red spectral profile does not match the flat, uniform absorption you would expect from carbon black alone. However, it is consistent with the behavior of thermally broken-down polyiodide species: in normal PVA polarizing films, I₅⁻ (absorbing at ~650 nm, visible red region) and I₃⁻ (absorbing at ~290–360 nm, UV region) are the two primary dichroic species27,28; when I₅⁻ is depleted by thermal stress, transmittance increases in the 525–675 nm range while residual I₃⁻ absorption persists in the UV/blue-green region28, transmitting more red light than any other colors. This interpretation is further supported by modulation-excitation spectroscopic analysis of dynamic iodine behavior in PVA films under thermal perturbation29. However, no chemical or spectroscopic characterization of the isolated degraded polarizer was performed in this study; confirming the identity of the absorbing species would require Raman spectroscopy and UV-vis transmittance measurement of the degraded layer, which are identified as priorities for future work. Third, the lines of the black matrix (BM) grid could still be faintly seen due to surface reflections. The Zone 4 temperature estimated to be slightly higher than 186°C based on the peak backside surface temperature ∼186°C (front polarizer is sandwiched between 0.5mm cover glass and 0.5mm CF glass) measured with the LWIR camera aiming on the backside surface of the CF glass.
| Zone | Temp (°C) | Pattern appearance | Microscopic appearance | Primary mechanism |
| 1 (normal) | < damage threshold | Normal image; black appears dark | Pristine R/G/B grid; full color saturation | No damage |
| 2 (slight burn) | ≥85°C (onset) Upper bound; not confirmed minimum | Greenish to Brownish tint; partial backlight leakage on all patterns including black pattern | R/G/B Pixel grid clearly visible; obvious color shift; backlight visible in dark state | Partial PVA depolarization; iodine sublimation above ∼90°C; LC partially functional |
| 3 (medium burn) | Within 85–186°C; boundaries not characterized | Channel-independent bright yellowish-white under all patterns; always-on, brighter than nominal on-state | R/G/B Pixel grid clearly visible; Full backlight floods through; uniformly bright independent to channels, no dark state | Complete PVA polarizer function loss; LC modulation destroyed (polarizer vs. LC contribution not independently distinguished in this study); full backlight continuously on |
| 4 (severe burn) | backside surface temp. ∼186°C à front polarizer temp. ≥186°C | Dark Brownish-red at center core under all patterns | R/G/B grid discernible, spectrally selective attenuation, partial red transmission, near-zero blue-green; BM grid faintly visible | Severe thermal degradation of PVA-iodine system; spectral behavior consistent with I5⁻ depletion producing preferential red transmission (spectroscopic confirmation needed); CF structurally intact |
Layer-resolved disassembly of the Solar-Damaged LCD
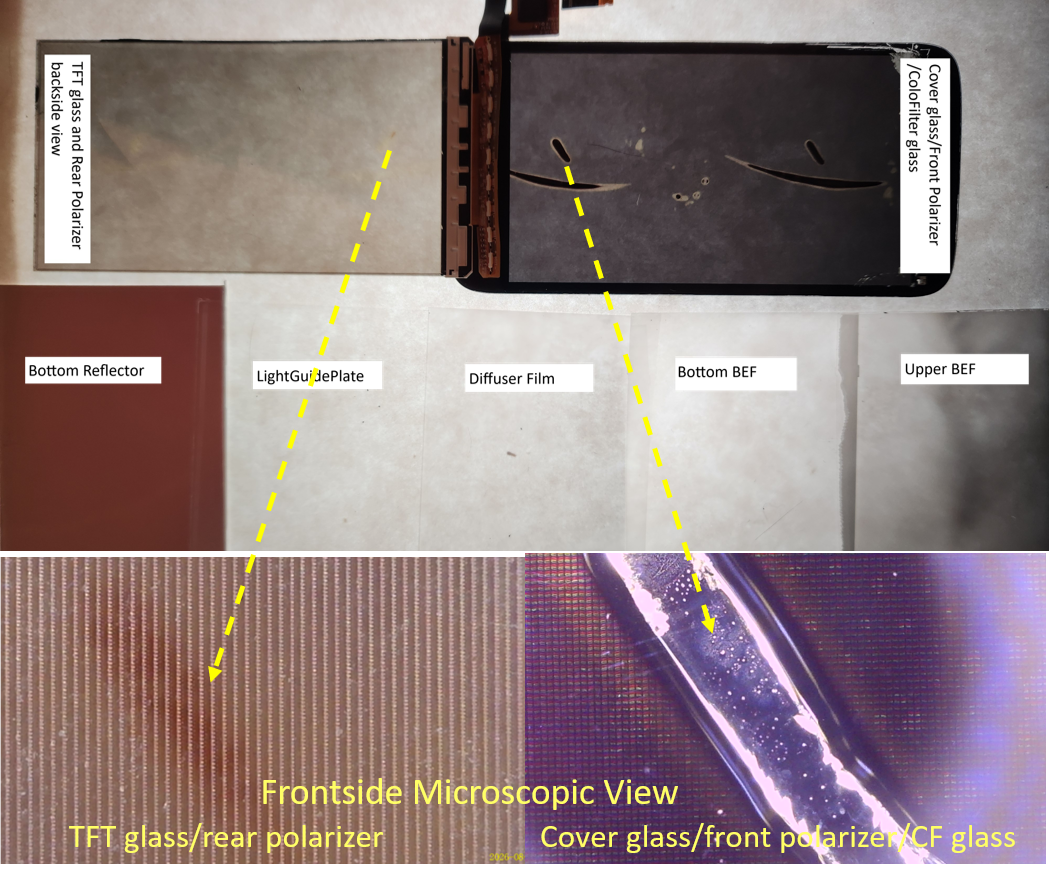
Following the display disassembly in Stage 5, we visually inspected all five parts of the backlight unit (BLU): the light guide plate, the diffuser film, the two brightness enhancement films (BEFs), and the bottom reflector. To do this, we put the film samples on a diffusive glass uniformly lit from the backside, examined the films under a magnifying lens. We further performed microscope inspection – Under the 37 mm aperture lens configuration, no visible thermal damage was detected on any BLU component; please note this inspection does not rule out sub-microscopic structural or material changes undetectable by visual optical examination. This seems to indicate that with the 37 mm VR lens setup, most of the focused solar energy is absorbed and attenuated by the multiple layers of the LC panel (i.e. front stack + LC + TFT/rear polarizer stack) before it can ever reach the BLU.
On the other hand, the TFT and rear polarizer stack did show some moderate thermal damage, but only in the area that underwent the long 1-hour exposure test. During this extended test, the front stack – including the cover glass, front polarizer, and color filter glass, showed the most severe damage. As shown in Figure 3, the front stack suffered from clear film delamination and a localized rupture zone at the center, which was surrounded by a large field of PSA bubbles. In addition, the physical location of the burn marks on the TFT glass and rear polarizer stack matched the exact location of the marks on the front stack. This confirms that once the front polarizer is severely damaged, it stops shielding the layers beneath it, allowing the concentrated solar irradiance to penetrate deeper and damage the rear polarizer underneath.
Microscopic Verification and Cross-Comparison
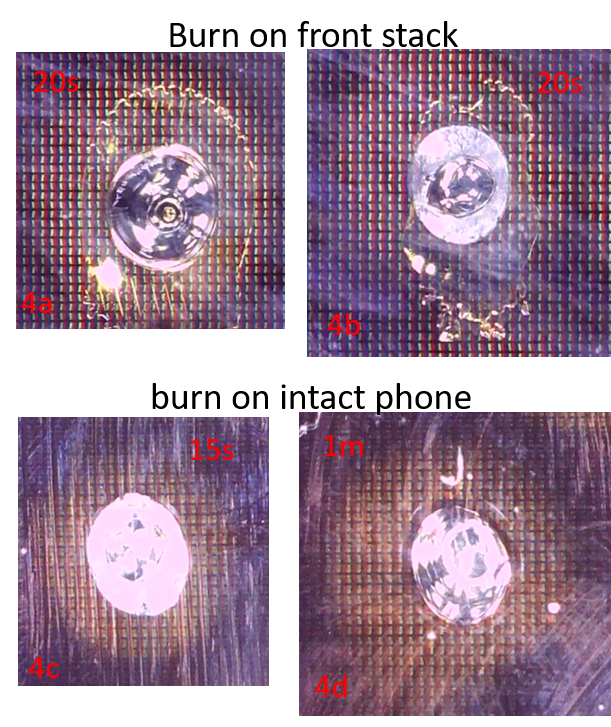
Figure 4 shows a comparison of the burn marks on the front polarizer stack from stage 5 and burn marks on the intact phone from stage 3. We found that burn marks from both stages showed same central zone 4 (dark, delaminated area) surrounded by a PSA bubble and bright pixels on a supposedly full black screen. This structural alignment confirms that the solar damage mechanism in the isolated front stack experiment is consistent with those in the intact phone experiment.
Stage 7 contact calibration – temperature sweep (Parts 1 and 2)
Figure 5 shows the results from the stage 7 thermal contact experiment. As shown in Figure 5a, the permeant damage on the APCF hard coat surface happened not only at tip temperature 90°C and above, it also happened at 85°C. Figure 5b shows that 180°C tip, (with 2/5/10 s dwell) produced central degradation zones on the intact APCF/hard coat surface. Peeling off the APCF hard coat from the same damaged area (Figure 5c) reveals that thermal contact burns from 180°C tip, (5 and 10 s dwell) were very similar to the zone 4 severe solar burn damage.
Stage 7 contact calibration – crossed-polarizer functional validation (Part 3)
Figure 5c shows the Crossed-polarizer inspection configuration: a reference front polarizer is oriented at 90° and placed in between the damaged rear polarizer assembly and the illumination light source. When a polarizer sample is inspected under such configuration, regions with normal polarization function will appear dark, while regions with permanent polarization loss will show bright light leakage. So, Figure 5e and 5f reveal permanent polarizer damage after 1 s contact with tip temperature 85–110°C, also indicating that permanent polarization function loss initiates at 85°C (lowest tip temperature we tested); no test below 85°C were conducted as we could not reliably control the temperature below 85°C, so the 85°C is an empirical upper bound of the onset temperature rather than directly confirmed threshold; figure 5g and 5h reveal burn structure from 180°C PSA contact burns are same as those caused by solar burn – dark center zone 4 (severe burn) surrounded by bright zone 3 (complete polarization function loss). However, because the thermal contact experiments apply heat via conduction to the polarizer, while focused sun light delivers radiative energy, which is absorbed and then converted to heat, one should not take this contact experiment findings as independent confirmation that the two mechanisms are identical.
Supplementary Table S1 summarizes the exposure matrix and primary findings as follows:
| Stage | Exposure condition | Panel(s) | Trials (n) | Primary result |
| 3 | 1, 2, 3…15 s; 1, 2 m; solar bursts (intact device) | Panel A, B | Multiple sequential per panel | Macroscopic damage, spot size and severity grow with exposure time |
| 5 | 20 s solar exposure (Isolated front stacks) | Panel A and B | n = 3 per panel N = 6 total | Peak backside surface temperature 186 ± 4°C pooled (combined uncertainty ±6°C); temperature plateau |
| 7 Part1 | Temp sweep (85–140°C, 1 s) (intact APCF/hard coat on the isolated rear polarizer stack) | Panel A and B | n = 3 per temp/panel | Visible permanent damage from 85°C (lowest tip temperature tested) |
| 7 Part2 | Dwell sweep (180°C, 2/5/10 s) (intact APCF/hard coat on the isolated rear polarizer stack) | Panel A and B | n = 3 per dwell/panel | progressive Zone 4-type morphology at 180°C |
| 7 Part3 | Temp sweep (85–140°C, 1 s) and Dwell sweep (180°C, 2/5/10 s); (PSA surface of the isolated rear polarizer stack) | Panel A and B | n = 3 per temp/dwell per panel | Permanent polarization function loss from 85°C tip temperature (lowest tested); 180°C burns: dark center + bright ring matching Zone 4+3 morphology |
Discussion
In this experimental study, we found that the peak backside surface temperature of the isolated LCD front stack, which was taken from a deconstructed smartphone LCD, reached ~186°C during a 20 second exposure of ~423 suns under solar noon condition. 186°C, although far exceeded the >90°C8 onset of iodine sublimation in PVA polarizer, should be taken as a conservative lower bound of the front polarizer temperature since the temperature was measured on the rear surface of the 0.5mm CF glass rather than the front polarizer surface directly. Commercial LCD liquid crystal mixtures are typically formulated with nematic-isotropic clearing points in the range of approximately 60–80°C; for example, a clearing point of 60.5°C has been reported for the E5 LC mixture3, while Merck KGaA’s standard TFT-LCD benchmark mixture ZLI-4792 has a clearing point of 75°C26. Since this 186°C is measured from backside surface of the front stack, i.e. the CF side, next to LC, the LC fluid likely exceeded its clearing point during exposure. However, even so, the LC would realign after cooling to room temperature because the nematic-to-isotropic LC phase transition is reversible. Therefore, the fact that Zone 2 and Zone 3 light-leakage artifacts persisted at room temperature indicates the front PVA polarizer — not the LC fluid — is the primary cause of the permanent failure.
The observed four-zone failure cascade spatially reflects the progressive degradation of the PVA polarizer under the non-uniform irradiance profile of the focal spot. At the focal periphery (Zone 2), partial iodine sublimation8 produces a characteristic greenish-to-brownish backlight leakage, though the underlying LC layer still retains residual electrical modulation capabilities. At intermediate irradiance intensities (Zone 3), the channel-independent always-on brightness behavior is consistent with complete front PVA polarizer function loss; while this observation alone does not independently distinguish polarizer failure from LC modulation failure, the reversibility argument above isolates the polarizer as the primary cause of permanent failure. Finally, at the geometric center of the focal spot (Zone 4), the observed dark brownish-red spectral profile at measured backside surface temperature of ∼186°C is inconsistent with the spectrally flat absorption profile typical of carbon black but is consistent with the behavior of thermally degraded polyiodide species: when I₅⁻ is depleted by thermal stress, transmittance increases in the 525–675 nm range while residual I₃⁻ absorption persists in the UV/blue-green region28, transmitting more red light than any other colors. This spectral interpretation is further supported by independent Raman27,28 and UV-Vis28 characterization of PVA-iodine films and by modulation-excitation spectroscopic analysis of dynamic iodine behavior in PVA films under thermal perturbation29; spectroscopic characterization of the isolated degraded polarizer from this study would directly confirm this interpretation.
Importantly, the R/G/B subpixel column structure remains clearly visible in Zone 4 under high-magnification microscopy (Figure 2b inset). This observation directly confirms that the underlying color filter (CF) array maintains its structural integrity beneath the degraded polarizer.
The TFT glass and rear polarizer stack showed intermediate-severity damage only under extended solar exposure. This is consistent with a top-down thermal failure sequence: the front polarizer fails first, and as its material matrix degrades, deeper energy penetration eventually exposes the underlying rear polarizer layers. The crossed-polarizer calibration confirmed that this rear optical stack is independently susceptible to permanent polarization failure within the focal zone. On the other hand, the BLU inspection result – no visible thermal damage detected under optical microscopy inspection of any BLU component under the 37 mm aperture configuration, is consistent with the high absorptance of the front stack preventing significant optical energy from reaching the BLU. This inspection does not rule out sub-microscopic changes; further material analysis of the BLU components would be required to establish structural integrity at the material level.
These findings carry direct consumer safety and design implications for the specific configuration tested – a Google Cardboard VR V2 enclosure generates a geometric concentration ratio estimate of ∼423 suns at the enclosed display surface under solar noon conditions. The peripheral damage documented in Zone 2 demonstrates that even the lower-irradiance outer region of the focused beam produces permanent partial depolarization and persistent backlight leakage. This makes the effective functional damage footprint larger than the visible Zone 4 attenuation spot at the center. The severity of damage is specific to this optical geometry (37 mm aperture, 45 mm focal length PMMA lens) and this display design (Motorola Moto G XT1032); enclosures with different aperture sizes, focal lengths, or lens materials, and displays with different front stack compositions or thermal mass, may produce different outcomes. However, to achieve larger Field of View (FOV) for better immersive gaming experience, advanced VR headsets tend to use larger aperture lens that’s designed with better aberration control – meaning the effective concentration ratio could be even higher than the specific configuration tested in this study, thus the risk of accidental solar damage could be higher if not properly designed. Consequently, users should be strongly advised against leaving VR enclosures unattended in direct sunlight. To mitigate these risks, hardware manufacturers could consider integrating automated lens covers, solar-triggered mechanical shutters, or more thermally stable optical film materials.
Several limitations must be acknowledged. This study was conducted using a single smartphone model paired with one specific VR enclosure style. Furthermore, the two temperatures within the failure cascade were empirically established in this work: the lowest contact temperature producing observed damage (≥85°C, via Stage 7 Part 3 contact calibration, empirical upper bound of onset temperature) and the measured backside surface temperature at the focal center (∼186°C via Stage 5 LWIR measurements). The precise boundary temperatures at which the Zone 2/3 and the Zone 3/4 transition occur within that 85°C–186°C interval were not directly characterized. Direct in-situ layer measurement remains a fundamental challenge because front-side LWIR thermometry physically blocks the incoming solar flux, rear-side LWIR thermometry cannot resolve individual layer temperatures through the opaque stack, and embedding temperature sensors could measure the layer temperature but would fundamentally alter the thermal conductivity under study. The Zone 4 spectral interpretation is consistent with but not yet confirmed by the cited spectroscopic evidence; Raman and UV-Vis transmittance measurement of the isolated degraded polarizer layer from this study is identified as priority future work. The polarizer rescue test (removing the damaged front polarizer and replacing with a fresh calibrated analyzer over the damaged region) would directly confirm the front polarizer as the sole source of permanent operational failure. Finally, a comparative thermal analysis of OLED display panels is reserved for future research.
Conclusion
In this study we established the layer-by-layer thermal failure cascade of a LCD under concentrated solar radiation in a low-cost Google Cardboard VR viewer. First, we obtained a geometric concentration ratio estimate of ∼423 by measuring the lens focal spot under solar noon condition; second, we identified that the front polyvinyl alcohol (PVA) polarizer failed first by deconstructing the damaged LCD panel layer-by-layer, with LWIR camera further revealing that the backside surface temperatures of the front polarizer stack reached ∼186°C under concentrated solar radiation. Through separate thermal contact experiments, we confirmed permanent polarization function loss beginning at 85°C (lowest temperature tested). Under the 37 mm aperture lens configuration, we found that the CF array under the front polarizer is structurally intact, but we did not find any visible thermal damage on each of the BLU sub-components. A four-zone degradation pattern is identified, showing progressive damage severity and backlight leakage. These findings highlight a critical consumer safety hazard in VR hardware.
Acknowledgments
I would like to thank my mentors for guiding me through the process of writing this paper. Their expertise and support have contributed greatly to my project’s completion. Free Generative artificial intelligence tools (Gemini and Claude) were utilized solely to refine grammar, check phrasing, and proofread the text of this manuscript. The conceptualization, experimental design, hardware testing, data collection, scientific interpretation, and final conclusions were authored and executed entirely by the author, who accepts full accountability for the integrity of the work. No external funding was received for this study.
References
- P. Yeh, C. Gu. Optics of liquid crystal displays, 2nd ed. Wiley: Hoboken, NJ, 2010. [↩]
- W. den Boer. Active matrix liquid crystal displays. Elsevier: Amsterdam, Netherlands, 2005. [↩]
- D.-K. Yang, S.-T. Wu. Fundamentals of liquid crystal devices, 2nd ed. Wiley-SID: Chichester, UK, 2014 [↩] [↩] [↩]
- T. Kaiho. Industrial applications of organic polyiodides. Arkivoc (Archive for Organic Chemistry). Vol. 2021, part vii, pg. 66–78, 2021. https://doi.org/10.24820/ark.5550190.p011.590. [↩]
- Y. Li, J. Xie, H. Cheng, X. Wei, J. Chen, L. You, W. Chen. Polyvinyl alcohol-based polarizers for new displays: molecules, processing and properties. Soft Matter. Vol. 21, no. 17, pg. 3148–3167, 2025. https://doi.org/10.1039/d4sm01530d [↩]
- S. Klein. Optical efficiency for different liquid crystal colour displays. Technical Report HPL-2000-83. HP Laboratories: Bristol, UK, 2000. [↩] [↩]
- N. Guselnikov, P. Lazarev, M. Paukshto, P. Yeh. Translucent LCD. Proceedings of the 13th International Symposium “Advanced Display Technologies”. Minsk, Republic of Belarus, September 2004. Optiva, Inc.: South San Francisco, CA, USA, 2004 [↩] [↩]
- Y. Do Kim, J. Uk Lee, J. J. Lee. Improving durability of dye-based polarizing films using novel reactive dyes as dichroic materials. Polymers. Vol. 15, no. 22, pg. 4365, 2023. https://doi.org/10.3390/polym15224365 [↩] [↩] [↩] [↩] [↩] [↩]
- Babiker, J. Chen, Y. Fan, H. Cheng, K. Ye, Z. Wu, A. Hassan, D. Wang, W. Chen. Failure mechanism of iodine-doped poly(vinyl alcohol) polarizer under high temperature and high humidity conditions. ACS Applied Polymer Materials. Vol. 7, no. 22, pg. 15354–15364, 2025. https://doi.org/10.1021/acsapm.5c02936 [↩] [↩]
- J. Li, Y. Yin, H. Meng. Research progress of color photoresists for TFT-LCD. Dyes and Pigments. Vol. 225, Art. no. 112094, 2024. https://doi.org/10.1016/j.dyepig.2024.112094 [↩]
- R. W. Sabnis. Color filter technology for liquid crystal displays. Displays. Vol. 20, no. 3, pg. 119–129, 1999. https://doi.org/10.1016/S0141-9382(99)00013-X [↩]
- A. J. Kinloch. Adhesion and adhesives: Science and technology. Chapman and Hall: London, 1987. [↩]
- T.-I. Lin, A. Chen, S.-I. Chen, J. Leu. Effects of thermomechanical properties of polarizer components on light leakage in thin-film transistor liquid-crystal displays. Japanese Journal of Applied Physics. Vol. 54, Art. no. 076701, pg. 076701, 2015. https://doi.org/10.7567/JJAP.54.076701 [↩]
- E. Hecht. Optics, 5th ed. Pearson: London, UK, 2017. [↩]
- F. L. Rashid, M. A. Al-Obaidi, A. J. Mahdi, A. Ameen. Advancements in Fresnel lens technology across diverse solar energy applications. Energies. Vol. 17, no. 3, pg. 569, 2024. https://doi.org/10.3390/en17030569 [↩] [↩]
- S. Martin, J. Watanabe. DLP® technology: Solar loading in augmented reality head-up display systems. Technical Report DLPA096. Texas Instruments: Dallas, TX, USA, 2018. https://www.ti.com/lit/wp/dlpa096/dlpa096.pdf. [↩]
- K. Li. Reduced solar-loading using micro-mirror array in automotive HUD. SID Symposium Digest of Technical Papers. Vol. 53, no. 1, 54-3, pg. 712-714, 2022. https://doi.org/10.1002/sdtp.15588 [↩]
- W. J. Nill. Method and apparatus for attenuating solar flux in a head-up display. U.S. Patent No. 6,574,048B2. Delphi Technologies, Inc., 2003 [↩]
- G. Wypych. Handbook of polymers, 2nd ed. ChemTec Publishing: Toronto, ON, Canada, 2016 [↩]
- W. T. Xie, Y. J. Dai, R. Z. Wang, K. Sumathy. Concentrated solar energy applications using Fresnel lenses: a review. Renewable and Sustainable Energy Reviews. Vol. 15, no. 6, pg. 2588–2606, 2011. https://doi.org/10.1016/j.rser.2011.03.031 [↩]
- M. A. Bramson. Infrared radiation: A handbook for applications. Springer: New York, NY, USA, 1968 [↩] [↩]
- Honnerová, P., Veselý, Z., Matějíček, J. et al. Coating evaluation methodology for low-temperature thermographic application. Sci Rep 16, 6090, 2026. https://doi.org/10.1038/s41598-026-37319-y. [↩] [↩]
- O. Riou, P.-O. Logerais, F. Delaleux, J.-F. Durastanti. A self-method for resolving the problem of apparent LWIR emissivity for quantitative thermography at ordinary temperatures. Proceedings of the 12th International Conference on Quantitative Infrared Thermography (QIRT 2014). Paper QIRT-2014-115, 2014. https://www.ndt.net/article/qirt2014/papers/QIRT-2014-115.pdf [↩] [↩]
- P. R. Michael, D. E. Johnston, W. Moreno. A conversion guide: solar irradiance and lux illuminance. Journal of Measurements in Engineering. Vol. 8, no. 4, pg. 153–168, 2020. https://doi.org/10.21595/jme.2020.21667 [↩] [↩]
- International Electrotechnical Commission. IEC 60904-3:2019 Photovoltaic devices — Part 3: Measurement principles for terrestrial PV solar devices with reference spectral irradiance data. IEC: Geneva, Switzerland, 2019 [↩] [↩]
- P. Kirsch, M. Bremer. Nematic liquid crystals for active matrix displays: Molecular design and synthesis. Angewandte Chemie International Edition. Vol. 39, no. 23, pg. 4216–4235, 2000. https://doi.org/10.1002/1521-3773(20001201)39:23<4216::AID-ANIE4216>3.0.CO;2-K [↩] [↩]
- Y. Song, S. Zhang, J. Kang, J. Chen, Y. Cao. Water absorption dependence of the formation of poly(vinyl alcohol)–iodine complexes for PVA films. RSC Advances. Vol. 11, no. 46, pg. 28785–28796, 2021. https://doi.org/10.1039/d1ra04867h. [↩] [↩]
- Y. Yang, Z. Zheng, J. Lin, L. Zhou, G. Chen. Effect of KI concentration in correcting tank on optical properties of PVA polarizing film. Polymers. Vol. 14, no. 7, pg. 1413, 2022. https://doi.org/10.3390/polym14071413 [↩] [↩] [↩] [↩] [↩]
- T. Yumine, T. Kamijo, T. Sugiyama, N. Maeda, A. Harata. Modulation-excitation spectroscopic analysis of dynamic behavior of iodine in poly(vinyl alcohol) film. Journal of Physical Chemistry C. Vol. 130, no. 9, pg. 3359–3365, 2026. https://doi.org/10.1021/acs.jpcc.5c08407 [↩] [↩]