Abstract
Pain can affect physical activity in older adults, but the association between physical activity and pain-related functional limitation among those with bothersome pain remains unclear. We examined the association using a cross-sectional analysis of the 2023 National Health and Aging Trends Study (NHATS) dataset. Among 8,597 participants, 305 community-dwelling older adults with bothersome pain had accelerometry data. Physical activity was assessed using active minutes and log total activity counts. Survey-weighted logistic regression accounted for the NHATS sampling design and adjusted for age, sex, arthritis, and depression. Exploratory random forest models tested whether adding physical activity improved prediction beyond these covariates. Participants without pain-related functional limitation accumulated about 48 more active minutes/day than those with limitation (355.9 vs 307.9 minutes/day). Each additional 30 active minutes/day was associated with lower odds of limitation (OR = 0.918; 95% CI, 0.860-0.979; p = 0.010). A 1-SD increase in log total activity counts was also associated with lower odds of limitation (OR = 0.633; 95% CI, 0.474-0.845; p = 0.003). Self-reported walking was not associated with limitation. In exploratory machine-learning analyses, adding log total activity counts provided the greatest improvement beyond core covariates, increasing AUC from 0.615 to 0.671 and reducing Brier score from 0.242 to 0.229.Objectively measured physical activity was associated with pain-related functional limitation among older adults with bothersome pain across two complementary accelerometer-derived measures, whereas the association was not detected using the binary self-reported walking measure.
Keywords: older adults, pain, activity limitation, physical activity, accelerometry, NHATS, machine learning
Introduction
Maintaining physical activity is important for healthy aging because higher physical activity is associated with better ability to perform daily activities and maintain independence in older adults1. Pain can complicate this goal. Recent national data show that pain remains common among older adults. In the 2023 National Health Interview Survey, 36.0% of U.S. adults aged 65 years or older reported chronic pain, and 13.5% reported high-impact chronic pain that frequently limited life or work activities2. In the National Health and Aging Trends Study (NHATS), bothersome pain has also been associated with poorer physical capacity and function3. Pain is also linked to falls, balance problems, and fear of falling that limits activity4. These effects demonstrate why the impact of pain on daily life matters.
For older adults already experiencing pain, staying physically active can be difficult even when exercise is generally encouraged. Research on kinesiophobia and fear avoidance in older populations has focused largely on people with chronic pain, and higher levels of kinesiophobia have been reported in frailer older adults5. In a longitudinal study of older adults with chronic pain, lower kinesiophobia predicted higher physical activity one year later6. Together, these associations may help explain the close relationship between pain-related functional limitation and physical activity.
Prior research has examined pain and physical activity using both self-reported and device-based measures. A systematic review found that older adults with chronic musculoskeletal pain were less active than pain-free peers7. Among community-dwelling older adults, a greater number of chronic musculoskeletal pain sites was associated with fewer daily steps and less accelerometer-measured moderate-to-vigorous physical activity8. In the Baltimore Longitudinal Study of Aging, Cai et al. reported several nominal associations between pain location or laterality and accelerometer-measured activity, including fewer active minutes among participants with unilateral knee pain. However, none of the associations remained significant after correction for multiple testing9. Other device-based studies have found associations between accelerometer-derived activity patterns and several distinct dimensions of pain, such as pain intensity, pain interference, or pain at specific body sites. Fan et al. found site-specific associations between accelerometer-derived activity patterns and pain at several body sites10. Fanning et al. examined changes in activity intensity and bout duration in relation to pain intensity and interference among low-active older adults with chronic pain11. Lager et al. found that higher pain intensity was associated with having a more sedentary device-measured activity pattern12. Among older adults with musculoskeletal disorders, those with severe chronic pain accumulated fewer daily steps than those with mild pain13. Among community-dwelling older Latinx adults, pain severity and accelerometer-measured physical activity were both associated with physical frailty14. Among community-dwelling Japanese older adults, multisite, moderate-to-severe, and neuropathic-like chronic pain were associated with lower accelerometer-measured locomotive activity, while non-locomotive activity and sedentary time showed no clear associations15. Together, these findings show that objectively measured daily movement has been studied in relation to several pain-related characteristics in older adults. However, less is known about the association between objectively measured physical activity and pain-related functional limitation, which specifically reflects whether pain limits daily activities. The current study addresses this gap by examining this association among older adults who already report bothersome pain and by using accelerometer-derived measures to characterize free-living activity.
The NHATS collects longitudinal data on health, function, and physical activity in Medicare beneficiaries and has been used to study the relationship between physical activity and pain. Using NHATS data, Koren et al. found that physical activity was associated with less bothersome pain and fewer pain sites cross-sectionally, while walking or vigorous exercise was associated with a lower risk of new or worsening pain prospectively16. Liu et al. used NHATS data from 2015–2018 to examine physical activity and pain over time. They measured activity through self-reported walking and vigorous activity, and defined pain occurrence as bothersome pain or frequent pain-medication use. They found that self-reported walking and vigorous activity were not associated with a lower risk of pain17. Their study examined the occurrence and persistence of pain rather than pain-related functional limitation among older adults. Their study also did not examine older adults with existing bothersome pain. Self-reported physical activity is susceptible to recall and reporting error18, whereas the NHATS accelerometry data provide an objective measure of free-living movement19.
We hypothesized that objectively measured physical activity would be associated with pain-related functional limitation among community-dwelling older adults with bothersome pain. This hypothesis was tested using data from the 2023 Round 13 NHATS wrist accelerometry19,20. Survey-weighted logistic regression was used to evaluate the association. As a complementary exploratory analysis, random forest models were used to see whether physical activity added predictive information about pain-related functional limitation using a flexible modeling approach. Because the primary analysis was cross-sectional, the findings were interpreted as associations; the direction of the relationship and causality could not be determined.
Methods
Study Design, Data Source, and Study Population
This cross-sectional study used the 2023 NHATS Round 13 final release, Version 221. NHATS was initiated in 2008 and started data collection in 2011 as an ongoing population-based longitudinal study designed to represent U.S. Medicare beneficiaries aged 65 years and older and collects annual information on health, disability, daily activities, living arrangements, and related aspects of aging20,22. The analysis used deidentified public-use Sample Person and accelerometry summary files. The unique NHATS sample-person identifier was used to link interview and device data. The public-use Round 13 Sample Person file included 8,597 participants. NHATS selected 639 participants for the Round 13 accelerometry sample; 590 were eligible for accelerometry assessment, and 550 had valid accelerometry data19. The Round 13 accelerometry cohort was followed from the Round 11 accelerometry sample, which represented Medicare beneficiaries aged 65 years and older as of October 1, 2014. By Round 13, participants in this cohort were within age categories beginning at 70–74 years. There is no additional age restriction that was applied in the present study.
For this study, participants were further required to live in the community rather than a residential-care setting, report bothersome pain during the previous month, and provide a valid response to whether pain limited their activities. The analysis was restricted to community-dwelling participants because the study focused on free-living physical activity among older adults living in community settings. Daily movement in residential-care settings may be shaped by structured routines, staff assistance, and environmental constraints that differ from those experienced by community-dwelling adults. Restricting the study population therefore provided a more clearly defined setting for interpreting accelerometer-measured movement. This restriction defined the target population as community-dwelling older adults and limits generalizability to individuals living in residential-care settings. Among the 550 participants with valid accelerometry, 513 were community-dwelling. Thirty-seven residential-care participants (6.7%) were excluded.
Bothersome pain was identified using the NHATS variable ss13painbothr, based on the question, “In the last month, have you been bothered by pain?” Participants who responded yes were included in the analytic population. The final primary analytic sample contained 305 participants.
The pain-related functional limitation item referred to the month preceding the NHATS interview, while wrist accelerometry was initiated during the interview and captured movement over the monitoring period. Therefore, these measures represent adjacent observation periods and the analysis measures their association rather than a directional or causal effect.
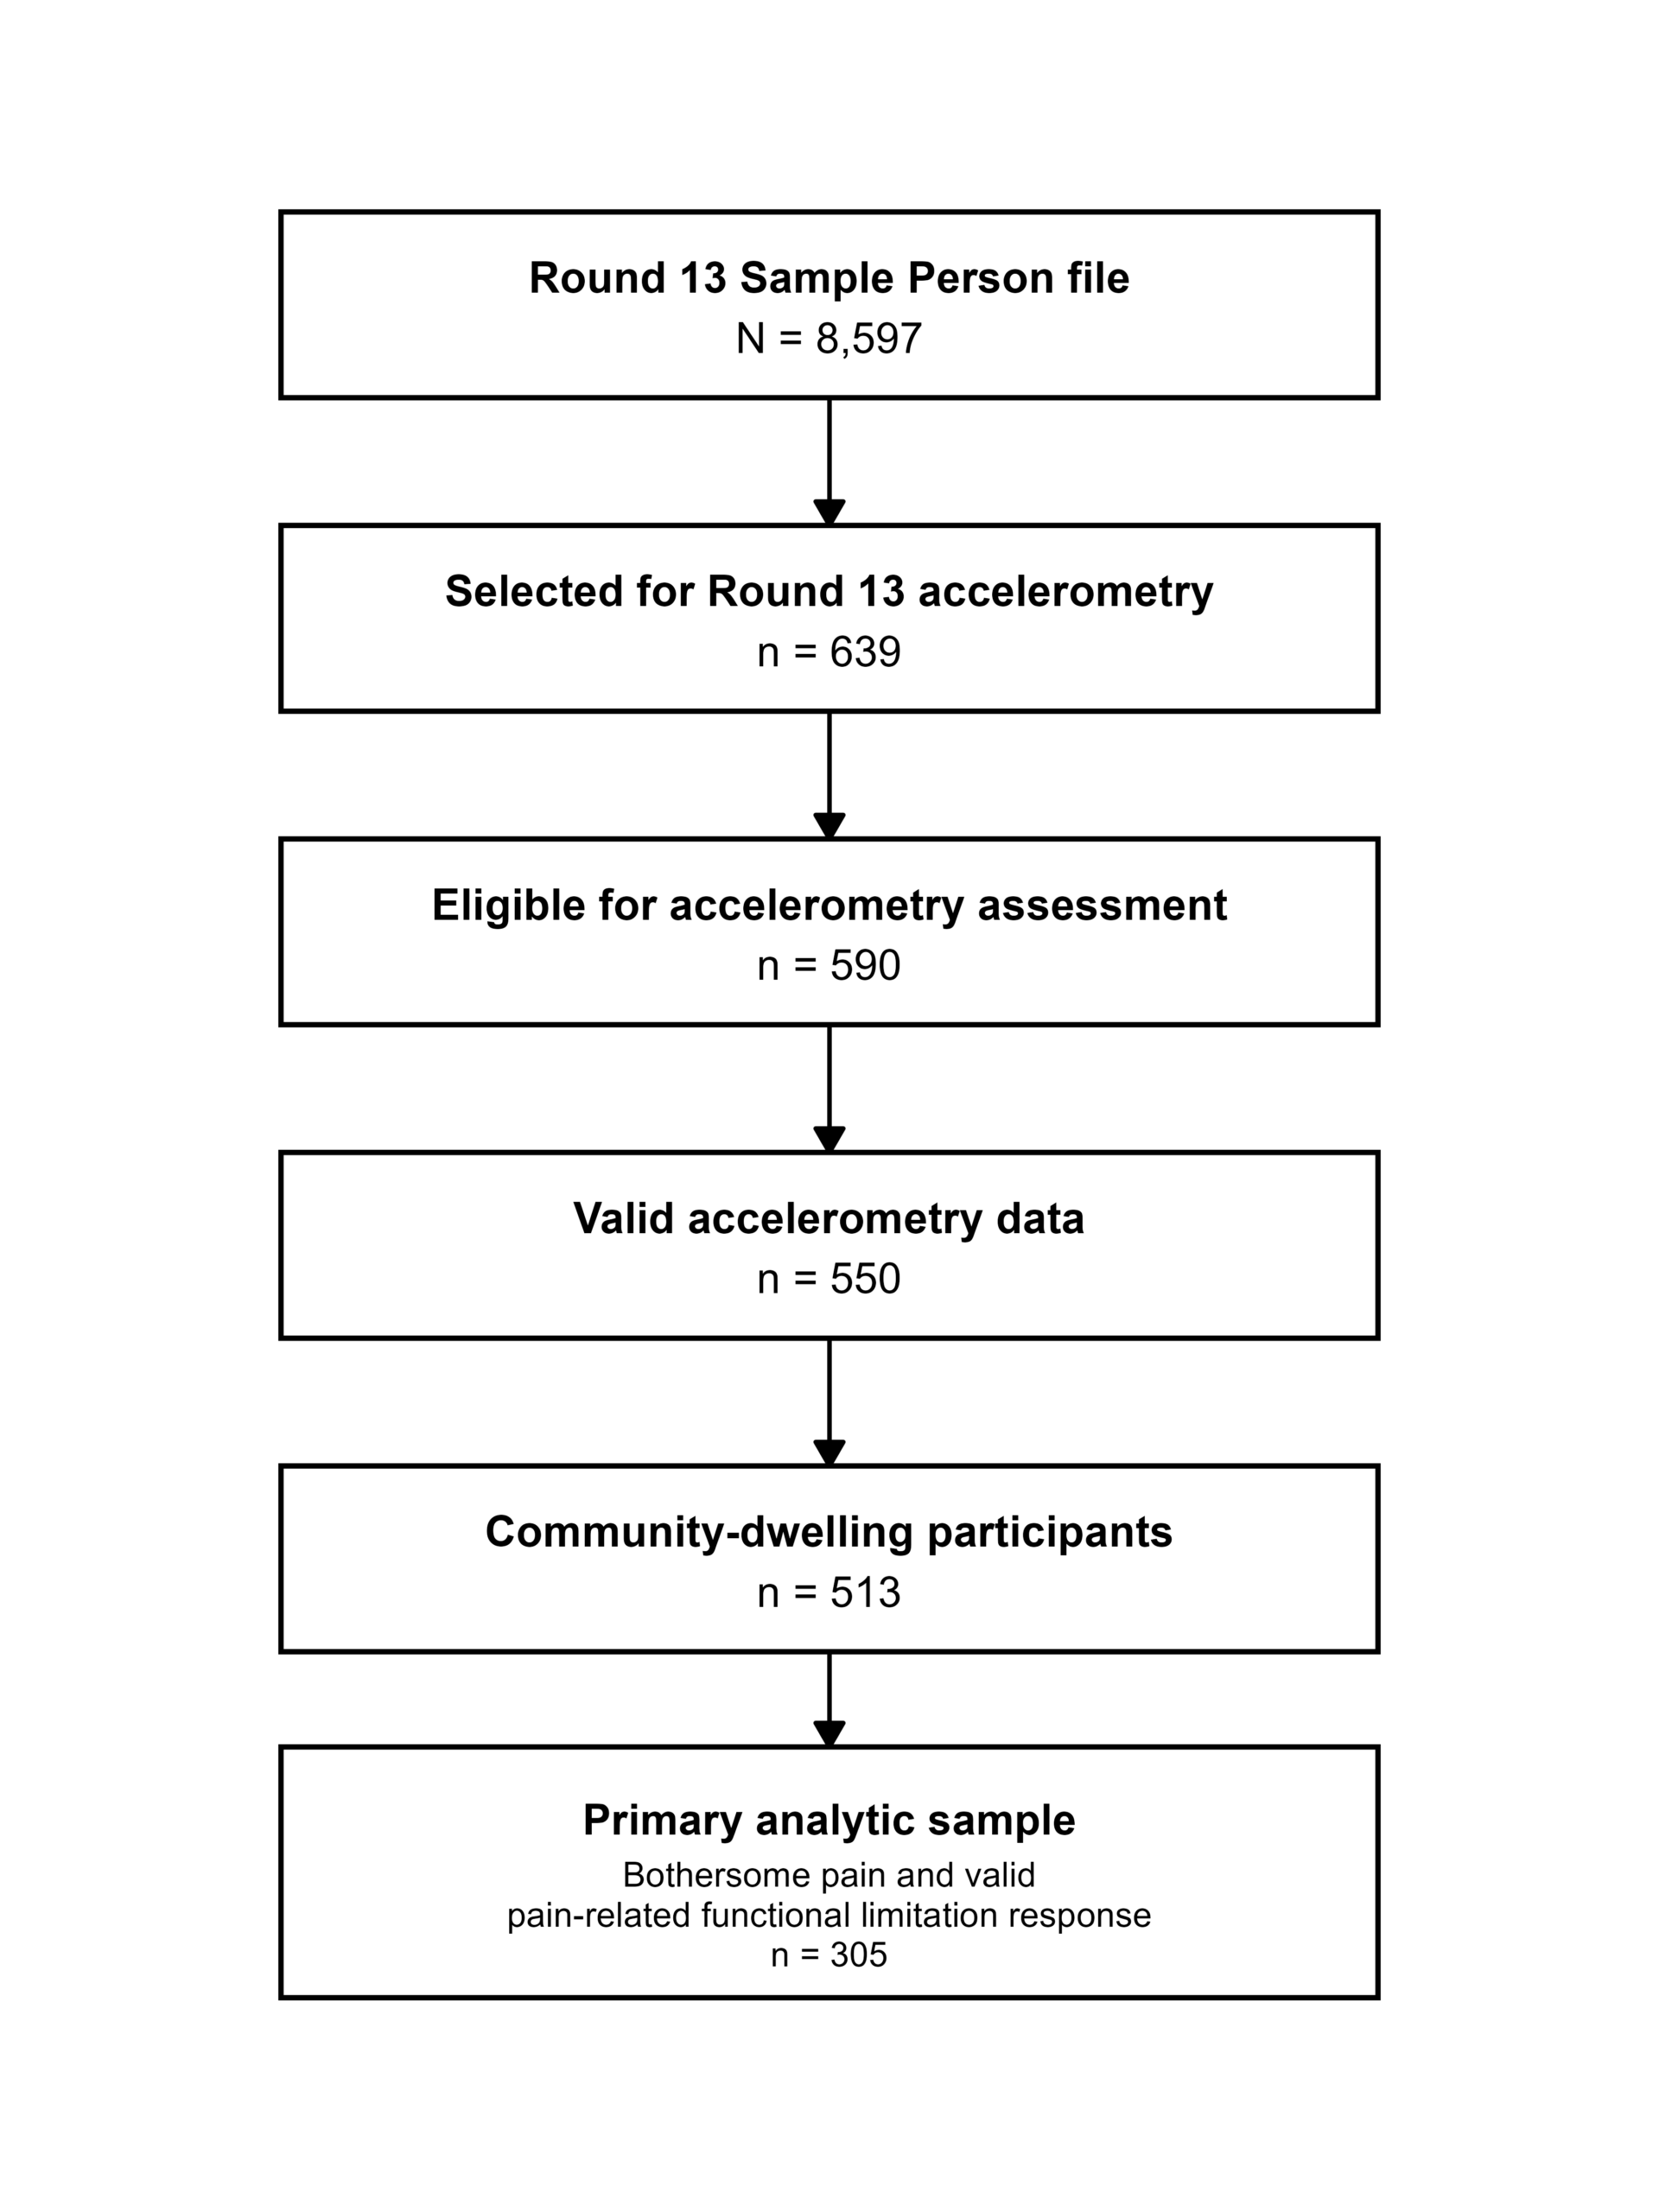
Among 513 community-dwelling participants, 305 reported bothersome pain and all 305 provided valid responses to the pain-related functional limitation item. Figure 1 summarizes participant selection from the 8,597 Round 13 participants to the final analytic sample of 305. Official NHATS documentation was used to obtain counts for accelerometry and eligibility19,21.
Outcome Variable: Pain-Related Functional Limitation
Pain measures were identified from the NHATS Round 13 Sample Person Interview instrument23. Among participants who responded yes to the ss13painbothr, pain-related functional limitation was identified using ss13painlimts, based on the question, “In the last month, has pain ever limited your activities?” This variable was used as the primary outcome and was coded as 1 for yes and 0 for no; refused, unknown, and invalid responses were treated as missing. This outcome reflects whether participants reported that pain limited their activities, rather than the amount or duration of activity they performed.
The pain measures available in NHATS Round 13 are primarily categorical. In addition to bothersome pain and pain-related functional limitation, NHATS includes measures of pain-medication frequency and pain location23, but neither directly reflects the functional impact of pain, and neither provides a general numeric measure of pain intensity. Pain-medication frequency reflects medication use rather than pain severity itself, while pain location identifies where pain occurs rather than how much it interferes with daily activities. Pain-related functional limitation was therefore selected as the binary outcome because it most directly represents the impact of pain on daily functioning.
Exposure Variables: Physical Activity Measurement
Physical activity exposure variables were identified from the NHATS Round 13 Accelerometry Summary File and Accelerometry User Guide. Participants wore a triaxial ActiGraph CentrePoint Insight Watch on the nondominant wrist continuously during the interview and were asked to wear it continuously for the following seven days (8 days total)19. Accelerometry data were processed in one-minute intervals, and a valid day required more than 90% wear time (at least 1,296 minutes). NHATS-derived participant-level summary measures were calculated as averages across valid days.
We assessed physical activity using two accelerometer-derived exposure variables: daily active minutes and total activity counts. These measures quantify movement recorded by the wrist accelerometer but do not identify the type or purpose of the activity or specifically measure structured exercise. Daily active minutes were identified using the NHATS-derived variable ag13dminact, defined as the average number of minutes per day spent above the NHATS threshold of 1,853 activity counts per minute19. For analysis, daily active minutes were divided by 30 so that the estimated odds ratio represented each additional 30 active minutes per day, providing a more interpretable unit for the continuous activity measure. The 30-minute increment was used for scaling and was not treated as an activity cutoff.
Total activity counts were identified using the NHATS-derived variable ag13dltac, the logarithm of the vector magnitude of total activity counts accumulated across the three accelerometer axes19. This measure captures the accumulated movement volume over the monitoring period rather than only the minutes that exceed the active-minute threshold. For analysis, ag13dltac was standardized using the survey-weighted mean and standard deviation so that its odds ratio represented a 1-SD increase in log total activity counts. Because active minutes and log total activity counts were highly correlated, they were modeled separately to avoid including two closely related activity measures in the same model and to estimate the association of each measure independently.
As a secondary measure of physical activity, the NHATS variable pa13evrgowalk, which indicates whether participants self-reported walking for exercise during the previous month, was examined23. This binary measure captures participation in walking for exercise but does not quantify the duration, frequency, or overall volume of physical activity.
Covariates
Covariates were selected from the NHATS Round 13 Sample Person file to account for key demographic, musculoskeletal, and psychological factors that may be related to both physical activity and pain-related functional limitation. Age and sex were included as demographic covariates because both are related to physical activity and functioning in older adults. Arthritis was included because it can affect both mobility and pain-related limitation, while depressive symptoms were included because they may influence physical activity and how pain affects daily function. Age was categorized as 70-74, 75-79, 80-84, 85-89, and 90 years or older, and sex was classified as male or female. Arthritis was coded as present for participants with current or previously reported arthritis according to the NHATS condition-history coding. Depressive symptoms were measured using the Patient Health Questionnaire-2 (PHQ-2), which sums responses to two depressive-symptom items scored from 0 to 3, producing a total score from 0 to 6; the continuous PHQ-2 score was used in the regression models24. These four variables were included in the primary model.
We also included race/ethnicity and education in an expanded model to test whether further adjustment for social and socioeconomic characteristics changed the association between physical activity and pain-related limitation. These variables were not included in the primary model because the accelerometry sample was modest and some race/ethnicity categories contained few participants, which could lead to unstable estimates with additional adjustment.
Statistical Analysis
Descriptive and regression analyses accounted for the survey design of NHATS using the “survey” package in R version 4.6.1. Random forest analyses were conducted separately as described below.
Participant characteristics are presented as unweighted counts by pain-related functional limitation status. Population estimates and regression models used Round 13 accelerometry weights. Variances were estimated using Fay’s modified balanced repeated replication (BRR) method following NHATS guidance25,26. The survey design was first created using the full Round 13 cohort with valid accelerometry data (n=550), and the analytic subpopulation was then specified within this design as community-dwelling participants with bothersome pain and a valid pain-related functional limitation response (n=305). The weights account for unequal selection probabilities and accelerometry nonresponse26.
Associations between physical activity and pain-related functional limitation were estimated using survey-weighted logistic regression. For daily active minutes and log total activity counts, an unadjusted model was estimated first, followed by models with sequential adjustment for potential confounders to show how the estimated association changed as additional covariates were included. The first adjusted model included age and sex; the primary model additionally included arthritis and PHQ-2 score, and the expanded model further included race/ethnicity and education to evaluate whether additional social and socioeconomic adjustment changed the estimated association. Participants with missing covariate data were excluded only from models requiring those covariates. The primary models included all 305 participants, while the expanded models included 297 participants with complete race/ethnicity and education data. The two accelerometer-derived activity measures were modeled separately, and the same four-model sequence was also applied to self-reported walking for exercise. Associations are reported as odds ratios (ORs), 95% confidence intervals (CIs), and p-values. Because the three activity measures are expressed on different scales, their ORs were interpreted separately rather than compared directly.
Linearity of the continuous predictors on the log-odds scale was assessed using nonlinear model specifications. For active minutes and log total activity counts, linear models were compared with 3-df natural cubic spline models using survey-weighted Wald tests. Because PHQ-2 has a limited score range, its functional form was assessed by adding a quadratic term. Sensitivity analyses were performed for log total activity counts to examine the influence of extreme values.
Exploratory Machine-Learning Analysis
As an exploratory analysis, random forest models were used to assess whether physical activity measures improved prediction of pain-related functional limitation beyond age, sex, arthritis, and depressive symptoms. These four covariates were first fit as a core model. Daily active minutes, log total activity counts, and self-reported walking for exercise were then added separately to the core model to evaluate the predictive contribution of each activity measure.
We used five repeats of stratified five-fold cross-validation to evaluate model performance. A random seed of 20260810 was used to generate the randomization. Random forest models were fitted using the “ranger” package as probability forests with 1,000 trees and a minimum node size of 10. NHATS accelerometry weights were incorporated as case weights, and other model parameters were left at their default settings. For each cross-validation fold, model performance was evaluated using predictions from the held-out data. Models containing each physical activity measure were compared with the core covariate model to evaluate whether the added activity measure improved predictive performance. Discrimination was assessed using the area under the receiver operating characteristic curve (AUC), and prediction error was assessed using the Brier score. Higher AUC and lower Brier scores indicated better cross-validated predictive performance among the evaluated models. All machine-learning analyses were conducted in R.
Ethical Considerations/IRB Approval
This study used deidentified NHATS public-use data and reported only aggregate results. NHATS data collection was conducted under Institutional Review Board approval, and participants provided informed consent as part of the original study. The present study involved only secondary analysis of existing deidentified data, with no direct participant contact, collection of identifiable personal information, or attempt to identify any individual. Data were handled according to NHATS conditions of use, and no additional IRB approval was obtained for this secondary analysis.
Results
Study Population Characteristics
Of the 8,597 participants in the Round 13 Sample Person file, 639 were included in the NHATS accelerometry sample, 590 were eligible for accelerometry assessment, and 550 had valid accelerometry data. After restricting the sample to community-dwelling participants, 513 remained. Applying the study criteria of bothersome pain and a valid pain-related functional limitation response resulted in a final analytic sample of 305 participants (Figure 1). Of these, 169 (55.4%) reported pain-related functional limitation and 136 (44.6%) did not. Participants included 172 women and 133 men, and 270 had current or previously reported arthritis. Demographic, clinical, and physical activity characteristics are presented in Table 1.
| Characteristic | Overall (N=305) | No limitation (n=136) | Limitation (n=169) |
| Age group | |||
| 70-74 years | 29 (9.5%) | 11 (8.1%) | 18 (10.7%) |
| 75-79 years | 131 (43.0%) | 65 (47.8%) | 66 (39.1%) |
| 80-84 years | 72 (23.6%) | 28 (20.6%) | 44 (26.0%) |
| 85-89 years | 53 (17.4%) | 26 (19.1%) | 27 (16.0%) |
| 90 years or older | 20 (6.6%) | 6 (4.4%) | 14 (8.3%) |
| Sex | |||
| Male | 133 (43.6%) | 59 (43.4%) | 74 (43.8%) |
| Female | 172 (56.4%) | 77 (56.6%) | 95 (56.2%) |
| Race/ethnicity | |||
| White, non-Hispanic | 252 (82.6%) | 111 (81.6%) | 141 (83.4%) |
| Black, non-Hispanic | 26 (8.5%) | 11 (8.1%) | 15 (8.9%) |
| Hispanic | 16 (5.2%) | 7 (5.1%) | 9 (5.3%) |
| Other, non-Hispanic | 4 (1.3%) | 1 (0.7%) | 3 (1.8%) |
| Missing | 7 (2.3%) | 6 (4.4%) | 1 (0.6%) |
| Education | |||
| Less than high school | 38 (12.5%) | 19 (14.0%) | 19 (11.2%) |
| High school graduate | 82 (26.9%) | 32 (23.5%) | 50 (29.6%) |
| Some college/associate | 86 (28.2%) | 34 (25.0%) | 52 (30.8%) |
| Bachelor’s degree or higher | 91 (29.8%) | 44 (32.4%) | 47 (27.8%) |
| Missing | 8 (2.6%) | 7 (5.1%) | 1 (0.6%) |
| Arthritis | |||
| No | 35 (11.5%) | 21 (15.4%) | 14 (8.3%) |
| Yes | 270 (88.5%) | 115 (84.6%) | 155 (91.7%) |
| PHQ-2 score, mean (SD) | 1.07 (1.36) | 0.71 (1.01) | 1.37 (1.52) |
| Average active minutes/day, weighted mean (95% CI) | 329.0 (315.5-342.5) | 355.9 (337.2-374.6) | 307.9 (291.2-324.6) |
| Log total activity counts, weighted mean (95% CI) | 14.21 (14.16-14.26) | 14.32 (14.26-14.38) | 14.12 (14.05-14.19) |
| Walked for exercise in previous month | |||
| No | 141 (46.2%) | 56 (41.2%) | 85 (50.3%) |
| Yes | 164 (53.8%) | 80 (58.8%) | 84 (49.7%) |
Note. Categorical values are unweighted n (column %). Percentages include missing responses in the denominator, with missing values shown separately where applicable. PHQ-2 values are unweighted mean with SD. Active minutes and log total activity counts are survey-weighted means with 95% CIs using the Round 13 accelerometry weights with Fay-BRR variance estimation. PHQ-2 = Patient Health Questionnaire-2.
Association Between Physical Activity and Pain-Related Functional Limitation
Participants without pain-related functional limitation had a survey-weighted mean of 355.9 active minutes/day (95% CI, 337.2-374.6), compared with 307.9 minutes/day (95% CI, 291.2-324.6) among participants with limitation (Table 1). Descriptively, participants without pain-related functional limitation accumulated approximately 48 more active minutes/day than participants with limitation.
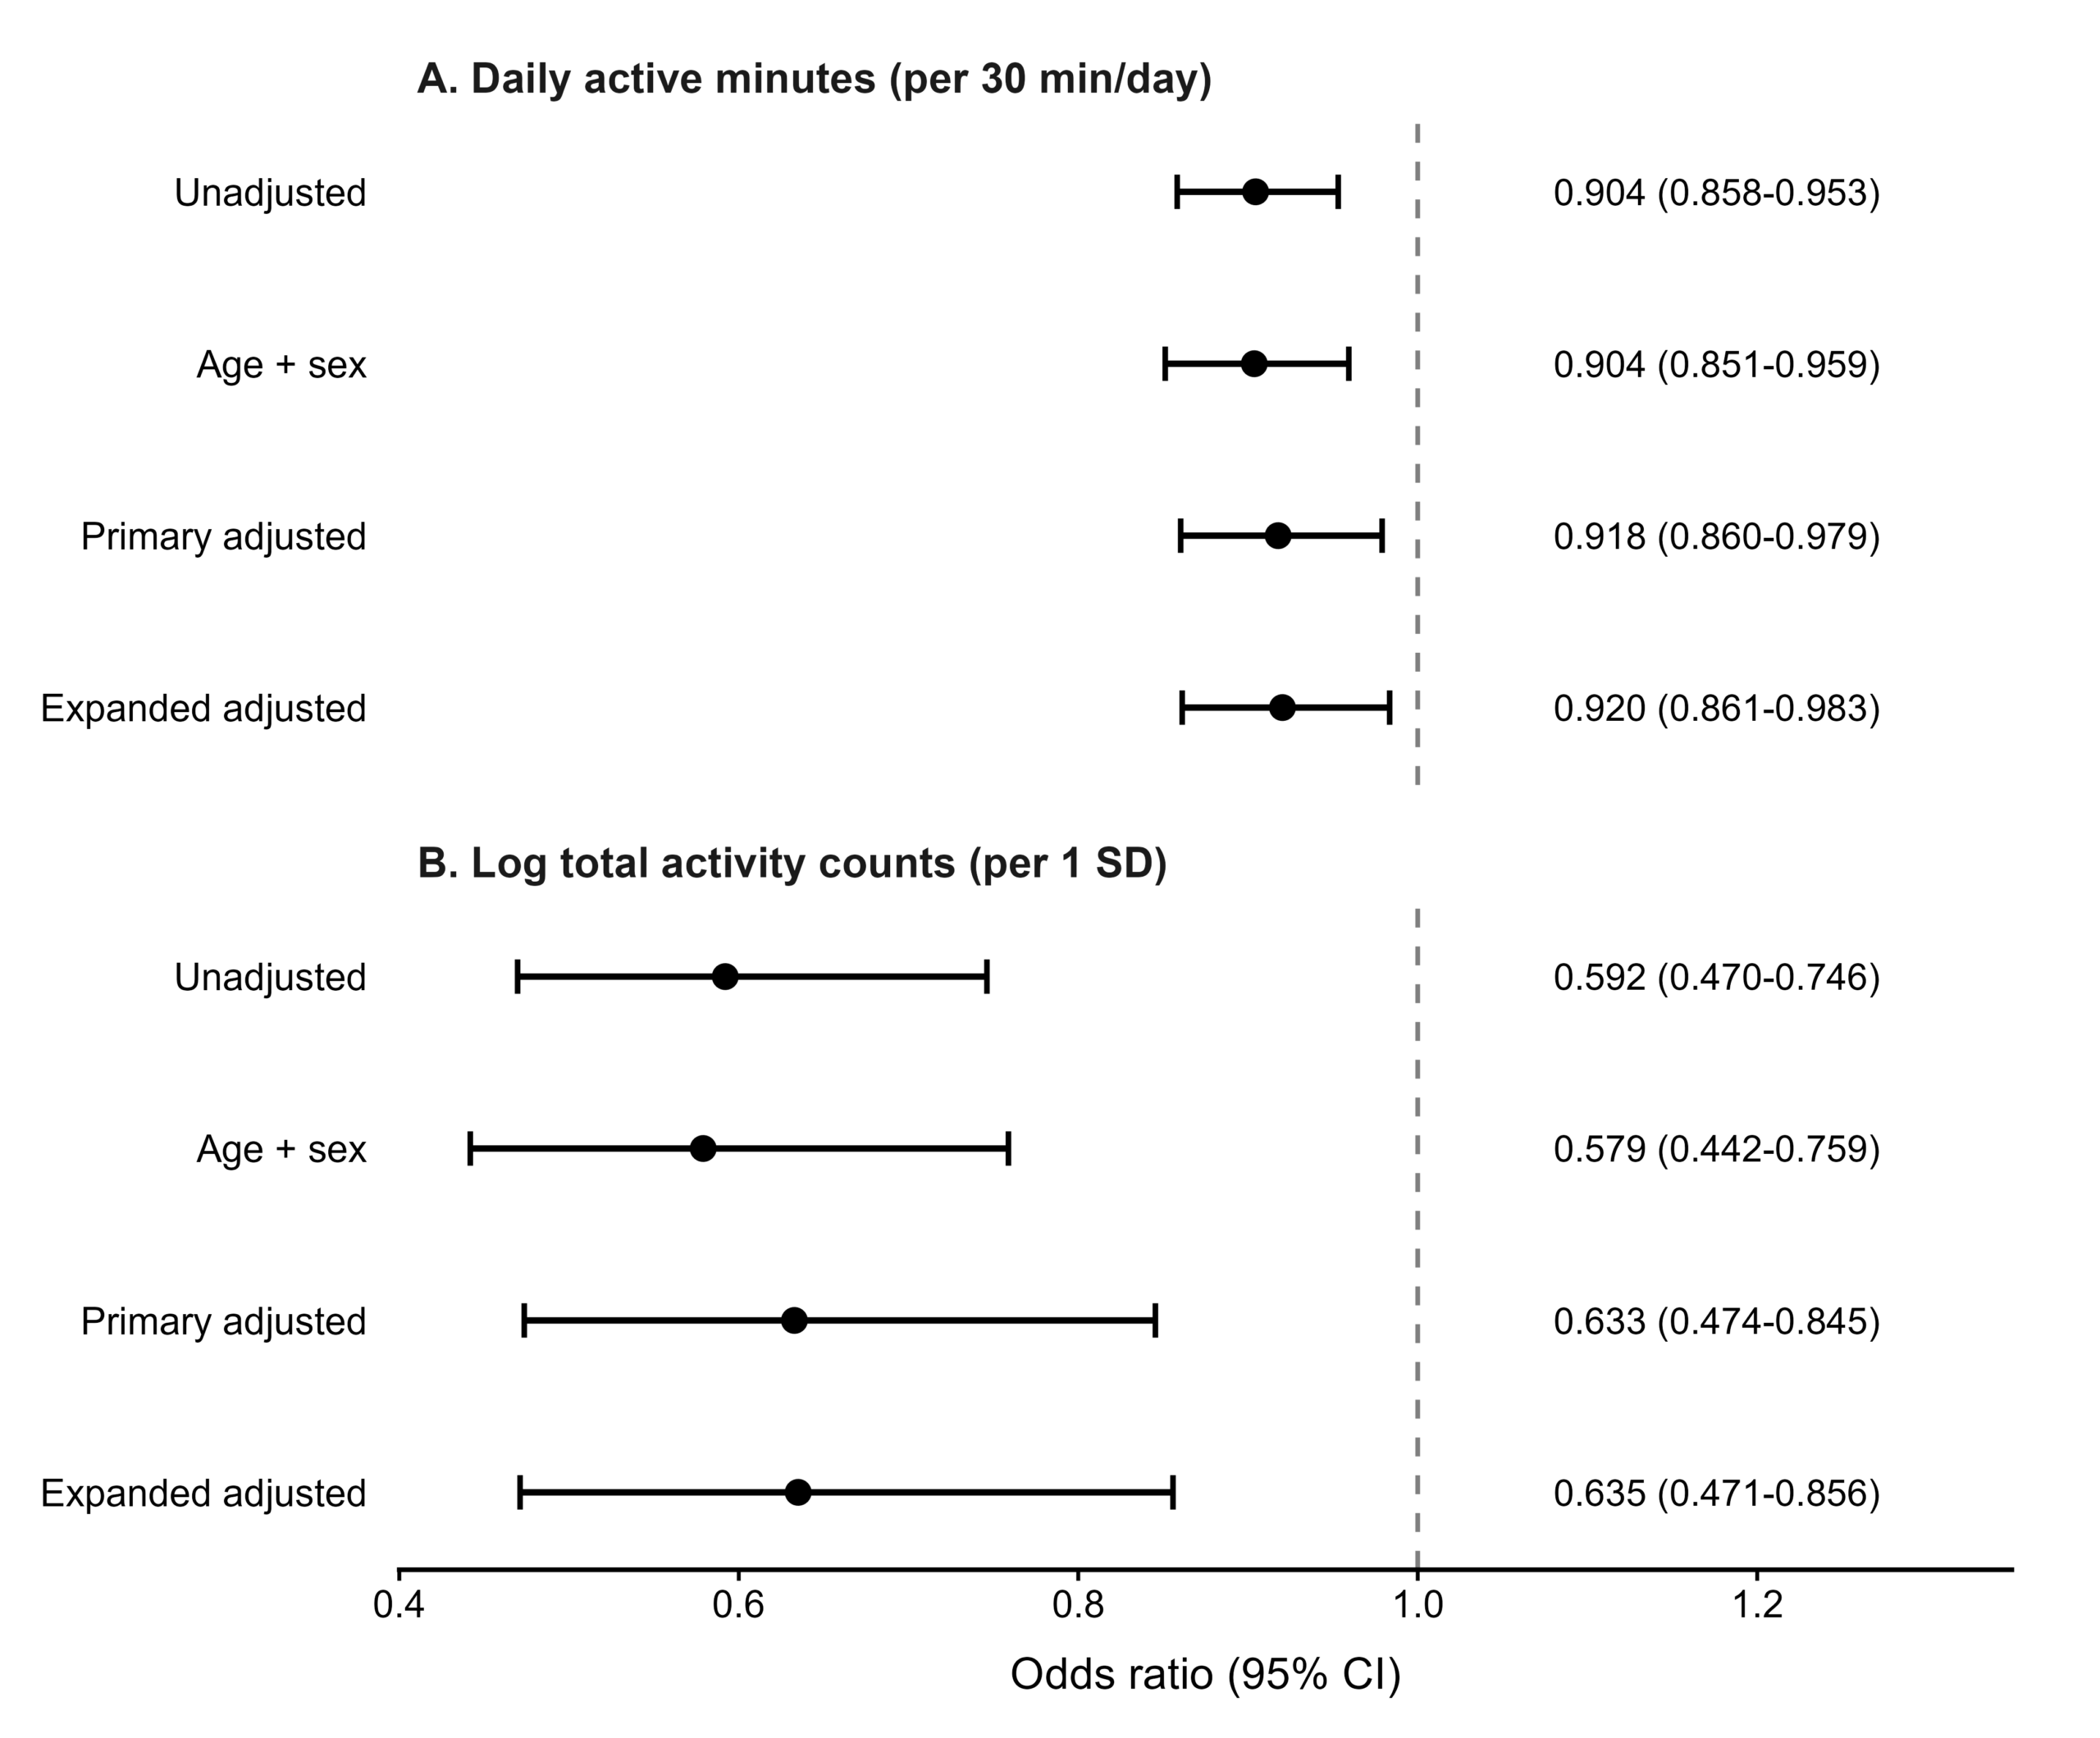
In the unadjusted model, each additional 30 active minutes/day was associated with lower odds of pain-related functional limitation (OR, 0.904; 95% CI, 0.858-0.953; p < 0.001) (Figure 2). The estimate was nearly unchanged after adjustment for age and sex (OR, 0.904; 95% CI, 0.851-0.959; p = 0.001), remained significant in the primary adjusted model which includes age, sex, arthritis, and PHQ-2 as covariates (OR, 0.918; 95% CI, 0.860-0.979; p = 0.010), and was similar in the expanded model that additionally adjusted for race/ethnicity and education (OR, 0.920; 95% CI, 0.861-0.983; p = 0.015).
Total activity counts provided a complementary measure of physical activity based on accumulated movement volume rather than time above an activity threshold. The association was present in the unadjusted model (OR, 0.592; 95% CI, 0.470-0.746; p < 0.001), after adjustment for age and sex (OR, 0.579; 95% CI, 0.442-0.759; p < 0.001), in the primary adjusted model with age, sex, arthritis, and PHQ-2 score (OR, 0.633; 95% CI, 0.474-0.845; p = 0.003), and in the expanded model with additional adjustment for race/ethnicity and education (OR, 0.635; 95% CI, 0.471-0.856; p = 0.004).
There was no evidence of nonlinearity for active minutes (p = 0.200) or PHQ-2 (p > 0.950). Total activity counts were skewed and therefore log-transformed before analysis. In a sensitivity analysis excluding the extreme 1% at each end of the distribution, the spline comparison showed no evidence of nonlinearity (p = 0.129).
Figure 2 visually summarizes the associations of both accelerometer-derived physical activity measures with pain-related functional limitation. Table 2 presents regression estimates across all activity measures and adjustment models.
Self-reported walking for exercise was not significantly associated with pain-related functional limitation in any of the tested models. In the primary adjusted model with age, sex, arthritis, and PHQ-2 score, the OR was 0.907 (95% CI, 0.582-1.415; p = 0.662), and the corresponding estimates across all four models are shown in Table 2.
| Exposure | Model | OR | 95% CI | p | n |
| Daily active minutes, per 30 min/day | Unadjusted | 0.904 | 0.858–0.953 | <0.001 | 305 |
| Age- and sex-adjusted | 0.904 | 0.851–0.959 | 0.001 | 305 | |
| Primary adjusted | 0.918 | 0.860–0.979 | 0.010 | 305 | |
| Expanded adjusted | 0.920 | 0.861–0.983 | 0.015 | 297 | |
| Log total activity counts, per 1 SD | Unadjusted | 0.592 | 0.470–0.746 | <0.001 | 305 |
| Age- and sex-adjusted | 0.579 | 0.442–0.759 | <0.001 | 305 | |
| Primary adjusted | 0.633 | 0.474–0.845 | 0.003 | 305 | |
| Expanded adjusted | 0.635 | 0.471–0.856 | 0.004 | 297 | |
| Walking for exercise, yes vs no | Unadjusted | 0.721 | 0.480–1.083 | 0.113 | 305 |
| Age- and sex-adjusted | 0.745 | 0.485–1.144 | 0.174 | 305 | |
| Primary adjusted | 0.907 | 0.582–1.415 | 0.662 | 305 | |
| Expanded adjusted | 0.927 | 0.554–1.550 | 0.766 | 297 |
Note. Odds ratios for daily active minutes are expressed per 30 additional active minutes/day; odds ratios for log total activity counts are expressed per 1-SD increase; and odds ratios for walking for exercise compare yes versus no. The primary adjusted model included age group, sex, arthritis, and PHQ-2 score. The expanded adjusted model additionally included race/ethnicity and education.
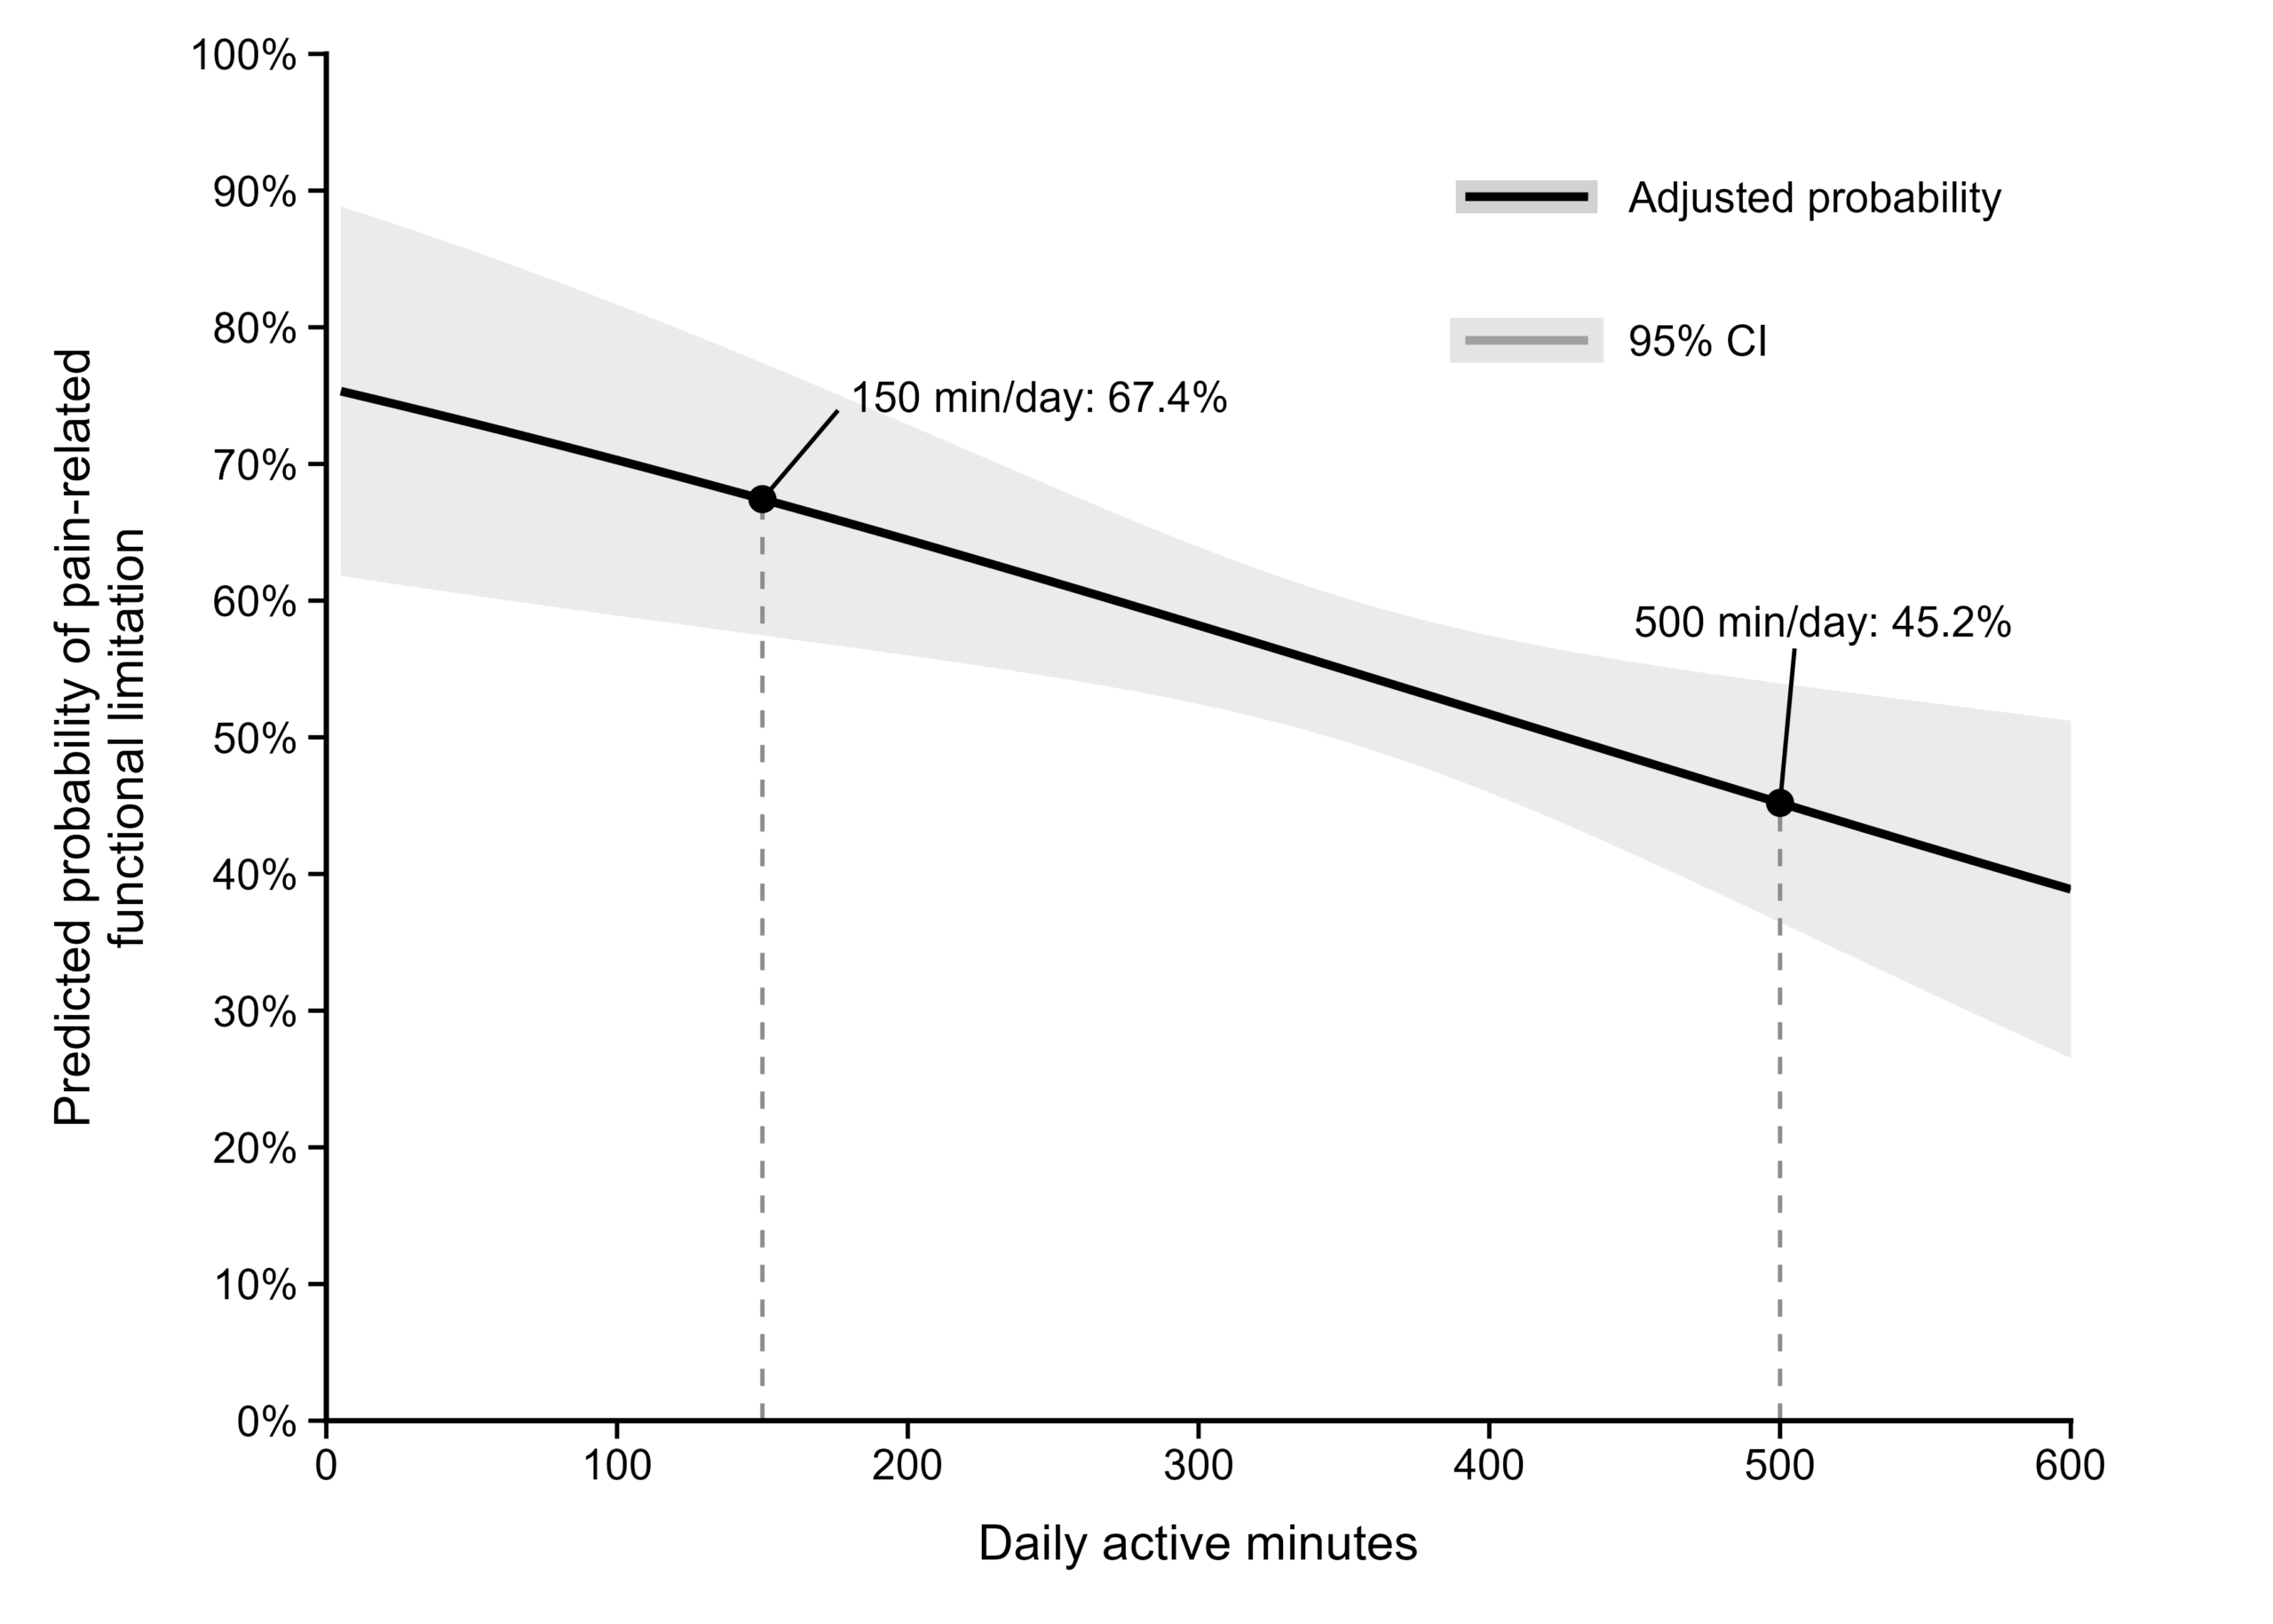
Marginal predicted probabilities were estimated from the primary Fay-BRR survey-weighted logistic regression model adjusted for age, sex, arthritis, and PHQ-2 score. At each level of daily active minutes, predictions were averaged across the analytic sample while retaining participants’ observed covariate values (Figure 3). Model-estimated probabilities of pain-related functional limitation varied across the observed range of daily active minutes, from 67.4% (95% CI, 57.5%-77.4%) at 150 minutes/day to 45.2% (95% CI, 36.5%-53.9%) at 500 minutes/day. This pattern was consistent with the inverse association estimated in the survey-weighted logistic regression model.
Exploratory Machine-Learning Findings
In the exploratory random forest analysis, the model that included log total activity counts in addition to age, sex, arthritis, and PHQ-2 score showed the strongest cross-validated predictive performance, with a mean cross-validated AUC of 0.671 and a mean Brier score of 0.229 (Table 3). In comparison, the reference model including core covariates had a mean cross-validated AUC of 0.615 and a Brier score of 0.242. Adding active minutes resulted in a smaller improvement in discrimination (AUC, 0.637). Model including self-reported walking for exercise did not improve prediction (AUC, 0.573). The model including log total activity counts consistently had the highest AUC and lowest Brier score across all five cross-validation repeats.
| Model | Mean AUC (SD) | Mean ΔAUC (SD) | Mean Brier score (SD) | Mean ΔBrier score (SD) |
| Covariates only | 0.615 (0.016) | Reference | 0.242 (0.005) | Reference |
| Covariates + active minutes | 0.637 (0.016) | +0.022 (0.018) | 0.239 (0.005) | −0.002 (0.006) |
| Covariates + log total activity counts | 0.671 (0.012) | +0.056 (0.017) | 0.229 (0.005) | −0.013 (0.006) |
| Covariates + walk for exercise | 0.573 (0.019) | −0.042 (0.009) | 0.252 (0.005) | +0.010 (0.001) |
Note. The core covariate model included age group, sex, arthritis, and PHQ-2 score. Performance values are means across five repeats of stratified five-fold cross-validation. NHATS accelerometry weights were incorporated during model training and metric calculation. Higher AUC indicates better discrimination, whereas lower Brier score indicates lower prediction error within the evaluated models. AUC = area under the receiver operating characteristic curve; PHQ-2 = Patient Health Questionnaire-2.
Discussion
Using cross sectional statistical modeling on a national health and aging survey dataset, our study found a consistent association between objectively measured physical activity and pain-related functional limitation among community-dwelling older adults experiencing bothersome pain. Descriptively, participants without limitation accumulated about 48 more active minutes per day than those with limitation (Table 1). After adjustment for age, sex, arthritis, and depressive symptoms, each additional 30 active minutes/day was still associated with pain-related functional limitation. Log total activity counts showed a similar pattern (Figure 2). Consistent with the regression estimates, the adjusted marginal predicted probabilities differed across the observed activity range, from 67.4% at 150 active minutes/day to 45.2% at 500 minutes/day (Figure 3). The similar findings for active minutes and total activity counts indicate that both time spent active and the overall amount of daily movement are related to pain-related functional limitation.
The association between lower physical activity and greater pain-related functional limitation in our study is directionally consistent with previous studies reporting lower activity or altered activity patterns among older adults with pain. The present analysis focused specifically on older adults who reported bothersome pain and examined differences in pain-related functional limitation within this population. A systematic review found that older adults with chronic musculoskeletal pain were less physically active than those without pain7, and Cai et al.9 reported nominally fewer accelerometer-measured active minutes in groups with unilateral knee pain, although the association did not remain significant after correction for multiple testing. One possible explanation is that pain or fear of pain may discourage movement, consistent with studies linking kinesiophobia and fear avoidance to lower physical activity and poorer function in older adults with chronic pain5,6. However, the available NHATS measures did not provide a direct pain-specific measure of kinesiophobia or fear-avoidance. Therefore this potential mechanism was not directly evaluated in the present study.
At the same time, our association with total activity counts indicates that overall movement volume, not only time above an activity threshold, may be relevant to pain-related limitation. This interpretation is supported by prior device-based studies showing associations of pain with different features of daily activity. Fan et al.10 reported site-specific associations involving sedentary time and activity fragmentation, Fanning et al.11 found that changes in some activity intensities and bout durations were associated with changes in pain intensity or interference, and Lager et al.12 found an association between higher pain intensity and a more sedentary pattern. Among older adults with knee osteoarthritis, combined bilateral knee and low-back pain was associated with more sedentary time and less light physical activity, while associations differed across other activity measures27. In the Multicenter Osteoarthritis Study, greater peripheral and central pain sensitivity was associated with fewer objectively measured daily steps, while associations differed across other activity measures28. Among community-dwelling older adults with chronic multisite pain, baseline back pain was associated with lower total activity counts, fewer active minutes, greater activity fragmentation, and lower afternoon and evening activity29. Among community-dwelling older adults with chronic knee or low-back pain, physical activity below study-defined cutoffs for daily steps and moderate-to-vigorous activity was associated with a higher risk of later functional disability30. Other device-based studies have also linked physical activity patterns with physical function in older adults, including WOMAC physical function, gait speed, and later performance-based functional limitation31,32,33. A recent NHATS study found that higher total activity counts and more active minutes were associated with lower odds of physical function decline over one year34. In contrast to studies comparing people with and without pain or examining pain characteristics across broader populations, this study focused on older adults already experiencing bothersome pain. Within this group, both accelerometer measures of daily movement were associated with pain-related functional limitation.
Pain-related functional limitation and objectively measured physical activity are related, but they are not the same measure. The NHATS question asks whether pain limited a participant’s activities, while the accelerometer measures how much the participant actually moved. A participant may report that pain limited their activities and still remain relatively active, or may move very little for reasons unrelated to pain. Therefore, the association reflects a relationship between two related but different measures: pain-related functional limitation and objectively measured movement.
The accelerometer-derived measures and self-reported walking for exercise capture different aspects of physical activity. Empirical comparisons in older adults have also shown incomplete agreement between self-reported and device-measured physical activity35,36. Self-reported physical activity measures in older adults can be affected by measurement and reporting errors18. In our study, the binary walking-for-exercise measure was not associated with pain-related functional limitation, whereas both continuous accelerometer-derived measures were associated with this outcome. Liu et al.17, using NHATS self-reported walking and vigorous activity, did not find a clear association with subsequent pain occurrence or persistent pain. Although Liu et al.’s study and ours differed in outcome, study design, time period, and physical activity measurement, our study did not show evidence that self-reported walking for exercise was associated with pain-related functional limitation, while both accelerometer measures were associated with the outcome.
The NHATS walking question only asks whether a participant walked for exercise during the previous month and does not measure duration, frequency, or movement from other daily activities. In contrast, the accelerometer measures provide continuous, quantitative measurement of movement during the monitoring period and capture activity beyond intentional exercise. They also do not rely on participants remembering or deciding what counts as exercise. Therefore, the different results may reflect the way the measures were collected and the different aspects of physical activity they capture.
The exploratory machine-learning results showed a similar pattern. Adding log total activity counts improved prediction compared with the covariate-only model, increasing the AUC from 0.615 to 0.671 and lowering the Brier score from 0.242 to 0.229. The higher AUC indicates better ability to distinguish participants with and without pain-related functional limitation, while the lower Brier score indicates more accurate predicted probabilities among the evaluated models. Adding active minutes led to a smaller improvement in discrimination (AUC, 0.637), while self-reported walking did not improve prediction (AUC, 0.573). These results were consistent with the regression analyses and similarly showed that the continuous accelerometer measures and binary walking-for-exercise item provided different information about physical activity.
Several features strengthen this study. Physical activity was measured objectively using seven-day wrist accelerometry rather than relying only on self-report. Daily active minutes and total activity counts captured different aspects of movement, including active time and total movement volume. Our analysis also used NHATS population-based data and incorporated the Round 13 accelerometry full-sample and replicate weights with Fay-BRR variance estimation. In addition, the study focused on community-dwelling older adults with bothersome pain. Examining both accelerometer-derived activity and self-reported walking allowed different dimensions of physical activity to be considered.
This study also has several limitations. Because the primary analysis used pain-related functional limitation reported for the preceding month and accelerometer-measured activity collected starting at the interview, the temporal direction of the association cannot be determined. In particular, reverse causation is plausible. Older adults who experienced activity-limiting pain may have moved less during the accelerometer monitoring period. Conversely, differences in physical activity may have contributed to differences in functional limitation. These findings should therefore be interpreted as an association between pain-related functional limitation and objectively-measured movement, instead of evidence for causation. Longitudinal research also suggests that this relationship may operate in more than one direction. Balogun et al. found that when participants were more physically active than their usual level, they reported less knee pain and functional limitation, while greater-than-usual functional limitation was also associated with lower physical activity37. Other longitudinal osteoarthritis studies also suggest a complex relationship: worsening symptoms were accompanied by larger declines in accelerometer-measured activity over two years, while greater baseline activity did not consistently predict improvement in pain or physical function over one year38,39. Shorter-term findings may also differ from longer-term patterns: Davis et al. found that greater recent step counts were associated with subsequent pain, while pain was not associated with subsequent stepping40. A 90-day smartwatch study similarly found that higher step counts were associated with slightly higher same- and next-day knee pain at the group level, while individual associations varied in strength and direction41. Residual confounding by other health, mobility, psychological, or environmental factors remains possible. Pain-related functional limitation was measured with a single yes/no NHATS question, and NHATS does not include a detailed numeric measure of pain intensity or severity for this analysis. Therefore, whether physical activity differed by pain severity or type could not be examined. Accelerometry was also collected over a limited period and may not reflect participants’ usual activity over longer periods. In addition, excluding participants living in residential-care settings limits the target population to community-dwelling older adults with bothersome pain, so the findings may not generalize to older adults living in residential care.
Future longitudinal studies could use repeated measures of physical activity and more detailed measures of pain intensity and interference to examine whether objectively measured physical activity predicts subsequent pain-related functional limitation and whether prior limitation predicts later changes in movement. Intervention studies would be needed to determine whether increasing physical activity affects pain-related limitations in older adults.
In conclusion, among community-dwelling older adults with bothersome pain, objectively measured physical activity was associated with pain-related functional limitation across both active minutes and total activity counts. The similar findings across the two accelerometer-derived measures support the value of objective, quantitative measurement of free-living physical activity for studying pain-related functional limitation in older adults. These results describe an association between movement and pain-related functional limitation, but they do not establish a direction of the relationship.
Acknowledgments
The author received no external funding for this study. Data were obtained from the National Health and Aging Trends Study (NHATS), which is sponsored by the National Institute on Aging and the Office of Behavioral and Social Sciences Research (grant U01AG032947). The author thanks Drs. Yi Wang, Yun Guan, and Sharon Liang for their guidance and thoughtful feedback throughout the development of this research.
ChatGPT (OpenAI) was used to assist with R code development and debugging, literature searching, and citation preparation. The author retained full responsibility for the writing of the manuscript and independently verified all analyses, sources, interpretations, and final content.
References
- E. S. Amaral Gomes, K. A. Ramsey, A. G. M. Rojer, E. M. Reijnierse, A. B. Maier. The association of objectively measured physical activity and sedentary behavior with (instrumental) activities of daily living in community-dwelling older adults: a systematic review. Clinical Interventions in Aging 16, 1877–1915 (2021). [↩]
- J. W. Lucas, I. Sohi. Chronic pain and high-impact chronic pain in U.S. adults, 2023. NCHS Data Brief 518 (2024). [↩]
- K. V. Patel, J. M. Guralnik, E. J. Dansie, D. C. Turk. Prevalence and impact of pain among older adults in the United States: findings from the 2011 National Health and Aging Trends Study. Pain 154, 2649–2657 (2013). [↩]
- K. V. Patel, E. A. Phelan, S. G. Leveille, S. E. Lamb, C. Missikpode, R. B. Wallace, J. M. Guralnik, D. C. Turk. High prevalence of falls, fear of falling, and impaired balance in older adults with pain in the United States: findings from the 2011 National Health and Aging Trends Study. Journal of the American Geriatrics Society 62, 1844–1852 (2014). [↩]
- V. Alpalhão, N. Cordeiro, P. Pezarat-Correia. Kinesiophobia and fear avoidance in older adults: a scoping review on the state of research activity. Journal of Aging and Physical Activity 30, 1075–1084 (2022). [↩] [↩]
- C. Larsson, E. Ekvall Hansson, K. Sundquist, U. Jakobsson. Impact of pain characteristics and fear-avoidance beliefs on physical activity levels among older adults with chronic pain: a population-based, longitudinal study. BMC Geriatrics 16, 50 (2016). [↩] [↩]
- B. Stubbs, T. T. Binnekade, A. Soundy, P. Schofield, I. P. J. Huijnen, L. H. P. Eggermont. Are older adults with chronic musculoskeletal pain less active than older adults without pain? A systematic review and meta-analysis. Pain Medicine 14, 1316–1331 (2013). [↩] [↩]
- S. Murata, T. Doi, R. Sawa, R. Nakamura, T. Isa, A. Ebina, Y. Kondo, Y. Tsuboi, K. Torizawa, A. Fukuta, R. Ono. Association between objectively measured physical activity and the number of chronic musculoskeletal pain sites in community-dwelling older adults. Pain Medicine 20, 717–723 (2019). [↩]
- Y. Cai, F. Liu, A. A. Wanigatunga, J. K. Urbanek, E. M. Simonsick, L. Ferrucci, J. A. Schrack. Musculoskeletal pain characteristics and objectively measured physical activity in older adults. The Journals of Gerontology: Series A 79, glae039 (2024). [↩] [↩]
- L. Fan, J. Zhao, X. Wang, Y. Luo, F. Li, C. Li, S. Liu, Y. Yang, T. Lin, F. Wang. Site-specific pain dynamics: associations between accelerometer-measured physical activity patterns and pain in older adults. The Journal of Headache and Pain 26, 287 (2025). [↩] [↩]
- J. Fanning, A. K. Brooks, J. T. Robison, M. B. Irby, S. Ford, K. N’Dah, W. J. Rejeski. Associations between patterns of physical activity, pain intensity, and interference among older adults with chronic pain: a secondary analysis of two randomized controlled trials. Frontiers in Aging 4, 1216942 (2023). [↩] [↩]
- C. Lager, A. Dove, D. Rizzuto, J. Ars, A.-M. Boström, A. Calderón Larrañaga, A.-K. Welmer. Pain and its association with device-measured activity patterns in older adults: age and sex differences in a population-based cross-sectional study. European Review of Aging and Physical Activity 23, 22 (2026). [↩] [↩]
- H. Sakakima, S. Takada, K. Norimatsu, S. Otsuka, K. Nakanishi, A. Tani. Diurnal profiles of locomotive and household activities using an accelerometer in community-dwelling older adults with musculoskeletal disorders: a cross-sectional survey. International Journal of Environmental Research and Public Health 17, 5337 (2020). [↩]
- Z. Yin, S. Li, W. M. Land, S. L. Ullevig, F. Juarez Jr, A. E. Hernández, C. Ortega, N. K. Patel, M. J. Simmonds. Higher levels of physical activity buffered the negative effect of pain severity on physical frailty in older Latinx adults. Geriatric Nursing 42, 460–466 (2021). [↩]
- C. Chen, T. Saito, L. Wang, T. Yokote, H. Yatsugi, X. Liu, H. Kishimoto. The relationships among chronic pain subtypes, motor function, and physical activity in community-dwelling Japanese older adults: a cross-sectional study. American Journal of Health Promotion 38, 1112–1120 (2024). [↩]
- Y. Koren, S. Kim, Q. Song, S. Leveille. Physical activity, social participation, and pain outcomes among community-dwelling older adults. Pain Management Nursing 25, 137–144 (2024). [↩]
- B. Liu, C. Yang, M. Mazumdar, M. Aldridge, R. S. Morrison, L. Li. Do physical activities prevent the occurrence of bothersome pain? Journal of Applied Gerontology 44, 1691–1700 (2025). [↩] [↩]
- M. C. Sattler, J. Jaunig, C. Tösch, E. D. Watson, L. B. Mokkink, P. Dietz, M. N. M. van Poppel. Current evidence of measurement properties of physical activity questionnaires for older adults: an updated systematic review. Sports Medicine 50, 1271–1315 (2020). [↩] [↩]
- J. A. Schrack, M. E. Skehan, V. A. Freedman. National Health and Aging Trends Study Accelerometry User Guide: Rounds 11-14 (2025). [↩] [↩] [↩] [↩] [↩] [↩] [↩]
- V. A. Freedman, J. A. Schrack, M. E. Skehan. National Health and Aging Trends Study User Guide: Rounds 1-14 Final Release, Updated May 2026 (2026). [↩] [↩]
- National Health and Aging Trends Study. NHATS Round 13 Final Release (Version 2) [Data set] (2026). [↩] [↩]
- V. A. Freedman, J. D. Kasper. Cohort profile: The National Health and Aging Trends Study (NHATS). International Journal of Epidemiology 48, 1044–1045g (2019). [↩]
- National Health and Aging Trends Study. NHATS Round 13 Data Collection Instrument (2024). [↩] [↩] [↩]
- K. Kroenke, R. L. Spitzer, J. B. W. Williams. The Patient Health Questionnaire-2: validity of a two-item depression screener. Medical Care 41, 1284–1292 (2003). [↩]
- V. A. Freedman, M. Hu. Accounting for sample design in NHATS analyses: frequently asked questions. NHATS Technical Paper #55 (2025). [↩]
- R. Jiao, V. A. Freedman, J. A. Schrack. National Health and Aging Trends Study development of Round 13 accelerometry weights. NHATS Technical Paper #48 (2024). [↩] [↩]
- T. Oka, R. Ono, Y. Tsuboi, O. Wada, T. Kaga, Y. Tamura, K. Mizuno. Association of objectively measured physical activity with combined bilateral knee and low-back pain in older adults with knee osteoarthritis: a cross-sectional study. Physical Therapy Research 24, 17–23 (2021). [↩]
- S. Lee, T. Neogi, B. McGinley, N. Wang, L. Frey Law, K. A. Torabian, K. Aoyagi, J. J. Stefanik, L. C. Carlesso, J. M. Hausdorff, E. Gazit, N. A. Segal, C. E. Lewis, M. C. Nevitt, D. Kumar. Associations of pain sensitivity and conditioned pain modulation with physical activity: findings from the Multicenter Osteoarthritis Study (MOST). Osteoarthritis and Cartilage 32, 982–989 (2024). [↩]
- Y. Cai, M. Mosslemi, P. W. Scott, J. Hooker, S. Holena, A. C. Barney. Ecological momentary pain and physical activity volume and patterns in older adults with chronic multisite pain. BMC Geriatrics (2026). [↩]
- K. Makino, S. Lee, S. Lee, S. Bae, S. Jung, Y. Shinkai, H. Shimada. Daily physical activity and functional disability incidence in community-dwelling older adults with chronic pain: a prospective cohort study. Pain Medicine 20, 1702–1710 (2019). [↩]
- T. Beauchamp, L. Arbeeva, R. J. Cleveland, Y. M. Golightly, D. P. Hales, D. G. Hu, K. D. Allen. Accelerometer-based physical activity patterns and associations with outcomes among individuals with osteoarthritis. Journal of Clinical Rheumatology 28, e415–e421 (2022). [↩]
- A. A. Wanigatunga, F. Liu, J. K. Urbanek, H. Wang, J. Di, V. Zipunnikov, Y. Cai, R. J. Dougherty, E. M. Simonsick, L. Ferrucci, J. A. Schrack. Wrist-worn accelerometry, aging, and gait speed in the Baltimore Longitudinal Study of Aging. Journal of Aging and Physical Activity 31, 408–416 (2023). [↩]
- H. Master, L. M. Thoma, D. D. Dunlop, M. B. Christiansen, D. Voinier, D. K. White. Joint association of moderate-to-vigorous intensity physical activity and sedentary behavior with incident functional limitation: data from the Osteoarthritis Initiative. Journal of Rheumatology 48, 1458–1464 (2021). [↩]
- L. Fan, J. Zhao, J. Wang, X. Zhou, X. Wang, S. Liu, F. Wang, Q. Wei, T. Lin. Accelerometer-measured multidimensional physical activity patterns and physical functional decline: a prospective national cohort study of aging. The Journals of Gerontology: Series A 80, glaf158 (2025). [↩]
- V. M. Vetter, D. D. Özince, J. Kiselev, S. Düzel, I. Demuth. Self-reported and accelerometer-based assessment of physical activity in older adults: results from the Berlin Aging Study II. Scientific Reports 13, 10047 (2023). [↩]
- T. Shimoda, K. Tomida, C. Nakajima, A. Kawakami, H. Shimada. Combined self-reported and device-measured physical activity assessment and disability incidence in older adults. Journal of the American Medical Directors Association 26, 105375 (2025). [↩]
- S. Balogun, D. Scott, F. Cicuttini, G. Jones, D. Aitken. Longitudinal study of the relationship between physical activity and knee pain and functional limitation in community-dwelling older adults. Archives of Gerontology and Geriatrics 90, 104101 (2020). [↩]
- J. Kushioka, R. Sun, M. Smuck. Temporal patterns of wearable accelerometer-measured physical activity and symptom worsening in knee osteoarthritis: a 2-year longitudinal study from the Osteoarthritis Initiative. Sensors 26, 982 (2026). [↩]
- S.-H. Liu, J. B. Driban, C. B. Eaton, T. E. McAlindon, L. R. Harrold, K. L. Lapane. Objectively measured physical activity and symptoms change in knee osteoarthritis. The American Journal of Medicine 129, 497–505.e1 (2016). [↩]
- T. J. Davis, D. J. Hevel, G. F. Dunton, J. P. Maher. Bidirectional associations between physical activity and pain among older adults: an ecological momentary assessment study. Journal of Aging and Physical Activity 31, 240–248 (2023). [↩]
- A. E. Olanrewaju, M. J. Parkes, J. C. Sergeant, E. Pritchard, S. Shao, S. R. Filbay, S. N. van der Veer, D. Wong, W. G. Dixon. Exploring the bidirectional temporal association between daily knee pain and physical activity in people with knee osteoarthritis: an exploratory smartwatch study. Osteoarthritis and Cartilage Open 8, 100753 (2026). [↩]