Abstract
In this research, the effects of the geometry of the nose cone on the aerodynamic and thermal performance of the rocket as well as other aerospace vehicles have been explored. Various geometries have been considered ranging from smooth nose cones, blunt nose cones, elliptical nose cones, conical nose cones to those that include dimple, spike, and coolant jet among others. Aerodynamics have been studied using the drag coefficient as well as drag force while thermal performance has been determined using heat flux as well as heat transfer coefficient. It has been found that the geometry of the nose cone plays an important role in determining the flow behavior, shock waves, and distribution of heat on the surface of the nose cone. In particular, smooth or slender nose cones reduce the drag at low velocities, and blunted or shock wave shaping nose cones reduce heating at high velocities. Other features increase the efficiency of nose cones by changing the boundary layer or shock wave patterns. This literature review summarizes previous researches conducted on the effect of nose cone geometry and thermal performance categorized according to velocity ranges. While some of the features have been fairly well explored experimentally, lack of experimental data for subsonic nose cones makes conclusions for this range more difficult.
Keywords: Nose Cone, Hypersonic, Supersonic, Subsonic, Aerodynamic Performance, Thermal Performance, Rocket
Introduction
Rockets are crucial in modern society. They enable satellite communication, space exploration, and scientific research, among other applications1. There are many types of rockets, each with its own distinct usage. Supersonic rockets, such as missiles and space rockets, are designed to achieve extreme speeds and withstand harsh flight conditions. Subsonic rockets, which travel slower than the speed of sound, are used for research activities and testing new rocket components.
Drag is one of the main factors that affects rocket flight. It is the force that acts opposite a rocket’s flight path2. Drag is influenced by several variables, including the air density and the object’s velocity, shape, and area. The friction between a rocket’s surface and the air around it creates air resistance as the rocket moves through the air. At higher speeds, shock waves contribute to drag, because at certain points, high-speed air converts its kinetic energy into thermal energy, increasing the temperature of the rocket’s nose cone3. This can melt and deform the nose cone’s material, changing its surface area and therefore drag.
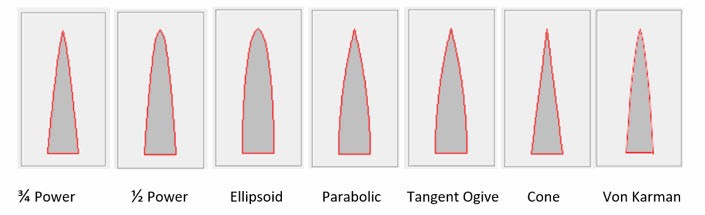
Designing a rocket properly can help reduce drag. A basic framework for a rocket includes the nose cone, fuselage, engine, and payload. The nose cone is located at the anterior of the rocket, and helps reduce parasite drag as the rocket flies through the atmosphere. A rocket can create better acceleration using the same engine system when there is less drag. The nose cone reduces drag by streamlining the airflow around the rocket. Additionally, it has a key role in the rocket’s stability during its ascent. Stable flight can be understood as the ability of the rocket to maintain its orientation and trajectory, even while the conditions of the atmosphere surrounding it, like wind speed and direction, are constantly varying. For these reasons, the proper design of a nose cone is critical to the performance of the rocket. A few diagrams of the most common nose cone designs are shown below:
To understand the basics of nose cone design, it is necessary to consider the evolution of such designs through history. The first rocket scientists used easy-to-produce shapes like hemispheres and cones for their relatively good performance at low speed. During the 1940s and 1950s, as rockets were reaching the Mach speed range, such shapes displayed higher drag due to the appearance of shock waves around their tips. For this reason, rocket scientists started to use more streamlined shapes like ellipses and ogives5.
Even though nose cone designs have improved greatly over the years, many crucial questions are left unanswered regarding its influence on aerodynamic and thermal performance across the various flight regimes. This review seeks to investigate the question, “Which nose cone geometry minimizes the drag and maximizes thermal performance for each speed regime of a rocket?” To try and answer the question, we compare findings from various papers using fluid dynamics (CFD) simulations and field experiments, placing emphasis on drag, heat flux, and temperature. Unlike most literature reviews in this field, we also consider the subsonic speed range, by trying to find gaps in humanity’s current understanding of drag and stability at this speed. In the end, we propose the nose cone geometries that perform most efficiently in each speed regime.
After analyzing the existing literature and best practices, successful approaches for improving aerospace vehicle performance and efficiency become clear. This review also identifies areas where information remains limited, highlighting opportunities for future research. By building a basic knowledge of the effect of nose cone geometry on aerodynamics and heat transfer characteristics, this review attempts to be useful for future innovations and the construction of future space crafts that perform better. The knowledge gained from the review will assist in formulating the future research agenda.
Methods
Key terms and equations
This literature review analyzes how well nose cone designs work in aerospace vehicles and rocketry. The main focus was to compare different shapes with respect to two key factors: aerodynamic efficiency and thermal behavior.
Aerodynamic efficiency refers to how well a shape minimizes drag and maintains stability during flight. This category includes the drag coefficient and the drag force.
The drag coefficient  is a quantity used to quantify the drag or resistance of an object moving through a fluid environment:
(Eq.1) 
where  is drag force,
  is fluid density,
  is reference area, and
  is velocity. Because the drag coefficient is normalized by area and fluid properties, it is especially useful for comparing drag across different vehicles and regimes.
In contrast, the drag force  is the resistance, in units of force, an object experiences as it moves through a fluid:
(Eq. 2) 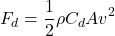
Thermal behavior involves how the nose cone handles the extreme heat, especially that generated at high speeds. This category includes the heat flux and heat transfer coefficient.
Heat flux  is the rate of energy flow per unit area per unit time:
(Eq. 3) 
where  is the heat transfer rate, and
  is the area over which the heat transfer occurs. The heat transfer coefficient
  describes how efficiently heat moves between a surface and a fluid, for each unit of area and each degree of temperature difference:
(Eq. 4) 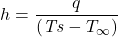
where  is surface temperature and
  is ambient temperature.
The drag coefficient, a standardized metric that usually ranges from 0-1, provides greater ease of use for aerodynamic performance metrics. Similarly, heat flux provides information about heat buildup sites, making it a more practical metric for analyzing thermal performance. These metrics are therefore more commonly used when comparing nose cones.
The overall goal was to determine which nose cone profiles are most effective across various flight conditions, accounting for drag and thermal effects.
Research Methods
The research papers were identified using Google Scholar. Searches were conducted between June 2025 and March 2026. The search terms used were: “nose cone design,” “nose cone design for subsonic speed range,” “aerodynamics nose cone design,” “aerodynamics nose cone design for supersonic speed range,”, “aerodynamic drag in nose cones,” “hypersonic flow nose cones”, “nose cone CFD analysis” and “thermal analysis for nose cone design.” By targeting specific areas, the review was able to cover a range of speeds from subsonic speeds and up to very high supersonic speeds, with measures focused on thermal control and aerodynamic drag. If a study provided a measure for any of the four relevant performance measures (heat flux, drag coefficient, drag force, heat transfer coefficient) in a relevant range of flight conditions it was relevant to the review, and if key data did not provided, for whatever reasons, and no measure could be provided for any of the targets. An initial search returned approximately 15 results; after detailed searching and adding 25 more potential papers, and then screening for relevance and data availability in papers from 2000 onwards, 24 papers were included in this review.
| Author & Year | Geometry Type(s) | Mach Range | Speed Regime | Metric(s) Used | Key Findings |
| Oka Sudiana et al. (2024)6 | Conic, Power, Haack, Tangent Ogive | Mach 0.5-4 | Subsonic-Supersonic | Cd, Fd | Conic has lowest Cd and Fd; LV Haack highest; gap widens at higher Mach |
| Narayan et al. (2019)7 | Blunted, Parabolic, Taper Spike, Stepped Taper Spike | Mach 6 | Hypersonic | Cd, Heat Flux | Stepped taper spike gives largest Cd and heat flux reduction vs. unspiked designs |
| Hemateja et al. (2017)8 | Blunt Cones | Mach 2-8 | Supersonic-Hypersonic | Cd, Heat Flux | Medium radius best in supersonic; larger radius better in hypersonic; sharp cone maximizes heat flux |
| Ranjan et al. (2015)9 | Tangent Ogive, Elliptical, Parabolic, Conical | Mach 2-5 | Supersonic | Fd | Parabolic produces lowest drag force and 18-22% lower peak pressure than conical baseline |
| Narayan et al. (2018)10 | Spherically Blunted, Parabolic | Mach 5.8 | Hypersonic | Fd | Parabolic lower Fd above FR 1.2; blunted lower below FR 1.2; viscous drag negligible |
| V. Kumar M. et al. (2022)11 | HIFIRE-0, HyShot-3, HyShot-2 | Mach 1-5 | Supersonic-Hypersonic | Fd | HyShot-2 produces orders-of-magnitude lower Fd; Fd increases with altitude for all |
| Rajput et al. (2024)12 | Blunted Tangent-Ogives | Mach 2 | Supersonic | Cd | Cd decreases with larger ogive radius; 250 mm radius achieves lowest total Cd |
| Narayan et al. (2025a)13 | Spherically Blunted, Elliptical | Hypersonic | Hypersonic | Heat Flux, HTC | Elliptical geometry shows 18-25% lower heat flux and heat transfer at all fineness ratios |
| Raza et al. (2024)14 | Parabolic with Bi-conic, Flat, Conical Taper Spikes | Hypersonic | Hypersonic | Heat Flux | Flat taper spike achieves lowest heat flux near root; bi-conic tip produces highest stagnation heating |
| Moradi et al. (2018)15 | Blunt Nose + Aerodome, Varied Coolant Jet Direction | Supersonic | Supersonic | Heat Flux, HTC | Back jet reduces heat flux and HTC ~30%; top jet increases both by 20-25% |
| Ghanbari et al. (2022a)16 | Blunt Spike + Single/Multi Lateral Jet | Mach 5 | Hypersonic | Heat Flux | Single He lateral jet at spike tip reduces peak heat flux by ~40%; multi-jet CO2 less effective |
| Ghanbari et al. (2022b)17 | Double-Aerodome Spike + Lateral Jet | Mach 5 | Hypersonic | Heat Flux | CO2 jet at 50 mm aerodome spacing reduces peak heat flux up to 45%; outperforms He for this geometry |
| Shi et al. (2023)18 | Multi-Row Disk Spike + Lateral Jet | Mach 6 | Hypersonic | Heat Flux | Tip-positioned CO2 jet reduces heat flux 52%; CO2 outperforms He due to higher molecular weight |
| Iranmanesh et al. (2023)19 | Multi-Row Disk Spike + Multi Coolant Jets | Mach 5 | Hypersonic | Heat Flux | Dual-coolant (He+CO2) at 40 mm disk spacing reduces heat flux 58%; best of all coolant configs |
| Pish et al. (2019a)20 | Blunted Cone + Spike with Coolant Injection | Mach 4 | Supersonic | Cd, Heat Flux | CO2 injection most effective; longer spike + higher jet pressure maximize Cd and heat flux reduction |
| Pish et al. (2020)21 | Sharp Nose Cone with Varied Cavity Geometry | Mach 2-3 | Supersonic | Cd, Heat Flux | Longer cavity and more cavities (4) increase thermal efficiency; cavity length key factor at Mach 3 |
| Pish et al. (2019b)22 | Blunted Cone | Mach 8.5 | Hypersonic | HTC | Equilibrium air model yields 31% higher HTC than perfect gas; bluntness ratio 0.4 shows greatest effect |
| Saravanan et al. (2009)23 | Missile-Shaped Body | Mach 5.75, 8 | Hypersonic | HTC | Stagnation HTC 1,850-2,100 W/m²K; fins increase local HTC 12-15%; validates Fay-Riddell theory |
| Narayan et al. (2025b)24 | Elliptical, Spherically Blunted | Supersonic | Supersonic | Cd, HTC | Elliptical shows lower HTC and better aerodynamic performance; ~22% reduction in stagnation HTC |
Limitations
Certain limitations became prevalent during the review process. First and foremost access was restricted when looking into some of the sources as articles are blocked by paywalls or memberships i.e.: Emerald Website (emerald.com), IEEE, Institute of Aeronautics and Astronautics (AIAA) Aerospace Research Central. Another limitation was that the results could not all be directly comparable due to widely differing conditions of simulation/experimentation between models. Lastly due to the expensive nature of performing and experimenting in order to gather extensive results from actual test flight, and high levels of time and data processing, there is very little experimental data available regarding designs primarily aimed at sub-sonic applications and predominantly rely on the data collected using computer models & (CFD) to form. The search procedure also highlighted a lack of studies into combined thermal aerodynamic performance and possibility of bias towards novel and positive results being published (24 papers considered in general covering several different Mach numbers in an attempt to ensure that comprehensive, valid, results could be shown below).
Results
Overview
The results show that the shape of the nose cone is crucial in how the flow develops around the body, and, consequently, in both aerodynamic and thermal analyses. The profiles diffuse the air differently, changing the shock pattern (if in the supersonic/hypersonic range), surface pressure, and temperature of the material. This reduces the build-up of adverse pressure along the body and helps the flow remain attached, reducing drag. Additionally, blunt shapes create a shock that is farther from the tip so that even at higher speeds the heat reaching the surface is lower. Thus, an analysis of patterns across various flow regimes shows that geometry plays an important role in the behavior of a rocket. Smaller surface features also influence the flow. These features adjust the flow in minute ways that are not always obvious from the nose cone’s main outline. As a result, a rocket’s performance depends on its primary shape as well as other surface features affecting its movement.
These geometric effects appear across all speed ranges. At lower speeds, the main differences come from how well the flow stays attached to the surface. At higher speeds, a shock forms and becomes stronger as flow velocity increases, so the nose cone’s shape determines how far the shock stands away from the tip. As the speed increases, the heating becomes stronger, and the geometry becomes even more important. The shape determines how the shock wraps around the body and how the heat spreads along the surface. The results are divided into two distinct groups: aerodynamic performance evaluated with drag coefficient and drag force and thermal performance evaluated with heat flux and heat transfer coefficient. Each metric is presented in its own subsection. Each subsection explains how the different shapes behave in subsonic, supersonic, and hypersonic flow. This structure allows comparison of shapes across different conditions while emphasizing distinct aerodynamic and thermal effects.
Aerodynamic Performance
The aerodynamic results are organized by the main performance metrics, allowing the behavior of each nose cone shape to be compared clearly across the different studies. Starting with the drag coefficient allows us to examine how the geometry alone affects the pressure forces on the nose. After that, the drag force results show how these geometric differences grow stronger as speed increases.
Drag Coefficient
The data from the IOP study of blunt-body aerodynamics (2023) shows how the aerodynamic efficiency (measured as drag coefficient) of a smooth blunt nose can be drastically decreased with slight modification to the body shape that alters the flow field ahead of the forebody25. Even the modified surfaces performed similarly better for reducing drag across the range of Mach tested as seen for most of the configuration, but the smooth tempered blunt tip clearly showed the most drag per Mach number tested. The clear difference across the spectrum show that reshaping shock layer and boundary layer behavior over a fixed shape can lead to tremendous aerodynamic savings.
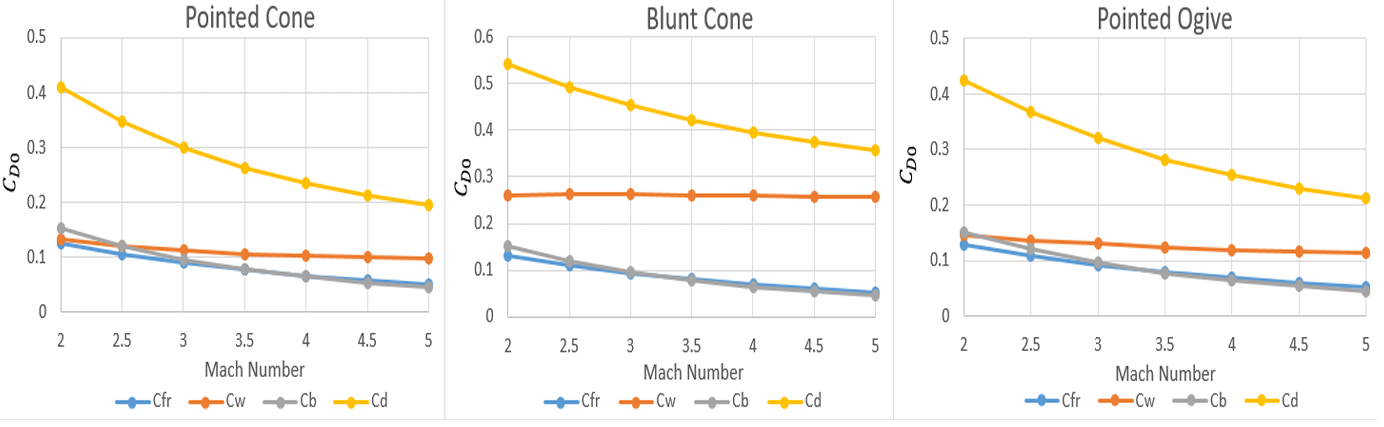
The data from Oka Sudiana et al. (2024) evaluate the conic, power, Haack series, and tangent ogive shapes, and their differences at Mach 0.56. When the fineness ratio (the ratio of a nose cone’s length to its maximum width) increases, the spread grows. The fineness ratio is the ratio of the length of a body to its maximum width. At low fineness ratios, the drag coefficient values are very close, with differences of only about 1.5% to around 3%. Within this group, the conic nose has the lowest drag coefficient, while the LV Haack profile has the highest. As the nose becomes longer and more slender, the flow becomes more sensitive to changes in curvature. The conic shape produces a smoother pressure distribution than the LV Haack profile, showing that even small differences in curvature influence airflow and drag.
The second set of drag coefficient data came from Narayan et al. (2019), showing different spike geometries on blunted and parabolic nose cones7. This paper noted that a taper spike is capable of reducing drag coefficients, and a stepped taper spike reduces them even more (but did not provide quantitative numbers). One can still glean that unspiked geometry results in highest Drag Coefficient, next is spiked geometry then finally the stepped spike. The purpose of the spike (and the steeper spike) is to push the bow shock forward away from the projectile, such that there is less pressure in between the shock and body, in addition to the increased reduction from the stepped geometry reducing it further still. Again, these demonstrate shock controlling geometry’s improvement with speed increases.
The data from Hemateja et al. (2017) focuses on how different nose radii behave at high Mach numbers8. Larger radii move the bow shock farther away from the surface, while smaller radii keep it close. The study finds that a medium radius performs best in supersonic flow, while a larger radius becomes more effective in hypersonic conditions. The shift in performance reflects how the shock changes with speed and the amount of pressure it exerts at the surface. The optimal radius depends on the balance between wave drag and surface pressure. A medium radius performs best in supersonic flow, whereas a larger radius becomes preferable in hypersonic flow because the increased shock stand-off distance reduces heating.
Oka Sudiana et al. (2024) evaluates low to moderate speeds, showing that geometry affects boundary-layer attachment. Dimples and slender conic shapes lower drag by maintaining the flow attached longer. Narayan et al. (2019) and Hemateja et al. (2017) observe higher speeds but reach somewhat conflicting results. Narayan et al. emphasize that the drag can be reduced by displacing the bow shock using a stepped spike regardless of the base geometry. Hemateja et al. instead conclude that the base geometry’s own radius is most important, with a medium radius helpful in supersonic and larger radius optimal in hypersonic flow. However, both of these findings are important, and cannot be considered completely contradictory as neither study includes both variables, namely spikes and nose radii simultaneously.
Drag Force
Drag force is an important metric of aerodynamics and appears in the data from Oka Sudiana et al. (2024) . It compares the efficiency of the different smooth profiles with increase in speed6. The results show that drag force is lowest with the conic shape and highest with the LV Haack shape reaching a difference of nearly 20% at Mach 4. The conic shape maintains 12-15% lower drag force as compared to the LV Haack profile across the tested Mach numbers 7. Dynamic pressure increases with Mach number so that even small geometric differences become significant, explaining the observation where total drag rises over 40% between Mach 2 and Mach 4. In summary, the drag force follows the same trend as drag coefficient but increases with speed. Small changes in geometry can thus cause a larger impact on drag forces at higher Mach numbers.
The study by Robin R. Ranjan et al (2015) compares various nose cone geometries, such as tangent ogive, elliptical, conical and parabolic9. Here, the parabolic configuration is observed to produce 18-22% peak pressures lower than the conical shape. At higher speeds, the parabolic nose cone has the lowest drag force compared to other shapes. The heat flux at the tip drops by about 15% relative to the tangent-ogive case. Across different tested conditions, the parabolic profile shows a consistent advantage and the overall drag coefficient decreases by roughly 10% with this contour. It guides the flow more smoothly around the nose thereby decreasing surface pressure and producing the lowest drag force, especially at higher speeds.
In Narayan et al. (2018), the authors compare the drag force of spherically blunted and parabolic nose cones at a Mach number of 5.8 across fineness ratios of 0.6, 0.8, 1.0, 1.2, 1.5, 2.6, 3.6, and 4.7 at zero angle of attack10. Here we see that the pressure drag and total drag both decrease when fineness ratio increases for both parabolic and spherically blunted nose cones. However, parabolic nose cones produce lower drag at fineness ratios above 1.2 while spherically blunted nose cones produce the same at ratios below 1.2. Viscous drag effect on the overall performance is found to be nearly negligible. This observation remains steady across all fineness ratios studied, with a correlation factor of greater than 0.99, meaning that if these results are repeated, there is almost 100% chance that the findings will hold. Above fineness ratios of 1.2, the oblique shock that is formed by the parabolic nose cone lowers surface pressure and drag, while the performance of the spherically blunted nose cone is better below this fineness ratio.
In V. Kumar M. et al. (2022), the authors compared three types of nose cones’ drag forces at Mach 1, 3, and 5; altitudes 0, 5, 10 and 15 km: HIFIRE-0, HyShot-3 and HyShot-226. In conclusion, they proved that for all conditions, the force of HyShot-2 drag is much smaller from the two other configurations. The force value goes from 0.2772 N (Mach 1, sea level) to 1.9189 N (Mach 5, 15km) for HIFIRE-0, between 0.00114 N and 0.07603 N for HyShot-3, and between 0.000006835 N and 0.000041862 N for HyShot-2, following consistently a similar trend: drag force increases with altitude for every nose cone, jumping between 10 and 15 km, and is proportional with Mach for HIFIRE-0 while it is inversely proportional to Mach for the other configurations due to a shock interaction.
In Rajput et al. (2024), the authors investigated the drag coefficient of a blunted tangent-ogive nose cone at Mach 2 with varying ogive radii of 100, 150, 200 and 250mm at a fixed bluntness ratio of 0.4 and zero angle of attack12. The result shows that the total drag coefficient of nose cone progressively decreases with increases of the radius for all cases from 0.00124010 at R =100mm to 0.00108079 at R =150mm, 0.00098926 at R =200mm, and 0.00008165at R =250mm, and validates the shock detachment distance as 5.07% of the corresponding theoretically accepted value. The same trends are registered for other values and also on the pressure distribution. The total force decreases in both cases for an increase in radius due to decreased bow shock strength because of a large, blunt radius, weakening the surface pressure buildup and dissipation in the viscous region at the shock.
Drag force studies reveal that drag can be reduced by increasing the slenderness, refining the nose cone or having a larger ogive radius, but they do not agree on the optimal geometry. Oka Sudiana et al. (2024) find the conic nose cone performs better at speeds of Mach 0.5 to Mach 4 but Ranjan et al. (2015) tested the parabolic cone at speeds of Mach 2 to Mach 5. Though the conclusions are contradictory even at overlapping speed ranges, conic nose seems to perform better at low Mach speeds and the parabolic nose is efficient at high Mach speeds. This is further confirmed by Narayan et al. (2018) with the caveat that the parabolic shape performs better only above a fineness ratio of 1.2 and a spherically blunted cone does better below this threshold for the same speed. The studies by Ranjan et al. and Oka Sudiana et al. do not use fineness ratio as a variable of measurement. Since Ranjan et al. and Oka Sudiana et al. do not report fineness ratio as a variable, their rankings may not hold across all aspect ratios. Though Rajput et al. (2024) confirmed the earlier studies that drag decreases with a larger ogive radius at Mach 2, this study tested only one Mach speed and hence cannot be used to arrive at a generalized conclusion. Another study by V Kumar M. et al. (2022) tested using full vehicle configurations and not just the nose cone profiles and so the results cannot conclusively confirm if the efficiencies were due to nose cone profiles alone or due to other aspects of the vehicle configuration. There have been no studies that have tested nose cone geometry with different fineness ratio and at different Mach speeds.
Thermal Performance
The section on thermal performance is divided into two subsections. The first subsection on heat flux analyzes how different nose cone geometry shapes the distribution of surface heating. The second sub section on heat transfer coefficient reveals how the heat flux changes under different flow conditions and various cooling methods. By presenting the evidence in this order, it is easy to explain how each nose cone design handles different thermal loads and their behavior changes under different operating conditions.
Heat Flux
In Narayan et al. (2019) the study focuses on understanding how different spike arrangements alter the heat pattern on a spherically blunted nose and parabolic nose cone. The two types of spike designs are a regular taper spike and a stepped taper spike. The stepped taper spike reduces peak heat flux by 28% to 35% compared to the regular taper spike during Mach 6 tests7. The results show that the stepped taper spike reduces the heat flux along the entire length of the nose cone wall with a significant drop of 30% near the spike root where the heating is usually the highest. The stepped taper spike also alters the shock system such that it reduces the amount of thermal energy reaching the nose cone surface by increasing the shock stand-off distance compared to the regular taper spike.
In Narayan et al. (2025a), two types of nose cones, a spherically blunted nose and an elliptical nose are compared across different fineness ratios to understand how the shape affects heating. The elliptical nose cone had a 18% – 25% lower peak heat flux compared to the spherically blunted nose cone for all fineness ratios13. The maximum reduction is at the stagnation point where the study reports a 22% reduction in the elliptical nose cone compared to the blunted nose cone. Even for the same nose cone, the wall-heat-flux dropped by about 30% near the forward region as the fineness ratio is increased. The study also revealed that the elliptical nose cone altered the shape of the shock layer causing the heat flux to drop sharply near the front and this was confirmed by measuring the shock stand-off distances for the nose cone. Hence the elliptical nose cone is an efficient design when only the heat flux is used as a metric.
In Hemateja et al. (2017), the authors compare how a sharp nose and a blunt nose configuration affects heat flux8. They report that the sharp, 30-degree cone with a 10-millimeter radius generates far higher heat flux than the blunt, 20-millimeter-radius model when tested across different Mach speeds. This is because the blunt nose spreads the shock wave farther from the nose thereby reducing the surface heat flux.
In Raza et al. (2024), the authors compare several spike tip shapes to determine how each influences heating, and their data show that the bi‑conic tapered spike generates a stagnation-point heat flux that is about 22-27% higher than that of the other designs under the same hypersonic conditions14. The study shows that the bi-conic tapered spike produces the highest heat flux at the stagnation point and the flat tapered spike produces the lowest value of heat flux at the spike root with a roughly 18% reduction compared to the conical and bi-conic tips. This is because the flat tapered spike increases the shock stand-off distances by nearly 10% and hence reduces the heat flux at the spike root.
In Moradi et al. (2018), the authors investigate how different coolant jet directions like top jet and back jet affect the heat flux at the nose. Their study reveals that the top jet increases heating by 20% – 25% at the stagnation point because it drives the reflected shock toward the nose 15. The back jet produces a great reduction because it cools the recirculation zone thus reducing the local heat flux by 30% compared to the no-jet case. The jet direction reshapes the shock stand-off distance and redistributes the thermal energy with the back jet increasing the shock stand-off distance by about 15%.
In Ghanbari et al. (2022a), the authors investigate how single and multiple coolant jet configurations affect heat flux on a nose cone equipped with a blunt spike at hypersonic flow conditions at Mach 516. A single lateral jet injected from the top of the spike is the most efficient for heat flux reduction. This configuration produced a heat flux reduction of 40% compared to 18% – 22 % for mid-spike and 10% – 14% for base injection. Comparing a single lateral jet configuration against an opposing multi-jet configuration showed that the former reduced heat flux by 40% and the latter by 25% – 28% under identical conditions. The study also compares the efficiency of the different jet gases Helium and Carbon Dioxide (CO2) under identical configuration. Helium produced a 15% greater reduction compared to CO2 because the lower molecular weight enables it to increase the shock stand-off distance more effectively. In summary, tip-of-spike helium injection using a single jet configuration is the most efficient in reducing heat flux.
In Ghanbari et al. (2022b), the authors investigate how lateral coolant jet placement affects heat flux reduction on a nose cone equipped with a double-aerodome spike configuration at hypersonic flow conditions17. The study compared a double-aerodome spike configuration with a single-aerodome spike configuration and a lateral coolant injection in both cases. The double-aerodome spike reduced heat flux by 18% – 24% compared to the single-aerodome spike. This is because the double-aerodome spike produces two separate recirculation zones thereby helping with heat flux reduction. The study further experimented with three different spacing configurations between the two disks for the double-aerodome spike; 25 mm, 50 mm and 75 mm. The 50 mm spacing delivering the maximum heat flux reduction of 45% compared to 38-41% for the 25 mm and 75 mm configurations. The study also used Helium and CO2 as the coolant jets and found that CO2 outperformed Helium jet in this geometry.
Shi et al. (2023) investigates heat flux reduction using the location of the lateral single jets on a multi-row disk spike as the variable. The study also compares CO2 jet gas versus Helium jet gas for efficiency27. A single CO2 jet near the spike tip is the most efficient producing approximately 52% heat flux reduction compared to 44% – 48% for upper-mid, 36% – 40% for lower-mid and 18% – 22% for base injection. Comparing CO2 against Helium, CO, jet injection located at the tip reduces heat flux by 52% while a Helium jet at the same location reduces heat flux by only 38% – 42% under identical conditions. The optimal configuration produces the greatest heat flux reduction in this study because it increases the shock stand-off distance by roughly 16%.
In Iranmanesh et al. (2023), the authors investigate how multiple coolant jet configurations affect heat flux on a nose cone equipped with a multi-row disk spike at hypersonic flow conditions19. This study used both CO2 and Helium gases in a multi-jet configuration instead of a single gas. Data show that this configuration produced approximately 19% greater heat flux reduction because Helium deflects the bow shock while CO2 provides cooling in the recirculation zone. Experiments were conducted across three different disk separation distances of 20mm, 40mm and 60mm and found that 40mm separation produced the maximum heat flux reduction of 58% because the shock stand-off distance increased by roughly 14%.
The Pish et al. (2019a) study investigates the effect of the three coolant gases of air, helium and CO2 on the heat flux reduction. The test injected the gases from the tip of a spike mounted on a blunted nose cone at a speed of Mach 420. Their results show that CO2 injection produces greater heat load reduction than helium and heat flux at the center of the blunted nose decreasing steadily as jet pressure increases from P₀j/P₀₂ = 20 to 60. The same behavior was observed for different spike lengths from 50 mm to 250 mm. Analysis shows that while CO2 remains concentrated near the spike tip thereby strengthening the recirculation zone, Helium disperses upstream thereby reducing its cooling efficiency.
In Pish et al. (2020), the authors investigate how different cavity shapes, depths, lengths, and numbers of cavities on a sharp nose cone affect the thermal characteristic and drag coefficient at supersonic flow conditions21. Their results show that increasing the length of the cavity is highly efficient for heat flux reduction at Mach 3, and that as Mach number increases to 3, the number of cavities becomes a significant factor, with four cavities (case 9) producing more efficient thermal performance than configurations with fewer cavities. This condition holds true at different Mach numbers. Adding cavities to the nose cone helps to reduce direct thermal load on the nose cone wall because the cavity traps and recirculates the hot gas within the cavity. This effect is more pronounced with longer and more cavities on the nose cone.
The majority consensus between heat flux studies is that increased shock stand-off distance is the primary mechanism for thermal protection; disagreement exists over the method to increase standoff distance. The geometry-centric studies, Narayan et al. (2025a), Hemateja et al. (2017), and Narayan et al. (2019), all agree that either blunter or carefully tailored profiles decrease stagnation heating; maximum reductions between these studies range from ~18-35% depending on geometry and spike configuration. Implicit in these studies is an additive logic: a blunt/elliptical base with a stepped spike should perform better than either modification alone, though no such configuration has been tested. Perhaps more pronounced is the tension between coolant jet studies over which gas performs better. Ghanbari et al. (2022a) finds helium improves performance over CO2 on a single-disk spike geometry, while Ghanbari et al. (2022b) and Shi et al. (2023) find CO2 improves performance over helium on double-aerodome and multi-row disk geometries, respectively. Jet coolant disagreement may be resolved by geometry being a mediating variable: helium’s low molecular weight favors geometries where displacement of the bow shock dominates heat flux reduction, while CO2’s higher molecular weight enhances coolant effectiveness in flow configurations where recirculation zone cooling plays a larger role. Iranmanesh et al. (2023) confirms this hypothesis by injecting both gases, reducing heat flux by 58%, more than either coolant alone. Thus, the two primary heat flux reduction mechanisms are likely complementary. Passive cavity studies by Pish et al. (2019a, 2020) cannot be compared directly with jet injection studies due to differences in operating Mach number and thermal management strategy, but show improved heat flux reduction through simpler engineering means with more modest gains. Missing from all studies is application of coolant jets to elliptical/conic base geometries.
Heat Transfer Coefficient
The second thermal performance metric, heat transfer, is also addressed in the IOP blunt‑body investigation25. In this study, the authors examine how changes to the nose‑region geometry influence the thermal loads experienced in supersonic flow. Their results show that configurations which modify the shock stand‑off distance or redistribute the flow can significantly reduce surface heating compared to a standard blunt nose. The smooth blunt model consistently exhibits the highest heat transfer because the strong bow shock remains close to the surface, compressing and heating the air. In contrast, the modified configurations weaken or displace the shock, lowering the thermal flux. The information presented demonstrates that adjustments to the geometry near the nose can reduce heating, making these designs more effective when minimizing thermal load is a primary objective.
The Narayan et al. (2025a) comparison of heat transfer over the elliptical and spherical nose cone for different fineness ratios concluded the elliptical design leads to about 18-25% less heat transfer compared with the spherically-blunted one for any individual fineness ratio28. They revealed the temperature/heat transfer decreases fast near the nose tip and afterwards stays nearly constant as we move further to the surface for both cones which is more obvious for higher fineness ratio where nearly 30% reduction occurs for earlier stage before stabilizing. elliptical shape proves lower heat transfer in all cases, including in the stagnation region (22%). Researchers claim it’s because elliptical body forms smoother and controllable shock wave which generates less shock heating to the body and that is verified by a larger distance for shock-boundary layer interaction as it allows early stabilization of heat-transfer rate. Thus, when heat transfer is used as a design parameter, elliptical body is preferred for heat transfer based fineness ratio.
Moradi et al. (2018) investigates how the direction of the coolant jet affects heat transfer in the neighborhood of the nose cone15 Their computations indicate that the top jet configuration increased the heat transfer rate by 20-25% since the jet pushed the reflected shock closer to the boundary. On the other hand, the back jet configuration performed best in terms of cooling of the recirculation zone which led to ~30% decreases in the local heat transfer, when compared to the no-jet configuration. The performance obtained for the mid-jet configuration decreased by approximately 10-12%. the computations also have shown predictable outcomes for the changes in the pattern of flows around the nose as demonstrated in the shock stand off-distance increase of around 15% which was recorded for the back-jet configuration. This, by cooling the recirculation area more effectively, makes back-jet configuration ideal when heat transfer performance is dominant under supersonic flight.
In Pish et al. (2019b), the authors investigate how viscous equilibrium conditions affect heat transfer coefficient on a blunted cone at hypersonic flow22. Their data show that equilibrium air dissociation produces approximately 31% higher heat transfer coefficients compared to perfect gas assumptions at Mach 8.5. The study reports stagnation point heat transfer coefficient of 8,200 W/m²K under equilibrium conditions versus 6,100 W/m²K for perfect gas models. This difference remains consistent across bluntness ratios 0.2, 0.4, and 0.6, with ratio 0.4 showing the greatest coefficient increases of 28-32%. Because equilibrium air properties produce more physically accurate heat transfer coefficient predictions across all hypersonic conditions, this approach represents a more realistic model than perfect gas assumptions when heat transfer is the primary parameter of interest.
A study conducted by Saravanan et al. (2009) reported and discussed convective heat transfer rate distributions over a missile-shaped body flying at hypersonic speeds23. Their experiments showed that at hypersonic speeds for two Mach conditions (Mach 5.75 and Mach 8), the heat transfer coefficient values at the stagnation point was reported to be 1,850-2,100 W/mK (as function of enthalpy). These experimental data were in agreement with theoretically obtained values from Fay and Riddell expressions with the overall agreement on the order of 6 to 8%. The introduction of fins to the missile frustum showed increase in heat transfer coefficient (by 12-15%) in the fin region, but a negligible variation on the main body. The experimental values of the heat transfer coefficient for the missile geometries at extremely high Mach numbers provide values needed for the validation of methods for designing thermal protection systems of bodies re-entering the atmosphere.
The findings of the heat transfer coefficient section show that each individual factor of geometry, surface roughness, and active cooling can decrease heat transfer. However, there is no comparative analysis of all the factors together so that one can contrast the effectiveness of the heat transfer decreasing features. The active jet direction in Moradi et al. results in similar reductions as that of the advantage reported by Narayan et al. This indicates that both active and passive design measures can be of similar advantage at supersonic speed. A methodological issue impacting the whole sub-section needs to be raised by Pish et al. (2019b) based on the result showing that heat transfer coefficients predicted with air at equilibrium conditions were 31% larger than predicted using perfect gas assumptions for the same conditions. Therefore, any study reporting such an assumption could be underestimating the heat transfer under hypervelocity flows by up to 33%. As very few of the CFD studies present details of the gas model assumed, interpretation of exact values should be cautiously assessed. The only experimental contribution to the subject of this section is reported in Saravanan et al. (2009), where excellent correlation with Fay-Riddell predictions was obtained; however, the study’s test article is not completely representative of the studies in this section, whereas all the models studied in other studies were idealised profiles. There is a definite gap in that no studies assess and combine geometry, surface textures and coolant use under similar conditions, which doesn’t allow analysis of the potential advantages that each could provide.
Discussion
| Metric | Speed Regime | Best-Performing Geometry | Performance Advantage | Source |
| Drag Coefficient (Cd) | Subsonic-Low Supersonic | Conic Profile | Lowest Cd at all tested fineness ratios; 1.5-3% advantage over ogive profiles widens at higher Mach | Oka Sudiana et al. (2024)6 |
| Drag Coefficient (Cd) | Supersonic-Hypersonic | Stepped Taper Spike on Blunted/Parabolic Nose | Largest Cd reduction of all spiked and unspiked configurations; shock pushed forward further | Narayan et al. (2019)7 |
| Drag Coefficient (Cd) | Supersonic (medium Mach) | Medium-Radius Blunt Cone | Balances wave drag and surface pressure; outperforms large and small radii in this regime | Hemateja et al. (2017)8 |
| Drag Force (Fd) | Supersonic (Mach 2) | Blunted Tangent-Ogive (250 mm radius) | Largest ogive radius reduces total Cd by up to ~87% relative to smallest radius tested | Rajput et al. (2024)12 |
| Drag Force (Fd) | Subsonic-Supersonic | Conic Profile | 12-15% lower Fd than LV Haack across tested Mach; gap grows to ~20% at Mach 4 | Oka Sudiana et al. (2024)6 |
| Drag Force (Fd) | Supersonic | Parabolic Nose Cone | 18-22% lower peak pressure than conical; lowest Fd at high speeds | Ranjan et al. (2015)9 |
| Drag Force (Fd) | Hypersonic (Mach 5.8) | Parabolic (FR > 1.2) / Blunted (FR < 1.2) | Parabolic forms attached oblique shock; lower surface pressure than blunted at high fineness ratios | Narayan et al. (2018)10 |
| Drag Force (Fd) | Supersonic-Hypersonic | HyShot-2 Configuration | Orders of magnitude lower Fd than HIFIRE-0 and HyShot-3 across all Mach and altitude conditions | V. Kumar M. et al. (2022)11 |
| Heat Flux | Supersonic | Back Coolant Jet on Blunt Nose + Aerodome | ~30% reduction in heat flux vs. no-jet case; top jet worsens heating by 20-25% | Moradi et al. (2018)15 |
| Heat Flux | Supersonic (Mach 4) | CO2 Injection at Spike Tip (Blunted Cone) | Greater heat flux reduction than He or air; longer spike + higher jet pressure amplify effect | Pish et al. (2019a)20 |
| Heat Flux | Supersonic (Mach 3) | Sharp Nose with 4-Cavity Configuration | Most efficient thermal configuration at Mach 3; cavity length is primary governing factor | Pish et al. (2020)21 |
| Heat Flux | Hypersonic (Mach 6) | Blunted Cone (20 mm radius) | Sharp 10 mm cone creates far higher heat flux; larger radius spreads shock and lowers surface heating | Hemateja et al. (2017)8 |
| Heat Flux | Hypersonic (Mach 6) | Stepped Taper Spike | 28-35% lower peak heat flux than regular-taper spike; ~30% drop near spike root | Narayan et al. (2019)7 |
| Heat Flux | Hypersonic | Elliptical Nose Cone | 18-25% lower heat flux than spherically blunted at all fineness ratios; advantage reaches ~30% at high FR | Narayan et al. (2025a)13 |
| Heat Flux | Hypersonic (Mach 5) | Flat Taper Spike on Parabolic Nose | Lowest heat flux near spike root; ~18% lower than conical/bi-conic tips; wider shock stand-off | Raza et al. (2024)14 |
| Heat Flux | Hypersonic (Mach 5) | He Lateral Jet at Spike Tip (Single Jet) | ~40% peak heat flux reduction vs. baseline; outperforms multi-jet CO2 for this geometry | Ghanbari et al. (2022a)16 |
| Heat Flux | Hypersonic (Mach 5) | CO2 Jet, Double-Aerodome at 50 mm Spacing | Up to 45% heat flux reduction; CO2 outperforms He; dual-disk creates stronger recirculation zones | Ghanbari et al. (2022b)17 |
| Heat Flux | Hypersonic (Mach 6) | Tip-Positioned CO2 Lateral Jet, Multi-Row Disk Spike | 52% heat flux reduction; CO2 outperforms He; proximity to bow shock shows effectiveness | Shi et al. (2023)18 |
| Heat Flux | Hypersonic (Mach 5) | Dual He+CO2 Jets, Multi-Row Disk at 40 mm Spacing | 58% heat flux reduction (highest of all configs); synergistic cooling from two gas types | Iranmanesh et al. (2023)19 |
| Heat Transfer Coefficient (HTC) | Supersonic | Back Coolant Jet on Blunt Nose | ~30% lower HTC vs. no-jet; top jet increases HTC by 20-25% | Moradi et al. (2018)15 |
| Heat Transfer Coefficient (HTC) | Supersonic | Elliptical Nose Cone | ~22% lower stagnation HTC than spherically blunted; advantage maintained across fineness ratios | Narayan et al. (2025b)24 |
| Heat Transfer Coefficient (HTC) | Hypersonic | Elliptical Nose Cone | 18-25% lower HTC than blunted sphere at all ratios; ~30% at high FR | Narayan et al. (2025a)13 |
| Heat Transfer Coefficient (HTC) | Hypersonic (Mach 8.5) | Blunted Cone (equilibrium air model) | Equilibrium air yields 31% higher (more realistic) HTC than perfect-gas assumption; bluntness ratio 0.4 optimal | Pish et al. (2019b)22 |
| Heat Transfer Coefficient (HTC) | Hypersonic (Mach 5.75-8) | Missile-Shaped Body (experimental) | Stagnation HTC 1,850-2,100 W/m²K; experimental validation of Fay-Riddell model; fins add 12-15% locally | Saravanan et al. (2009)23 |
Different shapes of nose cones deflect the flow in different ways which alters the pressure of the nose cone surface, the shock wave forces that can be generated and the amount of heat flux reaching the nose cone. At midspeed, smooth slender shapes of nose cone aid the flow to stay attached resulting in lower drag. In contrast, in hypersonic speed, blunt nose cone geometries and other shock modification profiles reduce the heat flux and overall heat load. Additionally, our research indicates that controlling features such as dimples and coolant jets can create a boundary layer shift or effect the shock pattern thereby providing performance benefits in fact even if the shape of the nose cone remains unchanged.
Our findings also show that the nose cone configuration with the most advantages is very sensitive to the speed range and the application of the rocket. A nose cone shape that is optimal for one regime in terms of flow may not be ideal for hypersonic flow and shapes that favor reduced drag might lead to increased heating. These results reveal that the conic or ogive shape of the nose cone provide the least drag coefficient and the least drag force in the low-supersonic flow regime, simple parabolic or moderately radiused nose cone designs offer the lowest drag in the high-supersonic flow regime and spiked or shock-modifying nose cones such as shock-induced spikes are best suited for hypersonic environments. The above trade-offs suggest that both the thermal and aerodynamic factors should be considered together during the design process rather than independently. The limited experimental investigations for subsonic nose cones show the significance of more testing to support computer model results.
More specifically, in the subsonic regime, a dimpled surface of a nose cone and blade induced turbulence minimizes the drag coefficient when attached flow is favored while a smooth nose cone surface provides the lowest heat transfer rate when thermal transfer is desired. In the transonic and supersonic speed regime (from Mach 0.5-2) the lowest drag coefficient and drag force were measured for the conic and tangent-ogive nose cones while the conic profile retains a drag force advantage of 12-15% over the LV Haack series nose cone geometries. As the speed increases into the supersonic-low hypersonic regime (roughly Mach 2-5) the lowest drag force and maximum surface pressures are measured for the parabolic nose cone while the elliptical profile causes the lowest heat transfer coefficient and heat flux; the elliptical shape causes an approximate 22% reduction in heat transfer coefficient, while the “back-directed” coolant jet on a blunt nose cone with an aerodome reduces heat flux by roughly 30%. Finally, in the hypersonic regime (roughly Mach 5 and above) the most effective nose cone shape for minimization of both drag and heating is more highly dependent on the needs of the specific mission, with the parabolic style with a sharpened spike providing the lowest drag and the elliptical shape providing the least amount of heat transfer.
Overall, the findings give a clearer understanding of how nose cone shapes affect flight efficiency, stability, and thermal protection. By showing which shapes work best under different conditions, this review helps guide future design choices for aerospace vehicles. More research in this area can lead to more efficient, reliable, and flexible nose cone designs that meet the growing demands of modern aviation and space exploration.
Acknowledgements
Mentored by Lauren Simitz (Stanford University). No other funding or sponsorship was used in this paper.
References
- Parts of a model rocket. https://www.apogeerockets.com/education/downloads/Newsletter120.pdf, n.d. [↩]
- N. Hall. What is drag? Glenn Research Center; NASA. https://www1.grc.nasa.gov/beginners-guide-to-aeronautics/what-is-drag/, 2022. [↩]
- R. Nakka. Nakka-Rocketry.net. https://www.nakka-rocketry.net/RD_index.html, 2026. [↩]
- R. Nakka. Introduction to Rocket Design. Richard Nakka’s Experimental Rocketry Site, https://www.nakka-rocketry.net/RD_index.html, 1997. [↩]
- Basics of rocket aerodynamics optimization. https://www.apogeerockets.com/education/downloads/Newsletter629.pdf, n.d. [↩]
- O. Sudiana, A. Riyadl, R. H. Triharjanto, P. Widodo. Nose cone parametric studies for optimal design of 300 mm‑class ballistic rocket. IEEE International Conference on Aerospace Electronics and Remote Sensing Technology (ICARES). Vol. 1, pg. 1-6, 2024, https://doi.org/10.1109/icares64249.2024.10768051. [↩] [↩] [↩] [↩] [↩]
- A. Narayan, S. Narayanan, R. Kumar, T. Singh, C. S. Kumar, G. Jagadeesh. Control of aerodynamic drag and heating of nose cones through taper spikes. Journal of Spacecraft and Rockets, Vol. 56, No. 4, pp. 1165-1176, 2019, https://doi.org/10.2514/1.A34250. [↩] [↩] [↩] [↩] [↩]
- A. Hemateja, B. R. Teja, A. D. Kumar, S. G. Rakesh. Influence of nose radius of blunt cones on drag in supersonic and hypersonic flows. IOP Conference Series: Materials Science and Engineering. Vol. 225, pg. 012045-012045, 2017, https://doi.org/10.1088/1757-899x/225/1/012045. [↩] [↩] [↩] [↩] [↩]
- R. R. Ranjan, D. V. Parmar, H. K. Raipuria, P. B. Singh. Innovative nose cone design of aircraft. Proceedings of the ASME International Mechanical Engineering Congress and Exposition, Vol. 1, 2015, V001T01A001, https://doi.org/10.1115/IMECE2015-50264. [↩] [↩] [↩]
- A. Narayan, S. Narayanan, R. Kumar. Hypersonic flow past nose cones of different geometries: a comparative study. Simulation: Transactions of the Society for Modeling and Simulation International. Vol. 94, No. 8, pp. 665-680, 2018, https://doi.org/10.1177/0037549717733051. [↩] [↩] [↩]
- V. Kumar M., H. Shanmugam, A. Dasgupta. Drag optimization of nose cone configuration in supersonic and hypersonic regimes. Multidisciplinary International Journal. Vol. 8, No. 2, 2022, https://www.researchgate.net/publication/359438960. [↩] [↩]
- B. Rajput, A. Narayan, S. Narayanan, P. K. Pandey. Computational study of supersonic flow past blunted tangent-ogive nose cone. IOP Conference Series. 2024, https://www.researchgate.net/publication/382802035. [↩] [↩] [↩]
- A. Narayan, B. Kumar, B. Kumar. Aerodynamic performance of nose cone geometries in hypersonic flow conditions. Journal of Space Safety Engineering. 2025, https://doi.org/10.1016/j.jsse.2025.08.004. [↩] [↩] [↩] [↩]
- M. S. Raza, A. K. Prasad, L. Prasad, A. Narayan. Heat flux and aerodynamics drag reduction of a hypersonic flow with the different tips of the taper spike design parabolic nose cone. Numerical Heat Transfer Part A: Applications. pg. 1-18, 2024, https://doi.org/10.1080/10407782.2024.2302080. [↩] [↩] [↩]
- R. Moradi, M. Mosavat, M. Barzegar Gerdroodbary, A. Abdollahi, Y. Amini. The influence of coolant jet direction on heat reduction on the nose cone with aerodome at supersonic flow. Acta Astronautica. Vol. 151, pg. 487-493, 2018, https://doi.org/10.1016/j.actaastro.2018.06.026. [↩] [↩] [↩] [↩] [↩]
- M. Ghanbari, S. Maddah, J. Alinejad. Influence of coolant multi-jets on heat reduction of nose cone with blunt spike at hypersonic flow. Scientific Reports. Vol. 12, Article 15615, 2022, https://doi.org/10.1038/s41598-022-20046-5. [↩] [↩] [↩]
- M. Ghanbari, S. Maddah, J. Alinejad. Numerical study of lateral coolant jet on heat reduction over nose cone with double-aerodome at hypersonic flow. Scientific Reports. Vol. 12, Article 20391, 2022, https://doi.org/10.1038/s41598-022-22061-y. [↩] [↩] [↩]
- Y. Shi, Q. Cheng, A. Alizadeh, H. Yan, G. Choubey, K. Fallah, M. Shamsborhan. Influence of lateral single jets for thermal protection of reentry nose cone with multi-row disk spike at hypersonic flow. Scientific Reports. Vol. 13, Article 6549, 2023, https://doi.org/10.1038/s41598-023-33739-2. [↩] [↩]
- R. Iranmanesh, A. Alizadeh, M. Faraji, G. Choubey. Numerical investigation of compressible flow around nose cone with multi-row disk and multi coolant jets. Scientific Reports. Vol. 13, Article 787, 2023, https://doi.org/10.1038/s41598-023-28127-9. [↩] [↩] [↩]
- F. Pish, R. Moradi, A. Edalatpour, M. Barzegar Gerdroodbary. The effect of coolant injection from the tip of spike on aerodynamic heating of nose cone at supersonic flow. Acta Astronautica. Vol. 154, pp. 52-60, 2019, https://www.researchgate.net/publication/328194796. [↩] [↩] [↩]
- F. Pish, T. D. Manh, M. Barzegar Gerdroodbary, N. D. Nam, R. Moradi, H. Babazadeh. Computational study of the cavity flow over sharp nose cone in supersonic flow. International Journal of Modern Physics C. Vol. 31, No. 6, Article 2050079, 2020, https://doi.org/10.1142/S0129183120500795. [↩] [↩] [↩]
- F. Pish, A. Hassanvand, M. Barzegar Gerdroodbary, S. Noori. Viscous equilibrium analysis of heat transfer on blunted cone at hypersonic flow. Case Studies in Thermal Engineering. Vol. 14, Article 100464, 2019, https://doi.org/10.1016/j.csite.2019.100464. [↩] [↩] [↩]
- S. Saravanan, G. Jagadeesh, K. P. J. Reddy. Convective heat-transfer rate distributions over a missile shaped body flying at hypersonic speeds. Experimental Thermal and Fluid Science. Vol. 33, No. 4, pp. 782-790, 2009, https://doi.org/10.1016/j.expthermflusci.2009.02.005. [↩] [↩] [↩]
- A. Narayan, S. Kumar, N. K. Gautam, P. Phatate, R. Kumar. Supersonic flow over a different nose cone to reduce aerodynamic characteristic: a comparative study. Aircraft Engineering and Aerospace Technology. Vol. 97, pg. 688-697, 2025, https://doi.org/10.1108/aeat-10-2024-0288. [↩] [↩]
- A. Kumar, S. Kumar, R. Kumar, A. Kumar. Experimental and numerical investigation of supersonic flow over a blunt body. Journal of Physics: Conference Series. Vol. 2523, pg. 012010, https://iopscience.iop.org/article/10.1088/1742-6596/2523/1/012010/pdf, 2023. [↩] [↩] [↩]
- V. Kumar M., H. Shanmugam, A. Dasgupta. Drag optimisation of nose cone configuration in supersonic and hypersonic regimes. Multidisciplinary International Journal. Vol. 8, No. 2, 2022, https://www.researchgate.net/publication/359438960. [↩]
- Y. Shi, Q. Cheng, A. Alizadeh, H. Yan, G. Choubey, K. Fallah, M. Shamsborhan. Influence of lateral single jets for thermal protection of reentry nose cone with multi-row disk spike at hypersonic flow. Scientific Reports. Vol. 13, Article 6549, 2023, https://doi.org/10.1038/s41598-023-33739-2. [↩]
- A. Narayan, S. Kumar, N. K. Gautam, P. Phatate, R. Kumar. Supersonic flow over a different nose cone to reduce aerodynamic characteristics: a comparative study. Aircraft Engineering and Aerospace Technology. Vol. 97, pg. 688-697, 2025, https://doi.org/10.1108/aeat-10-2024-0288. [↩]