
Abstract
This paper evaluates how distinct governance structures influence the adoption and scalability of sustainable energy and transportation technologies. It addresses the lack of analytical frameworks comparing the efficacy of centralized, top-down state interventions against market-driven or localized policies across diverse national contexts. A systematic comparative policy review methodology was employed. Five representative national case studies were selected using explicit inclusion criteria focusing on sector leadership: France (nuclear energy), Iceland (geothermal power), China (high-speed rail), Norway (electric vehicles), and the Netherlands (cycling infrastructure). A standardized qualitative coding method was developed to evaluate policy instruments, outcomes, systemic risks, and unintended structural dependencies across cases. While geographic endowments and macroeconomic crises initially catalyzed transition strategies, long-term policy scalability depended heavily on the governance model. Centralized, top-down approaches featuring dedicated oversight bodies efficiently mobilized capital for large-scale public infrastructure, but introduced significant vulnerabilities, including immense public fiscal debt and localized regulatory friction. Conversely, market-incentivized models accelerated near-term private consumer technology adoption but yielded regression risks and regressive socio-economic subsidies when state incentives contracted. The analysis demonstrates that sustainable technology transitions are context-dependent, challenging the assumption that top-down centralization is universally superior. Effective long-term sustainability require balancing centralized infrastructure investments with flexible, localized feedback loops to mitigate fiscal risks and ensure equitable technology deployment.
Keywords: Sustainable Technology, Climate Change, Policy Analysis, Sustainable Energy, Sustainable Transport
Introduction
In the past two decades, anthropogenic climate change has caused systemic degradation across global ecosystems, exacerbated extreme weather events, and accelerated sea-level rise. The primary driver of this crisis is the compounding atmospheric accumulation of greenhouse gases (GHGs), predominantly carbon dioxide (CO2) and methane (CH4). To mitigate these risks, 195 Parties adopted the 2015 Paris Agreement, establishing Nationally Determined Contributions (NDCs) aimed at limiting global warming to 1.5°C above pre-industrial levels1.
Because energy production and transportation are major sources of global GHG emissions, decarbonizing these sectors is essential to achieving these climate targets2.
In this policy analysis, “sustainability” is operationalized as the structural transition toward technology-driven energy and transport infrastructures that exhibit zero or near-zero net GHG emissions, optimize resource efficiency, and remain economically and socially viable without exhausting domestic fiscal capacities or compromising long-term environmental equilibria.
While the necessity of this transition is globally recognized, national strategy selection varies widely based on geographic endowments, socio-economic contexts, and governance styles. To evaluate how these transitions manifest, this study employs the Multi-Level Perspective (MLP) on socio-technical transitions as its theoretical framework3. The MLP posits that structural technological changes occur through dynamic interactions across three analytical levels: the macro-level landscape (exogenous pressures like international climate pacts or supply shocks), the meso-level regime (entrenched regulatory structures, institutional norms, and physical infrastructure), and the micro-level niche (emerging technological innovations). Within this doctrine, national state interventions act as a primary mechanism to either destabilize existing carbon-intensive regimes or shield and scale sustainable niche innovations.
However, existing literature often treats public policy in a binary fashion, centralized versus decentralized, without critically examining the specific trade-offs, institutional risks, and failures inherent to different state models. This gap limits direction for developing states attempting to tailor international policy to local resource constraints.
To address this gap, this paper investigates the historical evolution and structural outcomes of sustainability policies across five sector-leading nations: France (nuclear energy), Iceland (geothermal power), China (high-speed rail), Norway (electric vehicles), and the Netherlands (cycling infrastructure).
Research Question: How do centralized, top-down state interventions compare to market-incentivized, grassroots policy in accelerating sustainable technology adoption, and what are the respective systemic trade-offs of these approaches across diverse socio-technical regimes?
Methods
This study employs a qualitative comparative policy review design to systematically evaluate national strategies for sustainable socio-technical transitions. By standardizing key operational components, historical implementation frameworks, and macro-level outcomes across different jurisdictions, the analysis isolates specific institutional mechanisms that drive or inhibit green technology adoption.
To build this comparative baseline, secondary data and evidence were extracted from peer-reviewed literature indexed across prominent academic archives, including Google Scholar and JSTOR. These academic sources were cross-referenced and validated with official government reports, legislative white papers, and historical policy briefs to ensure structural and empirical accuracy.
Case study selection utilized a purposeful sampling methodology based on verified, decadal-scale global sector leadership in a specific renewable energy or sustainable transportation medium.
Consequently, five representative nations were selected and evaluated: France, Iceland, China, Norway, and the Netherlands. The policy trajectory of each country was analyzed by tracking their structural attributes across five distinct phases:
- Pre-transition regime baseline
- Exogenous transitional catalysts
- Early-stage policy mobilization
- Drivers of systemic scalability
- Current socio-technical equilibriums
| Country | Technology | Policies | Outcome Variables | Time Window | Indicators of Policy Success | Sources |
| France | Nuclear Energy | Centralized planning; public investment; energy security | Nuclear share; electricity decarbonization | 1973–2025 | ~68% nuclear electricity; among world’s lowest-carbon grids | Taylor et al. (1998)4; U.S. Energy Information Administration (2023)5; Cour des comptes (2025)6 |
| Iceland | Geothermal Energy | Government investment, municipal partnerships, geothermal resource development | Renewable electricity generation; geothermal heating adoption | 1970–2024 | Nearly 100% renewable electricity generation and ~90% of homes heated by geothermal energy | IEA (2024)7; Ragnarsson et al. (2021)8; IEA (2022)9 |
| China | Hydropower, Wind, and Solar Energy. | State subsidies; central industrial policy | Renewable capacity; emissions intensity; manufacturing scale | 2005–2025 | World’s largest solar & wind capacity; global clean-energy manufacturing leader | IEA (2022)10; Zhou et al. (2022)11; Zhang et al. (2013)12 |
| Netherlands | Cycling Infrastructure | Urban planning, cycling investment, fiscal incentives | Cycling modal share; road safety; public health | 1973–2025 | Cycling accounts for approximately 27% of all trips nationally while maintaining one of the world’s safest cycling networks | KiM (2022)13; Schepers et al. (2017)14; Fishman et al. (2015)15 |
| Norway | Electric Vehicles | Tax exemptions, purchase incentives, charging infrastructure | EV market share; consumer adoption | 1990–2025 | In 2025, approximately 95.9% of new passenger cars sold in Norway were battery electric, the highest adoption rate globally | IEA (2024)16; Figenbaum & Kolbenstvedt (2015)17; Norwegian Road Federation18 |
| China | High Speed Rail (HSR) | Central planning, public infrastructure investment, technology transfer | Network length; accessibility; transport capacity | 1990–2025 | 50,000 km HSR; ~2/3 of global HSR network | World Bank (2019)19; UIC (2024)20; Xu & Zhu (2024)21 |
Results
Sustainable Energy Technology Overview
The most significant global shifts in sustainable technology adoption have emerged from the rapid structural reconfiguration of primary utility grids. Exogenous landscape pressures have catalyzed transformations in low-carbon energy generation, including through the development of nuclear, geothermal, and hydroelectric infrastructures22. By establishing standardized institutional policy, select jurisdictions have successfully scaled these technologies to achieve absolute sector dominance. This section systematically evaluates the macro-level triggers, meso-level policy instruments, and systemic regime trade-offs observed within the energy sectors of France and Iceland
Nuclear Power in France
France’s transition from heavy reliance on imported energy to becoming one of Europe’s largest electricity exporters is a textbook example of fast-paced, government-centered development. In 1973, OAPEC imposed production cuts and targeted oil embargoes against countries it considered unfriendly to the Arab position during the Yom Kippur War, an exogenous shock that caused oil prices to surge and threatened French economic stability. While the United States negotiated, France deviated from its energy status quo to address its precarious position as a heavy energy importer4.
President Georges Pompidou and Prime Minister Pierre Messmer decided to pursue nuclear energy as France’s primary energy source, as France was not naturally rich in oil or other natural energy sources. This doctrine for ambitious nuclearization was to be carried out over the course of the decade22. This plan was not debated in parliament; due to the public ownership of Électricité de France (EDF), it was subject to direct control by the French government23.
With this top-down government program, France accelerated development by licensing pressurized water reactor (PWR) technology from Westinghouse, while domestic manufacturing and construction were carried out by French firms such as Framatome, allowing for the utilization of existing technology23. Throughout the implementation of the Messmer Plan, France’s main policy was to outcompete the fossil fuel industry through the rapid construction of nuclear energy, effectively pushing out fossil fuel interests through market alternatives23.
Since 1980, energy generated from nuclear power has increased from ~25% to 68% of domestic electricity generation in 20215. This growth was driven by the extensive buildup of infrastructure for both power production and waste management. However, France has recently faced a decline in operational reactors due to widespread stress-corrosion cracking, which forced emergency shutdowns and highlighted the risks of over-reliance on a standardized technological fleet6. Furthermore, the massive capital requirements to maintain this aging infrastructure have incurred significant fiscal liabilities, leading the French state to fully renationalize EDF in 20236. Despite these challenges and a divided parliament that complicates current funding, the government remains committed to the modernization and expansion of the nuclear program6.
Geothermal in Iceland
Iceland is another unique country similarly leading the world in its renewable energy of choice: geothermal energy. However, Iceland doesn’t just specialize in geothermal energy but instead has an electricity grid entirely powered from renewable sources, where geothermal constitutes approximately 30% of generation and hydro accounts for the remainder, while geothermal energy provides roughly 70% of the country’s total primary energy supply7. Most of this energy is from Iceland’s unique resources, such as geothermal vents and large natural rivers and waterfalls, which have contributed significantly to Iceland’s ability to use renewable energy historically. Since early settlements were founded in Iceland, geothermal energy was used for heating. During the 1970s, particularly after the 1973 oil crisis, Iceland pushed several policies through parliament that transitioned domestic heating from oil to geothermal to pursue a policy of energy autonomy and further harness its own natural resources8.
A key institution in the transition to geothermal has been the National Energy Authority. The National Energy Authority (Orkustofnun) was established under Iceland’s 1967 Energy Act, became a centerpiece for the Icelandic government’s transition to renewable energy. The National Energy Authority developed a phased master plan to implement geothermal energy use. This plan involved data gathering, research, and evaluation of geothermal fields to efficiently map out the construction of new geothermal stations. The Authority oversaw all geothermal plants, as well as all renewable energy stations. Iceland pushed out numerous policies to encourage geothermal energy, such as providing loans to cover initial drilling and exploration costs. If initial drilling was unsuccessful, the loan could be converted into a grant and would not have to be repaid, reducing financial risk for developers. This encouraged investment in geothermal projects7. Furthermore, Iceland has invested in research and innovation to enhance geothermal technologies and explore new methods of harnessing geothermal energy9. Along with this, Iceland has implemented research-sharing programs to continue to develop the infrastructure required for a Net-Zero Iceland24. Primarily, Iceland was able to encourage the adoption of geothermal energy through taking advantage of its natural resources and focusing on infrastructure to harness said natural resources. Iceland did not have any specific policies to discourage oil usage, but only incentivized geothermal energy more, which pushed out the oil industry into a lesser part of the Icelandic energy sector. Given that the Authority was a government agency with control over the development of the geothermal industry, Iceland was able to enable fast, rapid change and overcome any obstacles from the oil industry, such as lobbying8. However, this state-led progress was fundamentally enabled by Iceland’s location on the active Mid-Atlantic Ridge, which provided shallow geothermal gradients unmatched in most regions, alongside a market structure that utilized energy-intensive aluminum smelting corporations to act as financial anchors for the electricity grid’s baseload. Furthermore, as the Icelandic people were used to using geothermal energy, the change did not cause any major unrest.
Since 2003, Iceland has only ramped up policy regarding geothermal energy, such as increasing funding to build more geothermal stations to outcompete oil reliance and has been an exemplary model for the Paris Climate Agreement and other sustainable energy agreements. Iceland’s geothermal program is poised for continued growth and innovation across the next 30 years. As Iceland leads the world in green energy, it must also be stressed that the Icelandic model is not a model that all countries can follow. Iceland’s unique resources of geothermal springs and rivers provide excellent conditions for sustainable energy, but for other countries with less abundant geological endowments, they will have to follow the model of other nations, such as France.
Wind, Solar, and Hydropower in China
Within the past two decades, China has emerged as the most rapidly expanding actor in the global renewable energy sector. As of 2023, China leads the world in cumulative installed capacity for hydropower, solar photovoltaics (PV), and wind power generation, surpassing countries such as the United States and Sweden, both of which possess highly developed renewable energy infrastructures25,26. This expansion has occurred almost entirely within the past 25 years; for instance, China’s solar PV power generation has increased by over 400% since 20002.
While hydropower has historically served as a significant baseline electricity source in China, non-hydro renewables, particularly wind and utility-scale solar, have experienced exponential growth over the past decade. However, evaluating the progress of this transition requires a rigorous separation of distinct metrics: total primary energy supply (TPES), electricity generation, and total installed capacity. Failing to distinguish between these domains creates a misleading representation of China’s actual reliance on fossil fuels.
In 2021, renewable sources accounted for approximately 30% of China’s total domestic electricity generation—with approximately 16% derived from hydropower, 8% from wind, 4% from solar PV, and 2% from biomass12. Furthermore, as of 2022, China accounted for 40% of the world’s cumulative solar PV capacity, 40% of global wind energy capacity, and 29% of global hydroelectric generation capacity. However, because electricity generation represents only one sector of total energy consumption, these immense capacity figures must not be conflated with the broader primary energy mix. Indeed, fossil fuels, comprising coal, oil, and natural gas, still accounted for 87% of China’s total primary energy supply (TPES) as of 202210.
Historically, China’s strategic transition toward energy diversification began in 1993, driven primarily by concerns over national security and a desire to mitigate foreign energy dependency27. State planners identified the necessity of mitigating potential energy supply disruptions, drawing historical parallels to the macroeconomic shocks of the 1973 oil crisis and the geopolitical vulnerability of states such as North Korea and Russia27.
To address these vulnerabilities, the Chinese government deployed a suite of highly centralized, top-down policies. These interventions included establishing binding national renewable energy targets, extending significant state-backed financial incentives, and executing large-scale grid infrastructure upgrades to manage the integration of intermittent renewable resources28. Under its long-term strategic plans, China aims to have non-fossil fuel sources account for 80% of its total primary energy supply by 2060, alongside a target of achieving 1,200 GW of combined wind and solar installed capacity by 203011.
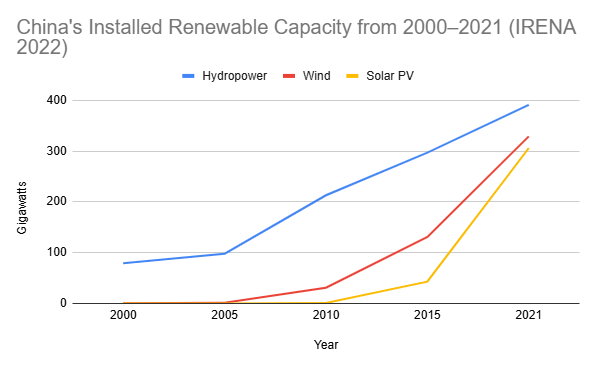
Initially, the state guaranteed market viability for these technologies using Feed-in Tariffs (FiTs) to subsidize wind and solar developers. As these sectors matured, the government began phasing out FiTs in favor of market-oriented competitive auctions and renewable electricity consumption mandates. This transition has been supported by state-owned development banks offering low-cost capital, alongside localized infrastructure programs such as the Whole County Solar pilot, which mandates distributed rooftop solar deployments across rural regions29.
In tandem with supply-side policy, China has pursued a unique demand-side industrial relocation strategy. This policy guides energy-intensive industries, such as steel manufacturing and textile production, to relocate near western provinces where renewable energy resources (such as wind and solar) are highly abundant. This spatial alignment is complemented by policies targeting the transport sector, such as subsidies for electric vehicles (EVs) and sustainable aviation fuels, the integration of low-carbon building systems into municipal urban planning, and the deployment of distributed microgrids in rural areas.
Furthermore, state policy has prioritized expanding charging infrastructure and implementing artificial intelligence (AI) technologies to optimize grid transmission and balancing29. While the high capital expenditures associated with constructing these massive transmission networks and renewable installations have placed a substantial financial burden on state capital reserves, integrating AI-driven forecasting is projected to maximize efficiency.
Unlike the historical transitions observed in France and Iceland, which were consolidated in the late 20th century, China’s policy paradigm is active, dynamic, and characterized by continuous technological integration. Nonetheless, systemic trade-offs remain: a significant portion of China’s renewable hardware manufacturing, such as wind turbines and solar PV cells, is exported globally rather than being fully utilized for domestic grid decarbonization. This tension between industrial export dominance and domestic grid optimization represents a critical challenge for China’s green transition.
Energy Synthesis
France, Iceland, and China share clear strategic motivations behind their energy transitions, driven primarily by geopolitical crises and national security. These three nations were selected for analysis because they represent recognized world leaders in their respective sustainable energy sectors, offering distinct, decadal-scale models of technological deployment. The 1973 oil shock acted as a direct catalyst for France and Iceland, forcing both nations to reconfigure their domestic energy sectors to reduce vulnerability to foreign supply disruptions. Similarly, China initiated its energy diversification strategies to mitigate its strategic dependence on foreign fossil fuels and protect its economic sovereignty from potential geopolitical conflicts.
While state-led initiatives were central to these transitions, attributing their success entirely to top-down government mandates may overlook critical geographical and market preconditions. In Iceland, the transition to geothermal district heating succeeded because of the island’s unique tectonic geography, which provides shallow access to high-temperature thermal gradients. Furthermore, the Icelandic state relied on a specific industrial market structure, leveraging energy-intensive sectors such as aluminum smelting to ensure a consistent baseline demand for electricity. Without these natural and industrial parameters, state planning alone would not have been sufficient to scale the geothermal grid.
Moreover, highly centralized execution has introduced severe structural vulnerabilities and democratic deficits in each country. France accelerated its nuclear expansion under the Messmer Plan by bypassing parliamentary debate and public participation, which created lasting public resistance to waste repository siting. The standardized, single-technology fleet also remains vulnerable to widespread corrosion, necessitating expensive emergency shutdowns. In China, aggressive state-led renewable expansion has historically outpaced grid transmission capabilities, causing severe bottlenecks and substantial debt for state-owned utilities. This top-down model has built an export-heavy manufacturing sector, yet domestic grid decarbonization remains an ongoing challenge, as fossil fuels still accounted for nearly nine-tenths of China’s aggregate primary energy footprint in 2022.
The differences between these countries become clearest when looking at how they mobilized capital and managed financial risk. France focused its public funding on a single, standardized technology, whereas China built a diverse portfolio of wind, solar, and hydropower. Their risk-mitigation strategies also differed significantly. Iceland’s National Energy Fund absorbed exploration risks for local municipalities by converting unsuccessful drilling loans into direct state grants. In contrast, China initially used generous, state-guaranteed tariffs to attract private investment before transitioning to competitive auctions as the technologies matured. These distinct approaches show that state-led policies are not uniform, and the choice between public risk-absorption and market-driven tariffs directly shapes a nation’s long-term fiscal liabilities.
Ultimately, while these countries emerged as global leaders in nuclear, geothermal, and wind/hydropower/solar energy, the top-down approach cannot be seen as an exact golden standard, with current programs facing bureaucratic and financial issues. Consequently, enduring transitional policy must look past either absolute state control or pure market reliance.
Sustainable Transportation
Transportation is a major source of greenhouse gas emissions in Western Europe and North America30. In response to these environmental pressures, numerous government programs run in countries around the globe have taken on the challenge of tackling the ecological impact of the transportation industry.
These three nations were selected because they represent recognized world leaders in their respective sustainable transit sectors, where “world leader” status is operationalized as possessing the highest global per capita adoption rates, the greatest cumulative physical infrastructure deployment, or the most rapid decadal-scale market transitions in their respective technologies. Among these efforts, select nations have emerged as pioneers by establishing distinct, scalable low-carbon transit models. The Netherlands leads the world in renewable transport infrastructure for sustainable transport31. Concurrently, Norway leads the world in electric car adoption and implementation16, while China leads the world in high-speed rail32. These countries have all made leaps to develop their sustainable transportation technology sectors and currently lead the world in their respective branches of eco-friendly transport.
Sustainable Transportation in the Netherlands
The Netherlands is a small nation in Western Europe with dense urban communities. Due to this geographic layout, there is little innate requirement for long-distance domestic automotive transport, aviation, or extensive cross-country domestic rail networks. Instead, municipal policy has optimized transport within localized municipal sectors, prioritizing cycling infrastructure to the extent that cycling accounts for approximately 27% of all trips in the Netherlands13. When analyzed through Geels’ Multi-Level Perspective (MLP), the Netherlands’ transition to a low-carbon transport sector represents a clear social-technical transition, where macro-level landscape pressures successfully destabilized the dominant, car-centric socio-technical regime.
Before 1973, the Dutch state aligned closely with the broader Western European transport paradigm, which was heavily influenced by post-war American energy strategies that favored petroleum reliance. The domestic automotive sector possessed moderate institutional influence, and the private automobile remained a central component of the average Dutch commute33. However, the 1973 Oil Crisis was a major shock that disrupted the status quo. Because the Dutch government vocally supported Israel and condemned the Arab Coalition during the Yom Kippur War, the nation faced targeted oil export embargoes levied directly by OAPEC members34. Unlike France, which possessed the state-directed financial reserves necessary to launch a centralized nuclear energy program and dampen the immediate macroeconomic shocks, the Dutch state did not immediately pursue capital-intensive energy supply reforms. Consequently, state planners managed strict oil rationing measures while public support for the automotive sector contracted. This economic crisis introduced significant volatility into Dutch domestic politics, as the Central Planning Bureau documented sharp increases in unemployment, depressed economic growth, heightened inflation, and structural disruptions to the port of Rotterdam and industrial enterprises34.
In the immediate aftermath of the embargo, the state implemented mandatory “Car-Free Sundays” to enforce resource conservation and stimulate public awareness regarding energy vulnerabilities33. Constrained by limited public capital, the state capitalized on existing high-density urban geography, which conditioned the population to substitute private vehicle commutes with walking and cycling. This landscape-level friction generated widespread public distrust toward fossil fuel reliance. Simultaneously, the state, while continuing its diplomatic opposition to the OAPEC embargoes, leveraged this shifting public sentiment to initiate a structural policy divergence away from car-centric civil engineering.
Since the Oil Crisis, the state has allocated substantial fiscal resources toward sustainable transport initiatives, including recent commitments have supported sustainable transport development in the Netherlands, including investments in cycling infrastructure.35. Policy instruments have specifically targeted the scaling of cycling as a primary mode of alternative transport. In the Netherlands, employers can provide employees with a tax-free mileage allowance for commuting, including bicycle travel36. To complement these supply-side incentives, the state deployed demand-side regulatory penalties, leveraging heavy registration taxes on internal combustion vehicles and high fuel duties to actively discourage personal vehicle acquisition37. These state-level interventions effectively shielded, subsidized, and scaled what were previously isolated municipal niche innovations, institutionalizing new civil engineering design standards that transformed urban planning from an automobile-first design baseline into a network that prioritizes active transit.
The state successfully implemented these structural reforms due to the alignment of national energy security objectives with grassroots democratic mobilization. During the early 1970s, the “Stop de Kindermoord” social movement emerged to protest rising traffic fatalities, particularly those involving children in urban areas38. The efficacy of this activism was further augmented by a weak domestic automotive manufacturing lobby, which lacked the structural power to mount significant political resistance against transport reformation. Political coordination between student organizations, cycling coalitions, and environmental interest groups provided the legislative momentum necessary for parliament to pass comprehensive infrastructure laws. These regulations suppressed urban vehicle utility by inflating parking fees and traffic fines while simultaneously mandating segregated cyclist thoroughfares38.
At present, the Netherlands maintains a dominant global position in active transport infrastructure. The integration of high-density cycling pathways with a strict road hierarchy has been associated with an approximately 80% reduction in the number of cyclists killed per billion bicycle kilometres14. This structural transition has yielded measurable public health outcomes38. Empirical analysis from the University of Utrecht indicates that regular utilization of this infrastructure correlates with a six-month increase in average life expectancy, translating to an estimated €19 billion in annual health and related economic benefits15.
Nonetheless, this configuration exhibits distinct systemic limitations and infrastructure friction. The high density of active transport has generated localized traffic congestion and navigation bottlenecks within the urban cores of Amsterdam and Utrecht. Furthermore, municipal authorities face escalating capital expenditures to construct, secure, and maintain subterranean, high-capacity bicycle storage facilities at major multimodal transit hubs. The physical layout of segregated cycling corridors also introduces spatial competition, forcing urban planners to balance active transit corridors against pedestrian space and municipal green space preservation. Despite these localized urban planning challenges, the structural alignment of institutional policy, public capital investment, and sustained civic support since 1973 indicates that the Dutch active transit model remains highly resilient and fiscally viable for the foreseeable future, serving as a model for future sustainable transportation initiatives.
Norwegian Sustainable Transportation
In 2024, battery-electric vehicles accounted for approximately 88.9% of new passenger vehicle sales in Norway16. This market share stands in stark contrast to other industrialized economies, such as the United States and China, where, despite larger absolute capital investments in electromobility promotion, adoption rates have climbed more gradually. China invested well over US$200 billion in its domestic EV sector, while the United States announced more than US$300 billion in public and private investment for EV and battery manufacturing. Consequently, by August 2024, new-energy vehicles (NEVs) accounted for 53.9% of China’s passenger-car retail sales and 6.8% in the United States32. The capacity of Norway to outpace these major economic powers can be systematically analyzed through Geels’ Multi-Level Perspective (MLP), evaluating how macro-landscape pressures interacted with a uniquely shielded niche to destabilize the established internal combustion engine regime.
The historical trajectory of the Norwegian automotive transition originated during the 1973 Oil Crisis. As an exogenous landscape shock, the tripling of global crude oil prices created immediate domestic inflationary pressures, driving up retail fuel costs and depressing conventional automobile utility. This geopolitical vulnerability prompted an institutional shift in Norwegian transport policy, leading the state to allocate early research grants to develop domestic electric vehicle prototypes17. Although these initial technological innovations failed to achieve commercial viability, they established the foundational technical knowledge base that later enabled the scaling of the electric vehicle niche.
Beginning in 1990, Norway exempted electric vehicles from the one-off registration tax. A zero-rate VAT exemption for electric vehicles was introduced in 2001, a policy that effectively neutralized the higher manufacturing cost of battery-electric powertrains17. This initial intervention was subsequently reinforced by a cumulative suite of secondary privileges, including municipal parking exemptions established in 1999, a reduction in annual registration and licensing fees in 1996, and complete exemptions from national road toll networks in 199717. While these early regime adjustments steadily altered the consumer cost-benefit analysis, rapid market acceleration was realized in the subsequent decades as micro-level niche innovations advanced, yielding substantial improvements in battery energy density, passenger vehicle safety, and vehicle affordability. By 2020, battery-electric vehicles secured approximately 60% of the domestic new car market39. This baseline expanded further in 2021 due to a synchronized expansion of diverse consumer vehicle choices, such as the widespread introduction of high-demand utility models like the Tesla Model Y, Volkswagen ID.4, and Ford Mustang Mach-E, which coincided with a dense public charging network deployed across urban perimeters40,18.
The structural rapid adoption of this technology was further facilitated by a unique meso-level regime characteristic: the absence of a large domestic passenger-car manufacturing industry. Because Norway historically imported its passenger-car fleet from foreign manufacturers, there was no entrenched corporate lobby or localized labor interest capable of mounting political resistance against electrification policies. This lack of institutional friction allowed state planners to execute an uninterrupted transition. Furthermore, the geographical distribution of the Norwegian population, which is heavily concentrated within major metropolitan corridors, allowed for highly efficient infrastructure positioning, minimizing the need for extensive cross-country highway charging networks. The geography and climate also played a reinforcing role; the frigid climate characteristic of northern and alpine regions restricted the viability of non-motorized active transit options like cycling, cementing personal passenger vehicles as a structural necessity and funneling consumer demand directly into the subsidized EV market.
Norway established a government target for all new passenger cars to be zero-emission vehicles from 2025. In 2025, battery-electric vehicles accounted for 95.9% of new passenger-car sales. Early state planners prioritized an electrification strategy that allowed existing roadway development models to continue without requiring immediate, fundamental structural alterations to urban space.41.
Nevertheless, this market-incentivized transition reveals critical systemic trade-offs and regressive socio-economic outcomes. The rapid expansion of personal EVs has frequently subverted alternative municipal sustainability objectives, such as reducing total automobile dependence and promoting public transit utilization. The scale of state subsidies disproportionately benefited affluent urban households, inflating total private vehicle ownership rates as families acquired multiple electric vehicles to optimize tax positioning42. Concurrently, the total exemption of these vehicles from road toll obligations significantly eroded municipal funding reserves, causing a structural shortfall in capital available for public transit infrastructure modernization. In response to these fiscal strains, the state initiated an unwinding of specific electrification subsidies. Beginning in 2017–2018, Norway began reducing some EV-specific exemptions and benefits for parking, tolls, and ferry transport. Furthermore, as of January 2023, the historical VAT exemption was capped, applying exclusively to the first 500,000 Norwegian Kroner ($51,700) of the vehicle purchase price43. Although these regulatory adjustments increased the operational cost of electric vehicles, domestic adoption rates have remained resilient, indicating that the state has successfully normalized electric vehicle utility within the cultural and infrastructural baseline of the population. This case study demonstrates that while market-based fiscal shielding can rapidly decarbonize a technology fleet, it introduces complex fiscal imbalances that require careful calibration to prevent the cannibalization of broader public transit systems43.
Chinese Sustainable Transportation
China is evaluated in this study due to its rapid expansion of high-speed rail and urban public transit systems. Primarily, the nation leads global high-speed rail (HSR) development, accounting for approximately two-thirds of total worldwide HSR operational mileage44. Furthermore, China maintains extensive public transit infrastructure, with extensive public transit infrastructure45.
Before the 1980s, Chinese domestic transport relied predominantly on non-motorized options. Bicycles served as the primary mode of commuter transport in urban centers, whereas rural areas relied on walking, animal-drawn transport, and inland waterways46. During the 1980s, rapid urbanization initiated a structural shift from bicycle-dominated mobility toward motorized transit47. This modernization drive required substantial infrastructure investment. Railway and highway capacity expanded significantly, yet the transport sector struggled to meet the demands of growing industrial production and trade volume44. This period also marked an increase in automobile-centric development, characterized by extensive road construction. By the late 1980s, China contained over 140,000 highway bridges, but systemic transport bottlenecks continued to constrain economic expansion44. Additionally, traffic accidents and fatalities increased threefold as private vehicle ownership outpaced road safety measures.
During this initial phase of industrial motorization, environmental sustainability was not integrated into national planning, resulting in a substantial rise in greenhouse gas emissions. Between 1980 and 2005, total vehicle emissions of air pollutants, including particulate matter, nitrogen oxides, carbon monoxide, and volatile organic compounds, increased rapidly48. Consequently, China became the leading source of vehicular and transport manufacturing emissions by 200949. Severe air pollution affected major manufacturing centers, leading to reduced urban air quality and a higher incidence of respiratory illness.
As private vehicle ownership grew, urban transport networks faced severe congestion and operational inefficiencies. In many densely populated corridors, inadequate road capacity reduced average vehicular speeds, making non-motorized transport more time-efficient than private driving. Despite rising vehicle ownership rates, many urban households routinely limited vehicle usage due to road congestion and infrastructural limitations.
In the early 1990s, alongside national programs to expand clean energy generation, the Chinese government initiated structural reforms across the transport sector. State planning prioritized the development of an integrated HSR network to modernize rail capacity, relieve industrial freight constraints, and support macroeconomic growth. China’s HSR initiative incorporated technical design principles from foreign systems, including Japan’s Shinkansen network20. Historical accounts note that Deng Xiaoping’s 1978 visit to Japan highlighted the operational capabilities of the Shinkansen and accelerated high-speed rail planning in China50. In December 1990, the Ministry of Railways submitted a proposal to construct a dedicated high-speed line between Beijing and Shanghai, as the existing conventional corridor operated at maximum capacity50. This proposal established the foundation for thousands of kilometers of subsequent HSR construction across Chinese provinces, enhancing interregional connectivity, stimulating local economic activity, and reducing relative dependence on private automotive travel51.
However, high-speed rail expansion did not serve as a complete solution for transport-sector emissions. Empirical studies indicate that HSR expansion can indirectly contribute to increased carbon emissions by accelerating regional industrial concentration and urban development along rail corridors52. Furthermore, the material construction phase of rail line development requires substantial energy inputs and heavy raw materials, generating upfront lifecycle emissions52. Despite these manufacturing lifecycle costs, HSR provided lower operational emissions per passenger-kilometer compared to the rapid motorization model pursued in prior decades, representing an initial institutional shift toward sustainable transport infrastructure.
To build domestic manufacturing capabilities, China utilized strategic technology transfer requirements within commercial contracts with foreign suppliers. International firms including Alstom, Siemens, Bombardier, and Kawasaki were required to establish joint ventures with state-owned manufacturers and transfer technical specifications53. This institutional framework enabled domestic entities to acquire advanced manufacturing capabilities and establish localized production chains. Economic objectives remained central to this strategy, as HSR was leveraged to stimulate real estate and industrial development in secondary cities while facilitating resource distribution across regions50. Centralized governance and streamlined planning processes allowed for rapid infrastructure construction, avoiding many of the land acquisition and public financing delays observed in decentralized jurisdictions50. High-speed rail expansion also aligned with state policy objectives regarding poverty alleviation and regional economic convergence by integrating peripheral regions into national market networks.
Centralized state oversight permitted direct capital allocation and streamlined regulatory approvals. Furthermore, by leveraging access to its domestic market, the state required foreign vendors to share technological intellectual property with domestic firms, thereby reducing long-term dependence on foreign technology suppliers. Stable non-motorized transport use, combined with strong state planning, allowed Chinese planning agencies to allocate substantial capital toward rail infrastructure, while limiting competing demands for investment. China’s HSR network reached approximately 50,400 km in 2025. China State Railway Group reported total railway transport revenue of approximately 1.02 trillion yuan in 202519. By 2030, the high-speed rail network is planned to reach 60,000 km within a total national railway network of 180,000 km. Under the 14th Five-Year Plan (2021-2025), state targets aim to connect 95% of cities with populations exceeding 500,000 via high-speed rail links19.
Despite structural expansion, the long-term financial and social sustainability of the network presents ongoing challenges. China State Railway Group reported total liabilities of approximately 6.04 trillion yuan in September 2022 (approximately $890 billion), representing roughly 5% of national GDP44. Additionally, HSR fare structures cater predominantly to middle- and upper-income commuters, whereas lower-income citizens frequently rely on conventional passenger trains or road transport. Subsidizing HSR capital expenditures while reducing conventional rail services risks increasing travel costs for lower-income populations and widening regional socioeconomic disparities21. If ticket prices remain beyond the reach of lower-income groups, lower-cost fossil-fuel transport modes will remain heavily utilized, offsetting potential environmental gains. Managing these financial debts and equitable pricing structures remains a critical requirement for China’s continued transport policy.
While central policies have been implemented to mitigate transport sector emissions, China remains one of the world’s largest aggregate emitters. The long-term impact of its transport transition will depend on continuous structural reforms, including the integration of electric vehicles, the maintenance of urban public transit, and sustained support for non-motorized transport options.
Transport Synthesis
State intervention across national transportation sectors has often originated from economic vulnerabilities and energy security initiatives. In Norway and the Netherlands, the 1973 Oil Crisis served as a similar catalyst, exposing the risks of energy import reliance and prompting governments to establish durable structures to reduce fossil fuel-dependent transportation. In China, a major domestic mobility crisis emerged during the 1980s due to rapid urbanization and industrial expansion. To mitigate urban congestion and environmental degradation, Chinese planning authorities prioritized high-speed rail (HSR) construction as a centralized alternative to private automobile reliance. The three cases shared institutional conditions that supported strong state involvement in sustainable transportation development, which minimized political resistance and enabled governments to implement state-led transit mandates.
Targeted policy instruments have played a primary role in directing these systemic transitions. Rather than relying on uniform market mechanisms, each nation selected distinct governance models to alter transport behavior. Dutch authorities combined progressive vehicle taxes with sustained municipal investments in cycling infrastructure, creating a positive feedback loop supported by public participation. Norway focused on consumer adoption of electric vehicles by introducing financial exemptions from value-added tax alongside non-monetary privileges like toll waivers and dedicated lane access, significantly lowering the total cost of ownership. China deployed a centralized development project to build its national HSR network, utilizing state financing and direct administrative oversight to bypass administrative bottlenecks.
A comparative evaluation of these approaches reveals differences in their long-term structural outcomes. Although Norway’s fiscal incentives successfully accelerated EV market penetration, they also encouraged higher overall private vehicle ownership, increased road congestion, and reduced municipal transit revenues. As a result, Norwegian authorities have begun scaling back select subsidies and reintroducing targeted vehicle taxes to encourage modal shifts toward mass transit. Conversely, while China’s HSR expansion and the Dutch municipal cycling networks require substantial ongoing capital expenditure, both remain central pillars of their national transport strategies. This comparison suggests that direct state investment in shared transit infrastructure provides greater systemic sustainability than policies that primarily focus on subsidizing cleaner forms of private vehicle ownership.
Discussion
This study’s comparative analysis evaluated the policies driving sustainable technology adoption across leading nations. The findings demonstrate that while initial technological transitions were often spurred on through international causes, such as the incredibly prominent 1973 Oil Crisis, long-term transformation depended heavily on institutional state capacity and aligned public support.
Across both energy and transportation sectors, state intervention proved most decisive when executing intensive structural transitions. In France and China, centralized state executive authority over public utilities enabled state-backed financing, streamlined technology acquisition, and long-term infrastructure planning without opposition from private fossil-fuel incumbents. However, state capacity alone is insufficient; institutional design and public buy-in dictate implementation success. In Iceland, state intervention succeeded because the National Energy Authority served as a dedicated intermediary, providing technical expertise to de-risk geothermal projects. Conversely, the Dutch transition toward cycling infrastructure illustrates how grassroots mobilization combined with external economic shocks can force legislative reform, creating a hybrid governance model where bottom-up demand guides state policy design.
A central pattern emerging from this cross-national comparison is that effective sustainable technology adoption requires a clear, state-led agenda paired with specialized institutional mechanisms. Centralized authority allows state planning bodies to deploy targeted policy instruments such as direct research grants, targeted subsidy phase-outs, standardized public procurement, and rapid, large-scale infrastructure deployment. These findings reflect broader policy literature indicating that centralized structural planning can generate tangible outcomes54, and that top-down coordination remains essential for aligning multi-sectoral strategies to mitigate systemic climate risks55. Nevertheless, top-down governance presents clear trade-offs, including financial exposure from public debt, as observed in China’s high-speed rail network, and unintended market distortions or equity issues, such as those resulting from Norway’s EV subsidy allocations. Ultimately, it can be concluded that while top-down systems have been utilized to great success, their long-term effectiveness depends on local institutions, dedicated funding mechanisms, and sustained public support.
Limitations & Directions for Future Research
A key limitation of this study involves gaps in data regarding the internal policy selection process. In certain case studies, such as Norway’s early prioritization of electric vehicles over other low-emission transit modes, primary documentation detailing parliamentary cost-benefit analyses, lobby influence, and counterfactual policy evaluations was unavailable. Consequently, it is difficult to determine whether specific technology choices resulted from optimal structural alignment with domestic energy profiles or political opportunism. Future research should incorporate internal policy analysis to further trace the domestic political economy driving technology selection.
Conclusion
This comparative analysis demonstrates that the successful adoption and scaling of sustainable technologies across the energy and transport sectors depends on the interaction between centralized national direction and supporting state institutions. Across the evaluated case studies, centralized governance proved to be effective for rapid capital mobilization, large-scale infrastructure planning, and regulatory execution. However, the evidence reveals that top-down mandates cannot operate in isolation, as their long-term efficiency and resilience rely heavily on municipal cooperation, dedicated oversight agencies, and sustained public alignment.
Furthermore, state-led strategies entail distinct structural trade-offs, including fiscal liabilities from debt-financed infrastructure and market distortions from prolonged subsidy regimes that must be carefully managed. Because these policy instruments depend on specific baseline factors such as the government’s administrative capacity, existing industrial base, and domestic resource wealth, top-down models cannot serve as a one-size-fits-all template for smaller or developing nations facing tighter financial constraints.
Ultimately, achieving a durable green transition requires a balanced model that integrates clear national steering with flexible local execution and public consensus. By recognizing both the strengths and structural limitations of state intervention, policymakers can design adaptable strategies tailored to their unique institutional, economic, and geographic realities.
References
- UNFCCC. Nationally determined contributions (NDCs). United Nations Framework Convention on Climate Change. 2015, https://unfccc.int/process-and-meetings/the-paris-agreement/nationally-determined-contributions-ndcs. [↩]
- International Renewable Energy Agency. Renewable capacity statistics 2022. 2022, https://www.irena.org/publications/2022/Apr/Renewable-Capacity-Statistics-2022. [↩] [↩] [↩]
- Geels F. W. (2002). Technological transitions as evolutionary reconfiguration processes: a multi-level perspective and a case-study. Research Policy, 31(8–9), 1257–1274. https://doi.org/10.1016/S0048-7333(02)00062-8 [↩]
- Taylor, R. H., Probert, S. D., & Carmo, P. D. French energy policy. Applied Energy, 59, 39–61, 1998. https://doi.org/10.1016/S0306-2619(97)00055-X [↩] [↩]
- U.S. Energy Information Administration. Nuclear power plants generated 68% of France’s electricity in 2021. 2023. https://www.eia.gov/todayinenergy/detail.php?id=55259 [↩] [↩]
- Cour des comptes. La filière EPR : une dynamique nouvelle, des risques persistants. Paris: Cour des comptes, 2025. https://www.ccomptes.fr/fr/publications/la-filiere-epr-une-dynamique-nouvelle-des-risques-persistants [↩] [↩] [↩] [↩]
- IEA. Iceland – Countries & Regions. International Energy Agency, 2024. https://www.iea.org/countries/iceland/energy-mix#where-does-iceland-get-its-energy [↩] [↩] [↩]
- Ragnarsson, Á., Steingrímsson, B., & Thorhallsson, S. Geothermal Development in Iceland 2015–2019. Proceedings of the World Geothermal Congress 2020+1, 2021 [↩] [↩] [↩]
- IEA. Iceland: Climate Change Strategy. International Energy Agency, 2022. https://www.iea.org/policies/4549-iceland-climate-change-strategy [↩] [↩]
- IEA. China – Countries & Regions. International Energy Agency, 2022. https://www.iea.org/countries/china [↩] [↩]
- Zhou, N., et al. Carbon neutrality pathways for China. Nature Reviews Earth & Environment, 3, 630–645, 2022. https://doi.org/10.1038/s43017-022-00337-2 [↩] [↩]
- Zhang, S., Andrews-Speed, P., & Zhao, X. Political and institutional analysis of the successes and failures of China’s renewable energy policy. Energy Policy, 56, 331–340, 2013. https://doi.org/10.1016/j.enpol.2012.12.034 [↩] [↩]
- Netherlands Institute for Transport Policy Analysis (KiM). Cycling Facts 2022. Ministry of Infrastructure and Water Management, 2022. https://english.kimnet.nl/publications/publications/2022/06/16/cycling-facts-2022 [↩] [↩]
- Schepers, P., Twisk, D. A. M., Fishman, E., et al. The Dutch road to a high level of cycling safety. Safety Science, 92, 264–273, 2017. https://doi.org/10.1016/j.ssci.2015.06.005 [↩] [↩]
- Fishman, E., Schepers, P., & Kamphuis, C. B. M. Dutch Cycling: Quantifying the Health and Related Economic Benefits. American Journal of Public Health, 105(8), e13–e15, 2015. https://doi.org/10.2105/AJPH.2015.302724 [↩] [↩]
- International Energy Agency. Global EV Outlook 2024. Paris: IEA, 2024. https://www.iea.org/reports/global-ev-outlook-2024 [↩] [↩] [↩]
- Figenbaum, E., & Kolbenstvedt, M. Electromobility in Norway – Experiences and Opportunities. Institute of Transport Economics (TØI Report 1329/2015). https://www.toi.no/publications/electromobility-in-norway-experiences-and-opportunities-article32965-29.html [↩] [↩] [↩] [↩]
- Norwegian Road Federation (Opplysningsrådet for veitrafikken, OFV). Car Sales Statistics. https://ofv.no/en/car-sales [↩] [↩]
- World Bank. China’s Experience with High-Speed Rail Offers Lessons for Other Countries. World Bank Group, 2019. https://www.worldbank.org/en/news/press-release/2019/07/08/chinas-experience-with-high-speed-rail-offers-lessons-for-other-countries [↩] [↩] [↩]
- International Union of Railways. High-Speed Rail Atlas 2024. Paris: UIC, 2024. https://uic.org/passenger/highspeed/article/high-speed-data-and-atlas [↩] [↩]
- Xu, Y., & Zhu, S. Transport Infrastructure, Intra-Regional Inequality and Urban-Rural Divide: Evidence From China’s High-Speed Rail Construction. International Regional Science Review, 47(3), 378–406, 2024. https://doi.org/10.1177/01600176231177672 [↩] [↩]
- C. Le Renard, Les débuts du programme électronucléaire français (1945–1974): De l’exploratoire à l’industriel, Hérodote, Vol. 165, No. 2, pg. 53–66, 2017, https://doi.org/10.3917/her.165.0053 [↩] [↩]
- J. Quiggin, The 1970s French experience with nuclear power, Parliament of Australia, https://www.aph.gov.au/DocumentStore.ashx?id=3453bdb9-177a-435c-bfd8-6bfdc840ad04&subId=668820 [↩] [↩] [↩]
- New Zealand Ministry of Foreign Affairs and Trade, Iceland: green transition & renewable energy – September 2024, 2024, https://www.mfat.govt.nz/en/trade/mfat-market-reports/iceland-green-transition-and-renewable-energy-september-2024 [↩]
- IRENA, Renewable Capacity Statistics 2024, International Renewable Energy Agency, Abu Dhabi, 2024, https://www.irena.org/Publications/2024/Mar/Renewable-Capacity-Statistics-2024 [↩]
- F. Creutzig, et al., The underestimated potential of solar energy to mitigate climate change, Nature Energy, Vol. 2, 17140, 2017, https://doi.org/10.1038/nenergy.2017.140 [↩]
- B. Kong, Governing China’s energy in the context of global governance, Global Policy, Vol. 2, No. S1, pg. 51–65, 2011, https://doi.org/10.1111/j.1758-5899.2011.00120.x [↩] [↩]
- Z.-Y. Zhao, J. Zuo, L. Fan, G. Zillante, Impacts of renewable energy regulations on the structure of power generation in China, Renewable Energy, Vol. 36, No. 1, pg. 24–30, 2011, https://doi.org/10.1016/j.renene.2010.05.028 [↩]
- Y. Liu, A. Kokko, N. Lundin, Transitioning from feed-in tariffs to competitive auctions in China’s solar photovoltaic industry, Energy Policy, Vol. 155, 112325, 2021, https://doi.org/10.1016/j.enpol.2021.112325 [↩] [↩]
- U.S. Environmental Protection Agency, Sources of greenhouse gas emissions, https://www.epa.gov/ghgemissions/sources-greenhouse-gas-emissions [↩]
- ECMT, Implementing Sustainable Urban Travel Policies: National Peer Review: The Netherlands, OECD Publishing, Paris, 2001, https://doi.org/10.1787/9789282112779-en [↩]
- International Energy Agency, The Future of Rail: Opportunities for Energy and the Environment, Paris: IEA, 2019, https://www.iea.org/reports/the-future-of-rail [↩] [↩]
- J. Mason, America, the Netherlands, and the oil crisis: 50 years later, ITDP, https://www.itdp.org/wp-content/uploads/2019/01/America-The-Netherlands.pdf [↩] [↩]
- D. Hellema, The Netherlands and the oil crisis: business as usual, Amsterdam University Press, pg. 9–12, 2004 [↩] [↩]
- Government of the Netherlands, Ministry of Infrastructure and Water Management, Meerjarenprogramma Infrastructuur, Ruimte en Transport (MIRT), Rijksoverheid, https://www.rijksoverheid.nl/themas/bouwen-en-wonen/ruimtelijke-ordening-en-gebiedsontwikkeling/meerjarenprogramma-infrastructuur-ruimte-en-transport-mirt [↩]
- Government of the Netherlands (Rijksoverheid), Information on the tax-free bicycle commuting allowance (fietsvergoeding), https://www.government.nl/themes/transport/bicycles/bicycle-policy-in-the-netherlands [↩]
- Government of the Netherlands, Private vehicle and motorcycle tax (BPM), Government of the Netherlands, https://www.government.nl/themes/taxes-benefits-and-allowances/vehicle-tax/private-motor-vehicle-and-motorcycle-tax [↩]
- Department of Transportation, The dutch approach to bicycle mobility: retrofitting street design for cycling, U.S. Department of Transportation, https://international.fhwa.dot.gov/pubs/pl18004/chap02.cfm [↩] [↩] [↩]
- E. Figenbaum, Perspectives on Norway’s supercharged electric vehicle policy, Environmental Innovation and Societal Transitions, Vol. 25, pg. 14–34, 2017, https://doi.org/10.1016/j.eist.2016.11.002 [↩]
- Norsk elbilforening, Elbilbestand, https://elbil.no/om-elbil/elbilstatistikk/elbilbestand/ [↩]
- Norwegian Government, Notification – prolongation of VAT benefits for battery electric passenger vehicles, Ministry of Finance, 2024, https://www.regjeringen.no/contentassets/48c034b961c64d009eab5470dd565985/notification-prolongation-of-vat-benefits-for-battery-electric-passenger-vehicles-pdf-29.11.2024.pdf [↩]
- M. Mustafa, Welfare effects, carbon abatement costs, and market impacts of EV subsidies in Norway, Energy Economics, Vol. 157, 109218, 2026, https://doi.org/10.1016/j.eneco.2026.109218 [↩]
- Norwegian Tax Administration, VAT exemption for electric vehicles (§ 6-8), https://www.skatteetaten.no/en/rettskilder/type/handboker/merverdiavgiftshandboken/2023/M-6/M-6-8/ [↩] [↩]
- World Bank, China Transport Overview, 2014, https://www.worldbank.org/en/country/china/brief/china-transport [↩] [↩] [↩] [↩]
- Ministry of Transport of the People’s Republic of China, Notice on Carrying Out the National Transit Metropolis Demonstration Project, 2012, https://xxgk.mot.gov.cn/jigou/ysfws/202006/t20200623_3315626.html [↩]
- H. Pan, Q. Shen, M. Zhang, Influence of urban form on travel behaviour in four neighbourhoods of Shanghai, Urban Studies, Vol. 46, No. 2, pg. 275–294, 2009, https://doi.org/10.1177/0042098008099355 [↩]
- J. Pucher, Z.-R. Peng, N. Mittal, Y. Zhu, N. Korattyswaroopam, Urban Transport Trends and Policies in China and Their Impacts on Travel Behavior, Transport Reviews, Vol. 27, No. 4, pg. 379–410, 2007, https://doi.org/10.1080/01441640601168970 [↩]
- National Library of Medicine, Transport and public health in China: the road to a healthy future, 2017, https://pmc.ncbi.nlm.nih.gov/articles/PMC5704968/ [↩]
- J. Wang, Q. Wu, J. Liu, H. Yang, M. Yin, S. Chen, P. Guo, J. Ren, X. Luo, W. Linghu, Q. Huang, Vehicle emission and atmospheric pollution in China: Problems, progress, and prospects, PeerJ, Vol. 7, e6932, 2019, https://doi.org/10.7717/peerj.6932 [↩]
- A. D. Perl, A. R. Goetz, Corridors, hybrids and networks: Three global development strategies for high-speed rail, Journal of Transport Geography, Vol. 42, pg. 134–144, 2015, https://doi.org/10.1016/j.jtrangeo.2014.07.006 [↩] [↩] [↩] [↩]
- World Bank, High-Speed Railways in China: A Look at Construction Costs, 2019, https://openknowledge.worldbank.org/handle/10986/32336 [↩]
- Q. Shen, The impacts of high-speed railway on environmental sustainability: quasi-experimental evidence from China, Humanities and Social Sciences Communications, 2023, https://www.nature.com/articles/s41599-023-01587-5 [↩] [↩]
- Organization for Economic Co-operation and Development (OECD) & International Transport Forum, ITF Transport Outlook 2019, Paris: OECD Publishing, 2019, https://www.oecd-ilibrary.org/transport/itf-transport-outlook-2019_transp_outlook-en-2019-en [↩]
- J. Meckling, J. Nahm, The power of process: State capacity and climate policy, Governance, Vol. 31, No. 4, pg. 741–757, 2018, https://doi.org/10.1111/gove.12338 [↩]
- J. Meckling, J. Nahm, Strategic State Capacity: How States Counter Opposition to Climate Policy, Comparative Political Studies, Vol. 55, No. 3, pg. 493–528, 2022, https://doi.org/10.1177/00104140211024308 [↩]