Abstract
Diffractive waveguide optics are central to augmented reality (AR) displays but are constrained by trade-offs among image sharpness, chromatic aberration, transmission efficiency, and field of view (FOV). This study presents a physics-based model of the optical performance of a singular flat AR waveguide, focusing on modulation transfer function (MTF), chromatic aberration, and transmission losses. Using a custom Python simulation, four waveguide materials are evaluated under consistent systems. Field of view (FOV) tests also took place to present numerical representations of different FOV systems. The simulation incorporates principles of wave optics and diffraction theory to model how light propagates through the diffractive grating structures of the waveguide. By numerically calculating spatial frequency response and transmission behavior, the Python model allows controlled comparison of material properties and system geometry. This model incorporates adjustable parameters for grating geometry and wavelength dependence, enabling systematic exploration of optical design choice influence upon AR display performance. The central findings of this paper demonstrated promising performance of both PMMA and optical glass, indicating how the refractive index and material parameters influence image clarity and efficiency, providing insight into the design trade-offs required for high-performance AR waveguides. With the 93.37-93.39% transmission loss within the silicon nitride system, a 93.64-94.10% loss in the PMMA system, a 93.63-94.07% loss in the silica-titania system, and a 93.40-93.45% loss in the optical glass system, silicon nitride demonstrates the lowest transmission loss while having the highest average lateral chromatic aberration, but lowest chromatic spread. Silica-Titania has the highest MTF value. Because all four configurations transmit only approximately 6% of incident light, each demands a display-side brightness compensation of 15–17×, framing the results against power and thermal budget rather than as standalone “high-performance” claims. This figure rises to 17-29x upon evaluating FOV. FOV analysis confirms the inverse relationship between field of view and transmission reported in prior waveguide literature, demonstrating the model’s accuracy in its ability to reproduce expected behavior.
Introduction
With the rapid expansion of augmented reality (AR) glasses, researchers are consistently seeking ways to improve video quality, reduce manufacturing costs, and add new features to these devices. This continuous drive for improvement, particularly the adoption of artificial intelligence for recording and significant enhancements in overlay quality, has been especially prominent over the past decade.
The ultimate goal is to eliminate the use of phones and replace them with AR glasses: devices that are hard to lose, readily available to aid the public, and comfortable to wear. We can already see integrated AR glasses in our everyday lives being used to check messages, watch videos, and view daily fitness achievements. Technology like the modern smartphone already greatly maximizes convenience for the user, allowing a better quality of life and less time spent on menial tasks. However, with AR glasses, internet access is even easier. AR’s optics have multiple uses across different scenarios. For firefighters and surgeons this could be real-time information relayed during times of emergency.
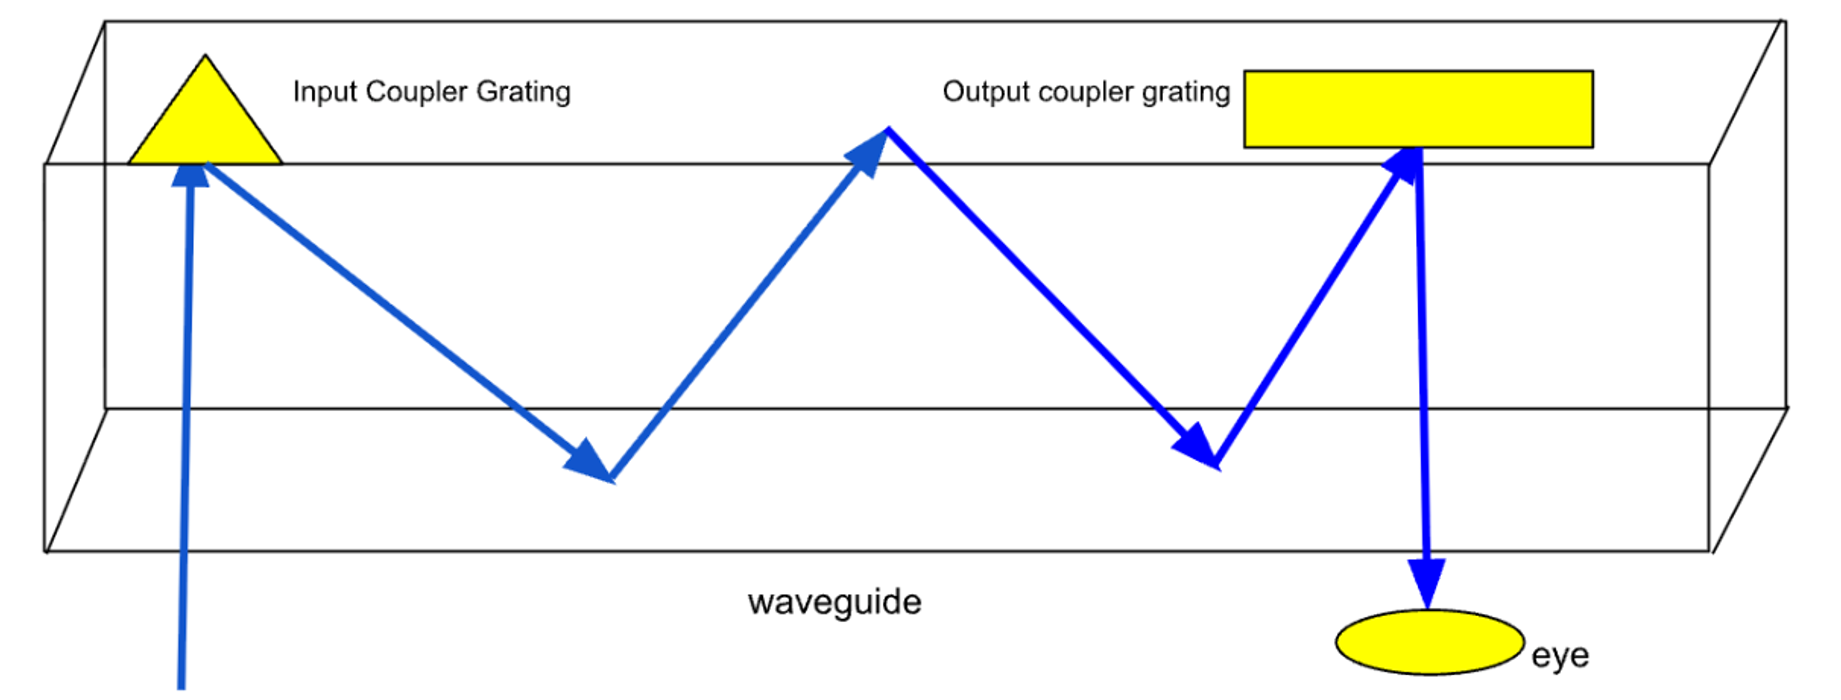
This study targets singular flat diffractive waveguides (shown in Figure 1) used in AR optics and examines them through a quantitative analysis. Specifically, through developing a model that allows numerical comparisons between different waveguides and material properties, this model allows researchers to determine optimal device architecture and material usage. Through optimizing material, waveguides can be lighter and more compact, resulting in a more comfortable and less bulky setup. With this, people would be more inclined to use AR goggles, especially when the overlays are seamlessly integrated with real life. Other optical models such as Zemax OpticStudio and Lumerical FDTD are capable of high-fidelity simulation but are typically configured around a singular optimization, such as coupler efficiency, rather than providing a joint evaluation of MTF, transmission, and chromatic aberration in one. Kress and Chatterjee (2020) review waveguide combiner simulation approaches for mixed reality headsets and identify that while rigorous electromagnetic solvers deliver high accuracy, their complexity makes rapid comparisons impractical for early stage design.1
Ultimately the contribution of this work is: a python model that jointly evaluates MTF, chromatic aberration, transmission, and FOV for a flat diffractive waveguide, rather than optimizing individual metrics, and a controlled four material comparison (silicon nitride, silica-titania, optical glass, and PMMA). This work does not claim higher physical fidelity than rigorous solvers such as Lumerical FDTD; the contribution is instead a low-setup, simple comparison test across metrics that those tools typically treat separately.2,3
Methods
This study presents an analysis of the parameters affecting the image quality of the output light from a simulated AR waveguide. It focuses on the transmission values of the light source’s intensity through various interfaces, including the thickness of the bulk material and the grating angle. The study quantifies the impact on the Modulation Transfer Function (MTF) by examining grating alignment. Using a custom Python simulation based on optical physics, this research compiles data quantitatively.
Material Selection
In the design of AR glasses, material selection is crucial. This study analyzes the material differences among four distinct materials: AR-grade glass, PMMA, silicon nitride, and silica-titania. Each material was evaluated across its grade-specific parameter range, spanning the minimum and maximum values reported in primary literature for that material class. Full parameter values are documented within the Github repository as linked above.
The silicon nitride used here refers to stoichiometric silicon nitride thin-film waveguide material. Silicon nitride exhibits a higher refractive index of 1.8-2.2 while maintaining a very low absorption coefficient (approximately 1 × 10⁻⁵), low root-mean-square (RMS) roughness (approximately 0.53 nm), and a moderate bulk scattering coefficient (approximately 0.03). In silicon nitride, scattering is primarily caused by bulk defects that scatter light throughout the material volume rather than by absorption mechanisms, consistent with loss characterizations reported for stoichiometric Si3N4 photonic platforms.4,5,6.
The second material analyzed is AR-grade glass, the most commonly used material in AR systems. Optical glass has a moderate refractive index of approximately 1.5 and a low absorption coefficient, which is three times higher than that of silicon nitride. However, compared to thin-film silicon nitride, optical glass exhibits higher RMS roughness values (approximately 5.0 nm) and a longer correlation length (approximately 1,000,000 nm). Consequently, transmission loss is primarily influenced by surface-roughness scattering.7,8,9
The coated polymer material modeled corresponds to an acrylic (PMMA) waveguide with an anti-reflection coating. PMMA has a refractive index of approximately 1.49, making it suitable for lightweight and low-cost optical waveguides. Although its RMS roughness is relatively low (0.87 nm), polymers exhibit shorter correlation lengths (approximately 300,000 nm), which lead to increased bulk scattering (10-5). One aspect not considered in this study is the additional absorption effects caused by vibrational overtones in the visible and near-infrared spectra.10, 11
Silica-titania waveguide films were selected due to their widespread use in typical optical waveguides. Using the lower bound values reported by Karasiński et al. (2022), the modeled parameters include a refractive index of approximately 1.8, an RMS roughness of approximately 0.5 nm, and a layer thickness of 190 nm, along with a correlation length of approximately 7300 nm. The primary source of loss in this material is scattering at the interface between the waveguide and the substrate.12,13,14
The silicon nitride and silica-titania cases represent thin-film integrated photonic implementations, whereas glass and PMMA are modeled as bulk/polymer waveguides. These differ in confinement, coupling, and loss mechanisms so the comparison holds the system-level optical architecture fixed in the model but does not assume an identical fabrication route is realizable for all four; the rankings should be read as model-level comparisons under matched optical assumptions, not as a claim of equal manufacturability.1
Image Sharpness – Modulation Transfer Function (MTF) Analysis
(1) 
Equation 1: Represents the optical spatial frequency cutoff found with D being eye diameter and
 being the eye focal length.
(2) ![\begin{equation*}\mathit{MTF}_{\mathit{diff}}(f) = \frac{2}{\pi}\left[\cos^{-1}\left(\frac{f}{f_c}\right) - \frac{f}{f_c}\sqrt{1 - \left(\frac{f}{f_c}\right)^2}\right]\end{equation*}](https://nhsjs.com/wp-content/ql-cache/quicklatex.com-d5d702d0415b1d5febcece4a924c3a84_l3.png "Rendered by QuickLaTeX.com")
Equation 2: Defines the MTF loss due to diffraction within the eye misalignment after exiting the out-coupler
MTF values are used to quantify image clarity and contrast. Used by many studies, the spatial frequency at which system MTF is evaluated in this study is 40 cycles/mm (0.04 cycles/μm), consistent with industry-standard benchmarks for AR display resolution assessment. MTF, such as MTF Grating, Diffractive MTF, Chromatic MTF, Roughness MTF, and Coupler MTF, defines the various factors that contribute to the ultimate MTF loss values. MTF Grating arises from the grating’s role as a periodic spatial modulator of the optical wavefront. In waveguide-based systems, surface-relief or volume gratings are commonly used as in-couplers and out-couplers, causing diffraction in different orders.15
(3) 
Equation 3: Defines the angular displacement for individual colors through grating and refractive index
Diffractive MTF models the MTF caused by misalignment in the eye. The MTF diffractive model used in this paper is derived from Watson’s (2013) paper using the diffractive limited mode, assuming no aberrations and no lens impurities. Results have demonstrated clearer performance for people with smaller pupils for MTF. This is modeled by, in Eq. 1 and Eq. 2, the cutoff spatial frequency (fc), the eye diameter (D), the given wavelength (𝜆), and the original spatial frequency (f). MTF Roughness is modeled as the MTF caused by scattering and surface irregularities in waveguides. Additionally, it is calculated assuming no sidewall imperfections. Results show that waveguides with lower RMS roughness and shorter correlation lengths maintain higher MTF values at higher spatial frequencies. MTF of Chromatic dispersion is modeled through analyzing the effects of lateral chromatic aberration as a wavelength-dependent transverse displacement of the retinal image.16, 17
Derived from the standard diffraction-grating relationship (eq. 3), this model introduces lateral blur approximated as a Gaussian point-spread function. Because the Fourier transform of a Gaussian function is itself Gaussian this yields a closed-form exponential attenuation of the MTF with spatial frequency, computed directly from the diffraction induced angular displacement at each wavelength rather than through numerical wavefront propagation. MTF for Coupler is modeled through a system-level MTF loss introduced by the diffractive in-coupler and out-coupler elements. While closely related to the grating structure, the coupler MTF accounts for contrast degradation due to finite diffraction efficiency and multiple coupling events as light enters and exits the waveguide.15,18
The components are combined multiplicatively to produce the system-level MTF, as given by MTF_system = MTF_diffraction × MTF_roughness × MTF_chromatic × MTF_grating × MTF_coupler. This formula treats each degradation source as an independent linear spatial filter, consistent with cascaded systems analysis in optical performance modeling. The multiplicative cascade is appropriate when the degradation mechanisms are statistically independent, which is assumed throughout this model. All five components are implemented analytically rather than through numerical wavefront propagation.
Chromatic Aberration
Chromatic aberration is the process in which light of different wavelengths is displaced, impacting the image by creating blur and misplaced colors. By following the framework presented by Tian et al. (2025), this study models the effects of diffractive couplers, material properties, and waveguide design on chromatic aberration. Modeled by equation 3, this effect is caused primarily by the wavelength of the colors. The angle that is used to model chromatic aberration is the standard grating-coupling condition relationship above, demonstrating the variation of diffraction angles between different wavelengths.17,18
Transmission
Transmission is defined by the brightness that is retained after the entire waveguide interaction. Compensation is the value that quantifies transmission loss relative to other models. Fresnel transmission losses were calculated through standard Snell’s law and Fresnel equations. Bulk Transmission models attenuation due to the absorption inside the bulk material. Directly coming from Beer-Lambert’s law, this transmission model accounts for bulk scattering with the absorption coefficient and the thickness of the material. Scatter transmission models the transmission loss due to scattering using a statistical model of this loss, assuming perfect conditions. Grating Transmission models the transmission loss due to the in-coupler and out-coupler gratings. Grating is calculated through the model utilized by Jha in the fabrication of grating couplers. In this model, coupling efficiency is governed by the grating period, duty cycle, effective refractive index, and diffraction conditions. Overall transmission is incorporated through a formula utilized by Ding Y by multiplying the transmission efficiency.19, 20,21
Code structure
The program is organized into several functional modules that process inputs, perform optical calculations, and render the resulting image. At the start, an input parameter module defines the system’s configuration, including wavelength values, waveguide thickness, and field of view parameters. These inputs are passed into an optical physics engine, calculating transmission loss MTF and the overall transmission efficiency for the set of parameters. The calculated optical metrics are sent to a data layer that compiles the outputs to structured data sets and simultaneously passed over to a visual overlay module that simulates how the optical performance affects the project’s AR image.
Together, these modules form a pipeline in which physical parameters are translated into quantitative optical metrics and finally into a visual representation of the AR display output.
(Github: https://github.com/connorwang3158/ModelingSingularFlatDiffractiveWaveguidesWithinARGlasses)
Results/Analysis
Comparison of MTF between in and out couplers across different materials
| Optical Glass | PMMA | Silicon Nitride | Silica Titania | |
| Transmission (fraction, 0–1) | ||||
| Fresnel | 0.9950 | 0.9950 | 0.9950 | 0.9950 |
| Bulk | 0.9918 – 0.9959 | 0.8954 – 0.9594 | 0.9961 – 0.9987 | 0.8979 – 0.9605 |
| Scatter | 0.9946 – 0.9976 | 0.9926 – 0.9976 | 0.9986 – 0.9994 | 0.9946 – 0.9986 |
| Grating 1 | 0.2666 | 0.2666 | 0.2666 | 0.2666 |
| Total | 0.2616 – 0.2635 | 0.2358 – 0.2539 | 0.2639 – 0.2647 | 0.2369 – 0.2544 |
| Loss (%) | 73.65 – 73.84 | 74.61 – 76.42 | 73.53 – 73.61 | 74.56 – 76.31 |
| MTF @ 40 cycles/mm (modulation, 0–1) | ||||
| Diffraction | 0.7710 | 0.7710 | 0.7710 | 0.7710 |
| Roughness | 0.9989 – 0.9995 | 0.9996 – 0.9999 | 1.0000 | 1.0000 |
| Chromatic | 0.9963 | 0.9963 | 0.9977 – 0.9978 | 0.9968 – 0.9969 |
| Grating | 0.9837 – 0.9844 | 0.9822 – 0.9825 | 0.9834 – 0.9852 | 0.9981 – 0.9989 |
| Coupler | 1.0000 | 1.0000 | 1.0000 | 1.0000 |
| System | 0.7548 – 0.7558 | 0.7541 – 0.7546 | 0.7564 – 0.7578 | 0.7671 – 0.7677 |
| Compensation (×) | 3.79 – 3.82 | 3.94 – 4.24 | 3.78 – 3.79 | 3.93 – 4.22 |
| Chromatic aberration (degrees, °) | ||||
| Red (663 nm) | 3.8346 – 3.8521 | 3.7948 – 3.8037 | 5.4897 – 5.5410 | 4.4070 – 4.4803 |
| Green (532 nm) | 5.1519 – 5.1664 | 5.1191 – 5.1264 | 6.5223 – 6.5648 | 5.6255 – 5.6862 |
| Blue (442 nm) | 6.0834 – 6.0957 | 6.0553 – 6.0616 | 7.2531 – 7.2893 | 6.4876 – 6.5394 |
| Spread | 2.2437 – 2.2488 | 2.2579 – 2.2605 | 1.7483 – 1.7633 | 2.0591 – 2.0806 |
| Optical Glass | PMMA | Silicon Nitride | Silica Titania | |
| Transmission (fraction, 0–1) | ||||
| Fresnel | 0.9950 | 0.9950 | 0.9950 | 0.9950 |
| Bulk | 0.9918 – 0.9959 | 0.8954 – 0.9594 | 0.9961 – 0.9987 | 0.8979 – 0.9605 |
| Scatter | 0.9946 – 0.9976 | 0.9926 – 0.9976 | 0.9986 – 0.9994 | 0.9946 – 0.9986 |
| Grating 1 | 0.2666 | 0.2666 | 0.2666 | 0.2666 |
| Grating 2 | 0.2505 | 0.2505 | 0.2505 | 0.2505 |
| Total | 0.0655 – 0.0660 | 0.0590 – 0.0636 | 0.0661 – 0.0663 | 0.0593 – 0.0637 |
| Loss (%) | 93.40 – 93.45 | 93.64 – 94.10 | 93.37 – 93.39 | 93.63 – 94.07 |
| MTF @ 40 cycles/mm (modulation, 0–1) | ||||
| Diffraction | 0.7710 | 0.7710 | 0.7710 | 0.7710 |
| Roughness | 0.9989 – 0.9995 | 0.9996 – 0.9999 | 1.0000 | 1.0000 |
| Chromatic | 0.9963 | 0.9963 | 0.9977 – 0.9978 | 0.9968 – 0.9969 |
| Grating | 0.9837 – 0.9844 | 0.9822 – 0.9825 | 0.9834 – 0.9852 | 0.9981 – 0.9989 |
| Coupler | 0.8521 | 0.8521 | 0.8521 | 0.8521 |
| System | 0.6432 – 0.6440 | 0.6426 – 0.6430 | 0.6446 – 0.6458 | 0.6537 – 0.6542 |
| Compensation (×) | 15.15 – 15.26 | 15.73 – 16.94 | 15.08 – 15.13 | 15.69 – 16.86 |
| Chromatic aberration (degrees, °) | ||||
| Red (663 nm) | 3.8346 – 3.8521 | 3.7948 – 3.8037 | 5.4897 – 5.5410 | 4.4070 – 4.4803 |
| Green (532 nm) | 5.1519 – 5.1664 | 5.1191 – 5.1264 | 6.5223 – 6.5648 | 5.6255 – 5.6862 |
| Blue (442 nm) | 6.0834 – 6.0957 | 6.0553 – 6.0616 | 7.2531 – 7.2893 | 6.4876 – 6.5394 |
| Spread | 2.2437 – 2.2488 | 2.2579 – 2.2605 | 1.7483 – 1.7633 | 2.0591 – 2.0806 |
Initially, comparisons were made across different materials while also examining the differences in performance between the in-coupler alone and the entire waveguide system. These results evaluate how each material behaves in isolation within the in-coupler interaction and how its effects change when incorporated into the full waveguide structure.
The results for glass in tables 1 and 2 show how glass waveguides are primarily limited by surface imperfections through scattering rather than bulk absorption, with the longer correlation length and higher RMS roughness contributing to the MTF loss. These results highlight the trade-off between mechanical stability, ease of fabrication, and optical performance. Glass produces a scatter transmission of 0.9946-0.9976, which is lower than silicon nitride (0.9986-0.9994) but comparable to silica-titania, directly reflecting its higher RMS roughness (~5.0 nm) and longer correlation length (~1,000,000 nm). Surface-roughness scattering therefore remains the dominant loss mechanism of optical glass waveguides even under well-engineered fabrication conditions. Compared to silicon nitride, glass is a much simpler material, but it may still require further refinement in terms of surface level optimization to reach the same performance. In this study, however, that level of refinement was applied to the parameters utilized on the glass.22, 23
The performance of PMMA waveguides is extremely similar to that of glass waveguides. PMMA offers a practical alternative to optical glass, producing double-coupler transmission loss of 93.64-94.10% and system MTF of 0.6426-0.6430, which is less than one percentage point of the corresponding glass values, while offering advantages in weight and manufacturing cost. The main setback to using PMMA is its slightly higher optical losses at longer propagation lengths, which could limit efficiency in larger-scale AR waveguide devices. However, to limit the size of AR waveguides, PMMA provides a promising direction for the future.10
Silicon nitride achieves the lowest double-coupler transmission loss (93.37–93.39%) and tightest chromatic spread (1.75–1.76°) of the four materials, demonstrating the strongest performance on those two metrics. However, silica-titania produces the highest system MTF (0.6537–0.6542), so no single material dominates across every metric simultaneously; the optimal choice depends on which performance dimension is prioritized.While it has promise to be a great optical waveguide, silicon nitride is not commonly used due to its complex fabrication processes, making it currently not a viable market option. It requires high-temperature deposition and precise control over film stress to prevent cracking or delamination. Therefore, despite the optical advantages, the implementation of silicon nitride is currently not practical at scale.6, 4
Silica-titania is also a promising material due to its slightly higher MTF values, and similar performance to PMMA in terms of transmission loss. This behavior arises from titania’s dense atomic structure and high electronic polarizability which support an elevated refractive index while maintaining optical transparency across the visible spectrum, resulting in reduced wavelength-dependent angular dispersion. However, PMMA is more attractive due to how it’s lightweight, cheap, and easy to manufacture.13
The double-coupler transmission of ~6% implies a display-side brightness compensation of ~15–17×. This is consistent with reported AR light-engine analyses, where coupler leakage and exit-pupil-expansion losses cap overall system efficiency near 4%, requiring light engines above one million nits. Higher source luminance raises power draw and localized heating, constraining battery life and thermal design. These transmission numbers should be read as inputs to a power/thermal budget, not as standalone performance claims.24,25
Comparison of FOV
FOV systems are compared utilizing realistic, simulated data as a comparison of the correlation between FOV and other metrics that we previously used to model images. The parameters were set to realistically simulate the numerical differences of the parameters between different FOV systems based on prior waveguide literature.
The adjustment of waveguide and grating parameters across different FOV regimes is required because the field of view is physically coupled to propagation geometry, diffraction conditions, and cumulative optical loss. Increasing FOV necessitates a larger angular spread of guided rays, which directly increases the diffraction angles imposed by the in-coupler and out-coupler gratings according to the grating equation (Equation 3). Prior studies show that
larger diffraction angles amplify wavelength-dependent angular dispersion, leading to increased lateral chromatic aberration.1,18
| Transmission | Small | Medium | Large |
| Fresnel | 0.945749 | 0.949760 | 0.952733 |
| Bulk | 0.998533 | 0.996740 | 0.994668 |
| Scatter | 0.808688 | 0.715502 | 0.639673 |
| Grating 1 | 0.281000 | 0.266580 | 0.251334 |
| Grating 2 | 0.264000 | 0.250452 | 0.236129 |
| Total | 0.056654 | 0.045223 | 0.035976 |
| Loss | 94.33% | 95.48% | 96.40% |
| MTF @40 cycles/mm | |||
| Diffraction | 0.846837 | 0.816402 | 0.770958 |
| Roughness | 0.958952 | 0.936055 | 0.915583 |
| Chromatic | 0.999039 | 0.995869 | 0.992257 |
| Grating | 0.936106 | 0.998513 | 0.975646 |
| Coupler | 0.852144 | 0.852144 | 0.852144 |
| System | 0.647169 | 0.647552 | 0.582314 |
| Brightness Compensation | 16.769x | 22.113x | 29.186x |
| Chromatic Aberration | |||
| Red (663nm) | -0.8979° | 0.4635° | 6.2018° |
| Green (532nm) | -0.2063° | 1.8584° | 8.1144° |
| Blue (442nm) | 0.2488° | 2.8431° | 9.4626° |
| Spread | 1.1467° | 2.3795° | 3.2608° |
The transmission and MTF results show a clear dependence on FOV, reflecting the tradeoffs imposed by diffractive waveguide geometry. In the small-FOV configuration, overall transmission is relatively high and stable due to lower diffraction angles and reduced interaction length within the waveguide. These conditions minimize chromatic dispersion and scattering losses, preserving color alignment and geometric fidelity of the projected image.
When comparing Angular Resolution to Total FOV, an inverse proportional relationship is present between frequency and contrast. When considering this relation alongside numerical results, it becomes clear that while a small FOV preserves chromatic fidelity and reduces aberrations, its restricted angular spectrum of guided rays limits the transmission of certain spatial frequencies. Numerically, the small and medium FOV configurations retain comparable system MTF values (0.647169 and 0.647552 respectively), while the enlarged FOV configuration shows a more pronounced decline to 0.582314, consistent with the increased scattering and diffraction losses imposed by wider angular spreads. The partial spatial frequency filtering by the anticipated angular resolution theory is therefore more evident in transmission and chromatic aberration than in the system level MTF at the spatial frequency evaluated.25
Related Works
The computational approaches to AR diffractive waveguide simulation generally fall somewhere between two extremes: rigorous electromagnetic solvers and simplified analytical models (which this model falls into). Commercial tools like Zemax OpticStudio, CODE V, and Lumerical FDTD sit toward the rigorous end. Kress and Chatterjee’s (2020) survey of waveguide combiner design for mixed reality headsets makes a similar point: rigorous solvers are well suited to final device validation, but their complexity works against them when a designer just needs to screen several materials quickly. Zhang et al. (2024) takes a more analytical approach, by using a grating-equation-based framework to model dispersion compensation in a double-layer diffractive metasurface design. The model by Zhang et al. 2024 is similar to the one utilized in this study, though it is built around chromatic dispersion rather than a broader comparison of materials.1,26
On the MTF side, Goodsell et al. (2024) built an optimization framework for AR waveguide in-coupler architectures and reported unoptimized MTF values for optical glass as a baseline. The system MTF this model produces for optical glass in the single-coupler configuration, 0.7548 to 0.7558, comes within 5% of those unoptimized values. That said, only optical glass was confirmed when compared to Goodsell’s study as the other materials have not been analyzed by any other outside measurement. Separately, Nilsen et al.(2025) compared glass and plastic waveguides for AR use and found their optical efficiencies to be extremely close to one another, lining up with the findings within this model that glass and PMMA come out within less than a percentage point of each other.15,10,20
The transmission side of this model draws on prior work. In-coupler efficiency follows Jha’s (2021) grating coupler fabrication model, where coupling depends on grating period, duty cycle, effective refractive index, and diffraction conditions. The overall transmission is then built up as the product of the Fresnel, bulk, scatter, and grating terms, following the approach laid out by Ding. Comparing the in-coupler transmission values from this model against Zhao et al. (2024), the two fall within about 10% of each other. Where this model falls short of the solvers mentioned above is how it handles the physics: it relies on scalar diffraction and treats each loss term independently so it can’t capture cross-coupling between loss mechanisms, polarization-dependent grating efficiency, or the way coupling efficiency shifts across different points on the waveguide aperture.3, 21
Chromatic aberration follows Tian et al.s work on an achromatic metasurface waveguide, which frames wavelength-dependent angular displacement through diffractive coupling. The underlying idea of chromatic displacement as a transverse shift in the retinal image goes back further, to Thibos (1987); here it’s captured analytically as a Gaussian point-spread function, which gives a closed-form exponential MTF attenuation. The angular spread values that come out of the double-coupler configuration sit in a range broadly consistent with what’s reported for diffractive waveguides.17,18
Conclusion
This study presented a computational model for evaluating optical performance trade-offs in singular diffractive AR waveguides, jointly assessing MTF, chromatic aberration, and transmission efficiency across four candidate materials under grade-specific parameter ranges. Silicon nitride produced the lowest transmission loss and lowest chromatic spread of the materials tested, while having the highest total chromatic aberration, whereas silica-titania achieved the highest system MTF; no single material produced the best results across every single metric, and PMMA and optical glass remained closely comparable to one another throughout. Partial validation against Goodsell et al.(2024) for optical glass MTF and against Zhao et al. (2024) for in-coupler transmission supports the reliability of the underlying model, though this validation does not yet extend to silicon nitride, PMMA, or silica-titania individually.
Optical performance alone, however, does not determine which material is the right choice for a commercial AR product, and cost is an important consideration. Silicon nitride comes with the steepest production cost relative to the optical glass and PMMA alternatives.6, 4
Because all four double-coupler configurations transmitted only a small fraction of incident light, the results point to a real brightness compensation cost aside from the material comparison. Higher output light sources, greater power draw, and increased heat generation all add to increase the materials cost and battery demand in a decision. All in all, these results support the model’s use as an early-stage screening tool for weighing optical performance against fabrication cost and power budget when comparing waveguide materials and architectures rather than as a replacement for rigorous electromagnetic solvers or a finished, market-ready design recommendation.24
Limitations
This model relies on several simplifications that constrain how far its results can be generalized. Chromatic aberration is modeled only in the lateral diffraction; longitudinal chromatic aberration is not modeled numerically. Diffraction is non-vector, and polarization and coherence effects are not modeled. As a result, this model can only be considered an early stage validation for designing waveguides. In addition, the same optical architecture was used for the material comparison, however when manufacturing, these optical architectures are not necessarily ideal, and given the material and the ranking should be read as model-level comparisons rather than a claim of equal realizability.3, 27
Future Works
Future extensions of this model could incorporate vector diffraction and polarization-dependent effects, add longitudinal chromatic aberration modeling, and validate MTF and transmission predictions for silicon nitride, PMMA, and silica-titania against measured or independently published data. Beyond these direct extensions, the model in its current form could be used to explore other waveguide architectures beyond the one testing within this study. It could be used to study further materials under different grating geometries or FOV targets,
and serve as a starting point for coupling this kind of fast multi-metric screening with more rigorous electromagnetic solvers for final-stage design validation.18,27,28,29,30
Acknowledgements
I thank my mentor Thomas Iken for his guidance throughout this project from introducing me to the research process to helping me find the resources that I needed.
References
- B. C. Kress, I. Chatterjee. Waveguide combiners for mixed reality headsets: a nanophotonics design perspective. Nanophotonics. Vol. 10, pg. 41–74, 2020 https://doi.org/10.1515/nanoph-2020-0410 [↩] [↩] [↩] [↩]
- J. Goodsell, D. K. Nikolov, A. Nick Vamivakas, J. P. Rolland. Framework for optimizing ar waveguide in-coupler architectures. Optics Express. Vol. 32, pg. 9967, 2024 https://doi.org/10.1364/OE.515544 [↩]
- Z. Zhao, Y.-H. Lee, X. Feng, M. J. Escuti, L. Lu, B. Silverstein. Theoretical efficiency limit of diffractive input couplers in augmented reality waveguides. Optics Express. Vol. 32, pg. 12340, 2024 https://doi.org/10.1364/OE.519027 [↩] [↩] [↩]
- D. J. Blumenthal, R. Heideman, D. Geuzebroek, A. Leinse, C. Roeloffzen. Silicon nitride in silicon photonics. Proceedings of the IEEE. Vol. 106, pg. 2209–2231, 2018 https://doi.org/10.1109/JPROC.2018.2861576 [↩] [↩] [↩]
- C. G. H. Roeloffzen, M. Hoekman, E. J. Klein, L. S. Wevers, R. B. Timens, D. Marchenko, D. Geskus, R. Dekker, A. Alippi, R. Grootjans, A. Van Rees, R. M. Oldenbeuving, J. P. Epping, R. G. Heideman, K. Worhoff, A. Leinse, D. Geuzebroek, E. Schreuder, P. W. L. Van Dijk, I. Visscher, C. Taddei, Y. Fan, C. Taballione, Y. Liu, D. Marpaung, L. Zhuang, M. Benelajla, K.-J. Boller. Low-loss si3n4 triplex optical waveguides: technology and applications overview. IEEE Journal of Selected Topics in Quantum Electronics. Vol. 24, pg. 1–21, 2018 https://doi.org/10.1109/JSTQE.2018.2793945 [↩]
- M. Blasco, S. Dacunha, C. Dominguez, J. Faneca. Silicon nitride stoichiometry tuning for visible photonic integrated components. Applied Physics Letters. Vol. 124, pg. 221104, 2024 https://doi.org/10.1063/5.0204582 [↩] [↩] [↩]
- R. Sprengard. High‐Index glass wafers open a path to mass‐marketing ar glasses. Information Display. Vol. 36, pg. 30–33, 2020 https://doi.org/10.1002/msid.1114 [↩]
- G. C. Righini, A. Chiappini. Glass optical waveguides: a review of fabrication techniques. Optical Engineering. Vol. 53, pg. 071819, 2014 https://doi.org/10.1117/1.OE.53.7.071819 [↩]
- J. P. Dakin, W. A. Gambling. Angular distribution of light scattering in bulk glass and fibre waveguides. Optics Communications. Vol. 6, pg. 235–238, 1972 https://doi.org/10.1016/0030-4018(72)90182-4 [↩]
- K. Nilsen, Y. Ding, S.-L. Lee, S.-T. Wu. Comparisons of glass and plastic waveguides for augmented reality glasses. Optics Express. Vol. 33, pg. 20051, 2025 https://doi.org/10.1364/OE.562679 [↩] [↩] [↩]
- W. Groh. Overtone absorption in macromolecules for polymer optical fibers. Die Makromolekulare Chemie. Vol. 189, pg. 2861–2874, 1988 https://doi.org/10.1002/macp.1988.021891213 [↩]
- D. J. Channin, J. M. Hammer, M. T. Duffy. Scattering in zno-sapphire optical waveguides. Applied Optics. Vol. 14, pg. 923, 1975 https://doi.org/10.1364/AO.14.000923 [↩]
- P. Karasiński, M. Zięba, E. Gondek, J. Nizioł, S. Gorantla, K. Rola, A. Bachmatiuk, C. Tyszkiewicz. Sol-gel derived silica-titania waveguide films for applications in evanescent wave sensors—comprehensive study. Materials. Vol. 15, pg. 7641, 2022 https://doi.org/10.3390/ma15217641 [↩] [↩]
- J. Nizioł, E. Gondek, P. Karasiński. Changes in optical parameters of sio2:tio2 films obtained by sol-gel method observed as a result of thermal treatment. Materials. Vol. 14, pg. 2290, 2021 https://doi.org/10.3390/ma14092290 [↩]
- J. Goodsell, D. K. Nikolov, A. Nick Vamivakas, J. P. Rolland. Framework for optimizing ar waveguide in-coupler architectures. Optics Express. Vol. 32, pg. 9967, 2024 https://doi.org/10.1364/OE.515544 [↩] [↩] [↩]
- A. B. Watson. A formula for the mean human optical modulation transfer function as a function of pupil size. Journal of Vision. Vol. 13, pg. 18, 2013 https://doi.org/10.1167/13.6.18 [↩]
- L. N. Thibos. Calculation of the influence of lateral chromatic aberration on image quality across the visual field. Journal of the Optical Society of America A. Vol. 4, pg. 1673, 1987 https://doi.org/10.1364/JOSAA.4.001673 [↩] [↩] [↩]
- Z. Tian, X. Zhu, P. A. Surman, Z. Chen, X. W. Sun. An achromatic metasurface waveguide for augmented reality displays. Light: Science & Applications. Vol. 14, pg. 94, 2025 https://doi.org/10.1038/s41377-025-01761-w [↩] [↩] [↩] [↩] [↩]
- F. P. Payne, J. P. R. Lacey. A theoretical analysis of scattering loss from planar optical waveguides. Optical and Quantum Electronics. Vol. 26, pg. 977–986, 1994 https://doi.org/10.1007/BF00708339 [↩]
- P. Jha. Design and fabrication of grating couplers. University of Illinois Urbana-Champaign, 2021 [↩] [↩]
- Y. Ding. Visual experience enhancement in augmented reality waveguide displays. [↩] [↩]
- G. C. Righini, A. Chiappini. Glass optical waveguides: a review of fabrication techniques. Optical Engineering. Vol. 53, pg. 071819, 2014 https://doi.org/10.1117/1.OE.53.7.071819 [↩]
- J. P. Dakin, W. A. Gambling. Angular distribution of light scattering in bulk glass and fibre waveguides. Optics Communications. Vol. 6, pg. 235–238, 1972 https://doi.org/10.1016/0030-4018(72)90182-4 [↩]
- Y. Qian, Z. Yang, S.-C. Chen, Y. Ma, Y.-C. Chen, H.-S. Chen, C.-L. Lin, S.-T. Wu. Power consumption of light engines for emerging augmented reality glasses: perspectives and challenges. Advanced Photonics. Vol. 7, 2025 https://doi.org/10.1117/1.AP.7.3.034001 [↩] [↩]
- Y. Ding, Y. Gu, Q. Yang, Z. Yang, Y. Huang, Y. Weng, Y. Zhang, S.-T. Wu. Breaking the in-coupling efficiency limit in waveguide-based ar displays with polarization volume gratings. Light: Science & Applications. Vol. 13, pg. 185, 2024 https://doi.org/10.1038/s41377-024-01537-8 [↩] [↩]
- J. Zhang, S. Liu, W. Zhang, S. Jiang, D. Ma, L. Xu, M. Yang, Q. Jiao, X. Tan. Study of the dispersion compensation double-layer diffractive optical components based on metasurface and grating, and their application in augmented reality displays. Materials. Vol. 17, pg. 5291, 2024 https://doi.org/10.3390/ma17215291 [↩]
- R. Duplov. Exact formula for longitudinal chromatic aberration of a thick lens through design parameters. Optical Engineering. Vol. 62, 2023 https://doi.org/10.1117/1.OE.62.11.115102 [↩] [↩]
- M. Khorasaninejad, A. Y. Zhu, C. Roques-Carmes, W. T. Chen, J. Oh, I. Mishra, R. C. Devlin, F. Capasso. Polarization-insensitive metalenses at visible wavelengths. Nano Letters. Vol. 16, pg. 7229–7234, 2016 https://doi.org/10.1021/acs.nanolett.6b03626 [↩]
- S.-H. Cho, J.-S. Lee, D.-H. Baek, W. J. Choi, Y.-W. Choi. Multifocal waveguide-based display in augmented reality. Applied Optics. Vol. 64, pg. 2632, 2025 https://doi.org/10.1364/AO.553392 [↩]
- J. Kim, Y. Jeong, M. Stengel, K. Akşit, R. Albert, B. Boudaoud, T. Greer, J. Kim, W. Lopes, Z. Majercik, P. Shirley, J. Spjut, M. McGuire, D. Luebke. Foveated ar: dynamically-foveated augmented reality display. ACM Transactions on Graphics. Vol. 38, pg. 1–15, 2019 https://doi.org/10.1145/3306346.3322987 [↩]