Abstract
Background/Objective: Patients manage eczema at home with skin care between doctor visits. There are already some digital tools for eczema care, mainly focusing on photo analysis and information access. Eczema flare-ups are linked to many environmental factors. A patient’s condition changes over time, and each patient responds differently even under the same environmental conditions. At-home self-care needs daily tracking. We built SkinGuard, a low-cost prototype to monitor these factors and track skin changes over time.
Methods: We built a portable system using off-the-shelf electronic components and a standard Android smartphone to record key factors that matter to eczema. We designed a Skin Condition Index (SCI) to weigh multiple inputs and combine them into one metric for tracking each user over time. We call ChatGPT or Claude APIs to generate natural-language summaries. Tests were conducted using seven calibration states. Data were collected from three volunteer users and de-identified (102 sessions, 510 readings).
Results: Our prototype is effective in calculating the SCI based on the measurement of the skin humidity, environment parameters and skin pictures. The skin hydration sensor is calibrated with R² = 0.9904 and RMSE = 2.91 AU. The symmetrical site agreement was fair (ICC = 0.77) which needs further improvement.
Conclusion: We successfully developed an eczema monitoring tool, which can be easily used at home to measure, record and track the symptom development and skin-care action effectiveness. To make it from a prototype to a product, we will focus on improving the reliability and repeatability of the system.
Keywords: eczema; prototype; skin hydration; Skin Condition Index; longitudinal monitoring; patient-generated health data
Introduction
Eczema, also called atopic dermatitis, is a chronic skin condition affecting both children and adults1,2. It causes itching and dryness, and may lead to more severe inflammation during flare-ups3. Patients do daily skin care, such as moisturizing, to manage it4. Because symptoms and environmental factors affecting eczema change from day to day, tracking over time could be more helpful for self-care.
Doctors use SCORAD, EASI, and POEM to measure eczema severity5,6,7. But these measures are usually used in clinical care or research, not for a family’s daily home use. For example, SCORAD is a widely used metric that relies heavily on doctor’s professional observations. Environmental factors like humidity and temperature matter for eczema8,9, but weather reports only tell the humidity and temperature for a large region, which may differ a lot from the room where the individual lives. Even with a humidity and temperature tracking device, patients don’t have an easy way to connect them to their skin symptoms. Furthermore, without clear records linking skin-care actions to specific symptoms and environmental conditions, patients usually have to rely on their memory alone.
Current analysis shows that there are some apps, teledermatology, and wearable sensors that can support remote eczema management10,11,12. Some studies used mobile apps and smartphone-based records13,14,15,16. Some apps provide skincare reference databases, while other systems involve patient-operated devices17 and scratch sensors18. These approaches typically capture a single signal related to eczema management. So far, we have not found one that brings together environmental sensing and image capture in a single system to log and track these factors alongside symptoms over time, which can provide patients with record-based trends and summaries.
As long-time eczema patients, we understand how important it is to have such an easy-use portable device. We started building a prototype. We didn’t pursue clinic-grade accuracy on any single reading—just consistent enough to show change and trend.
Methods
Engineering Architecture
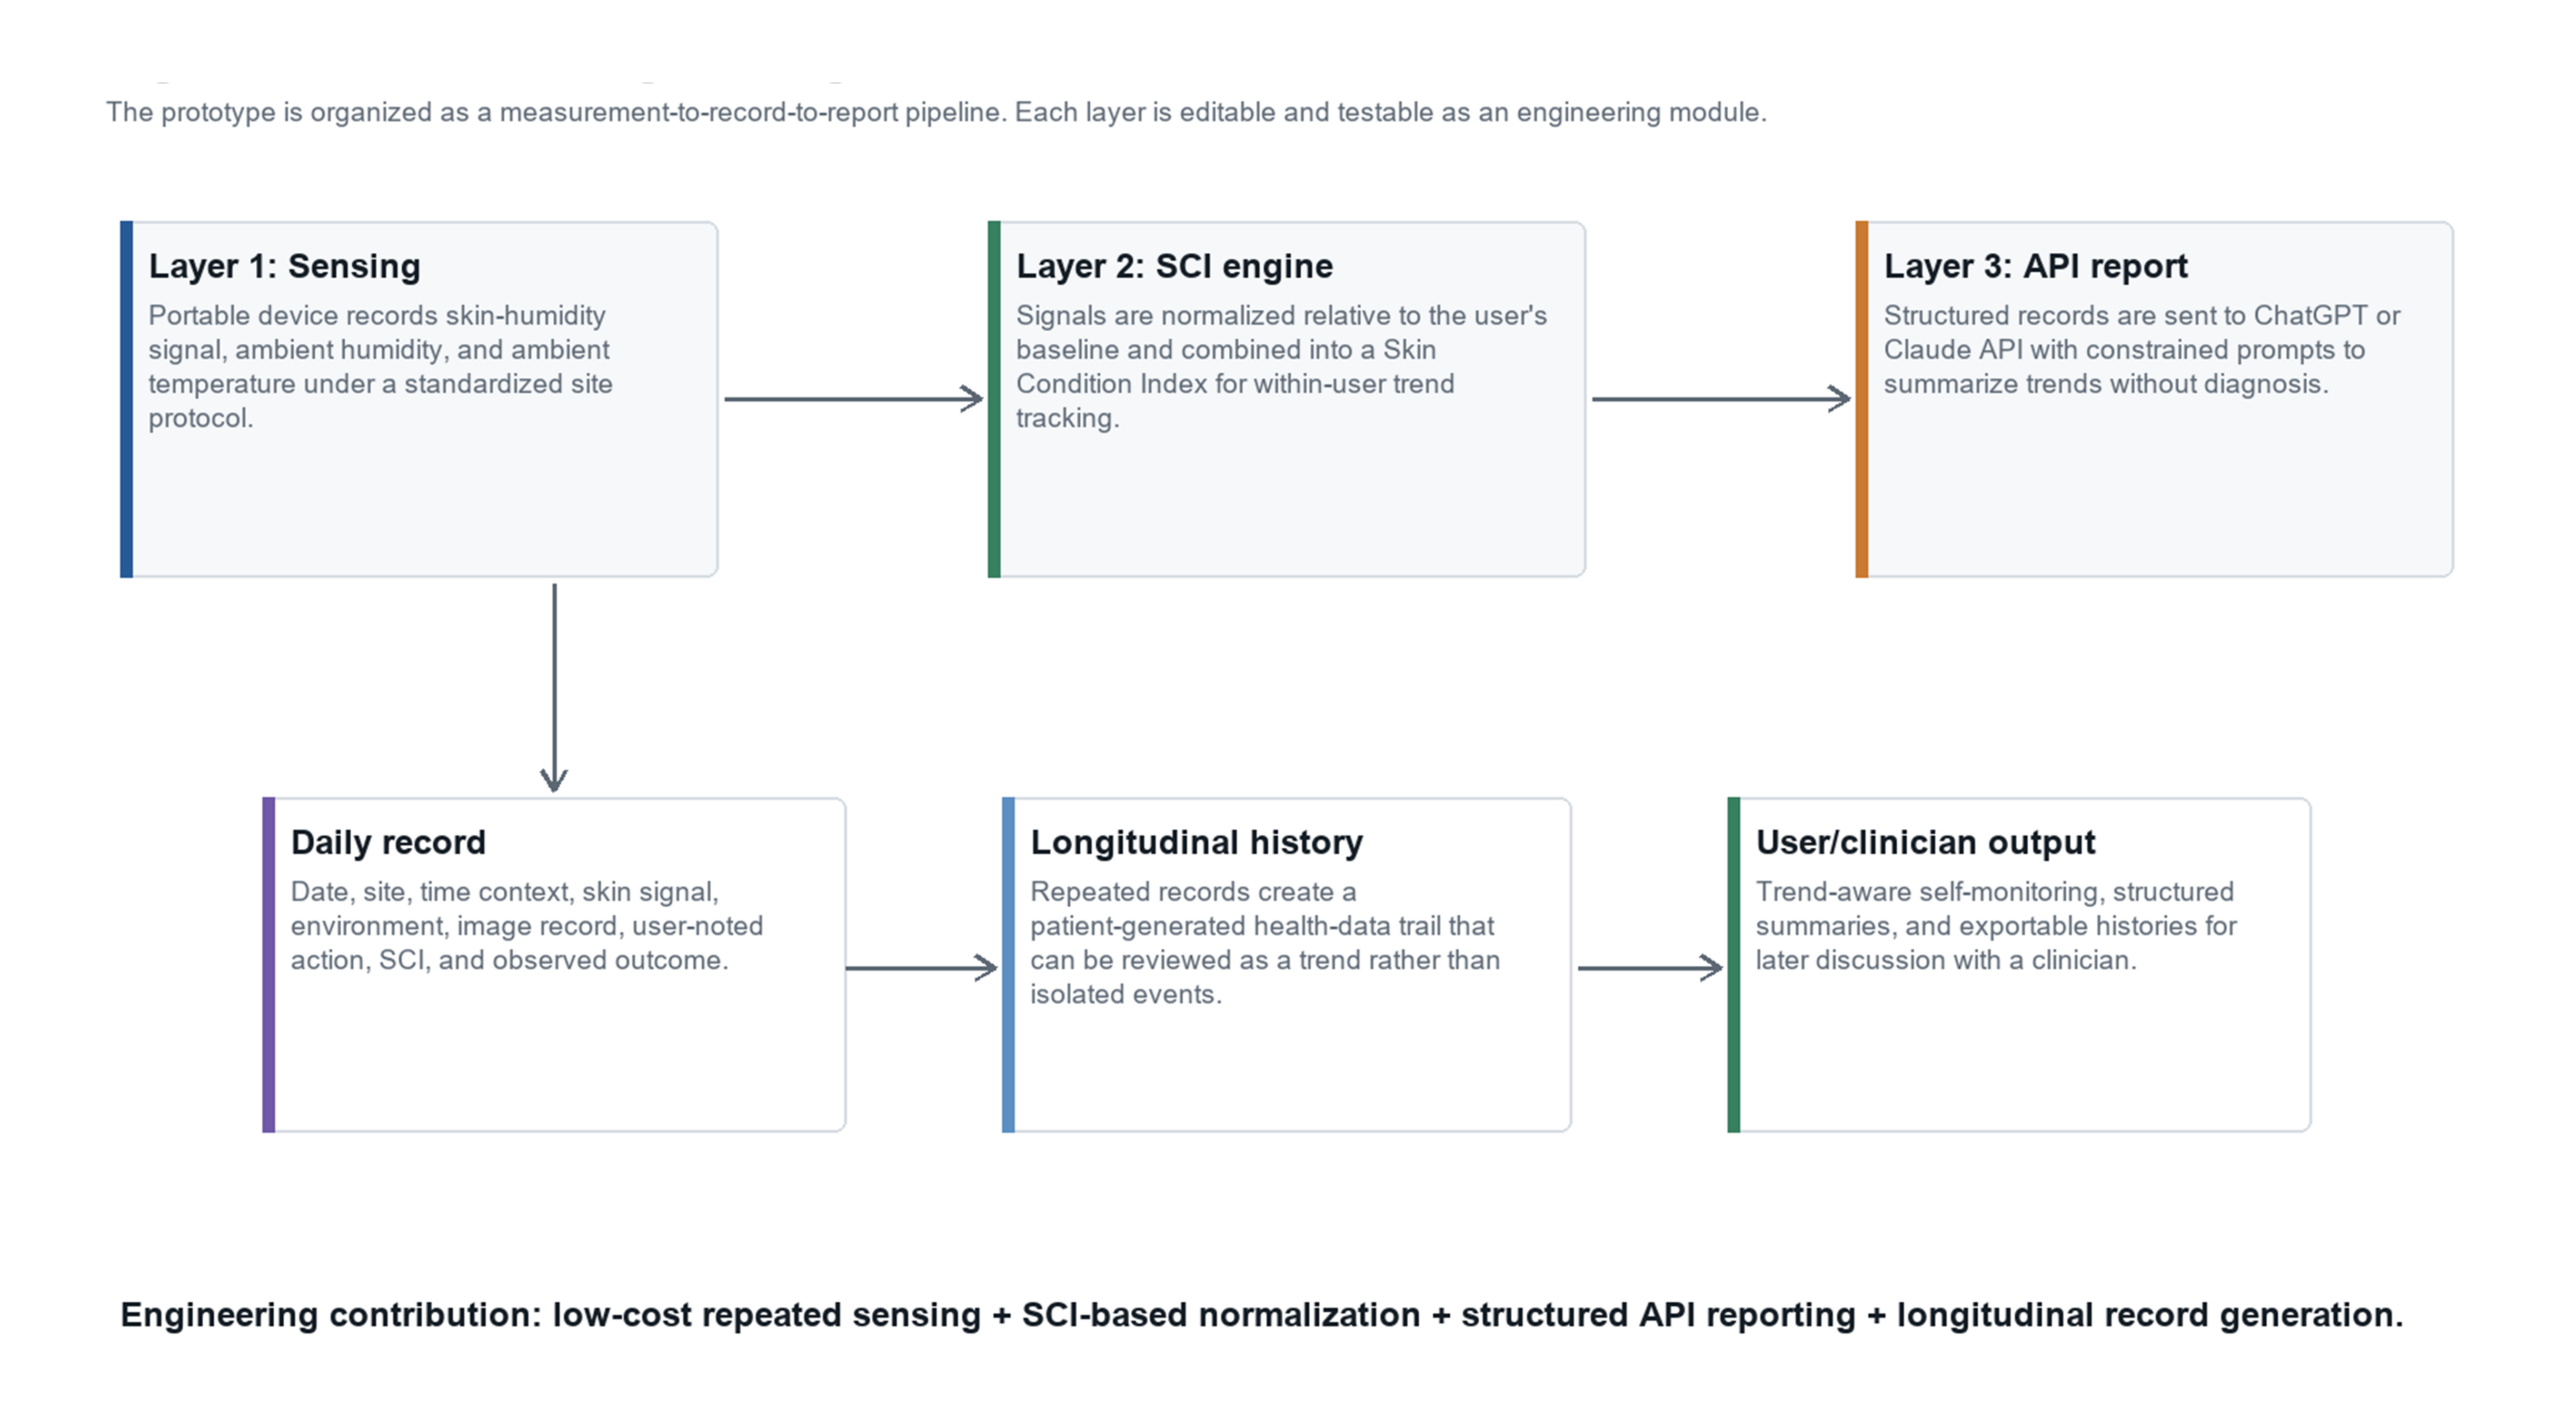
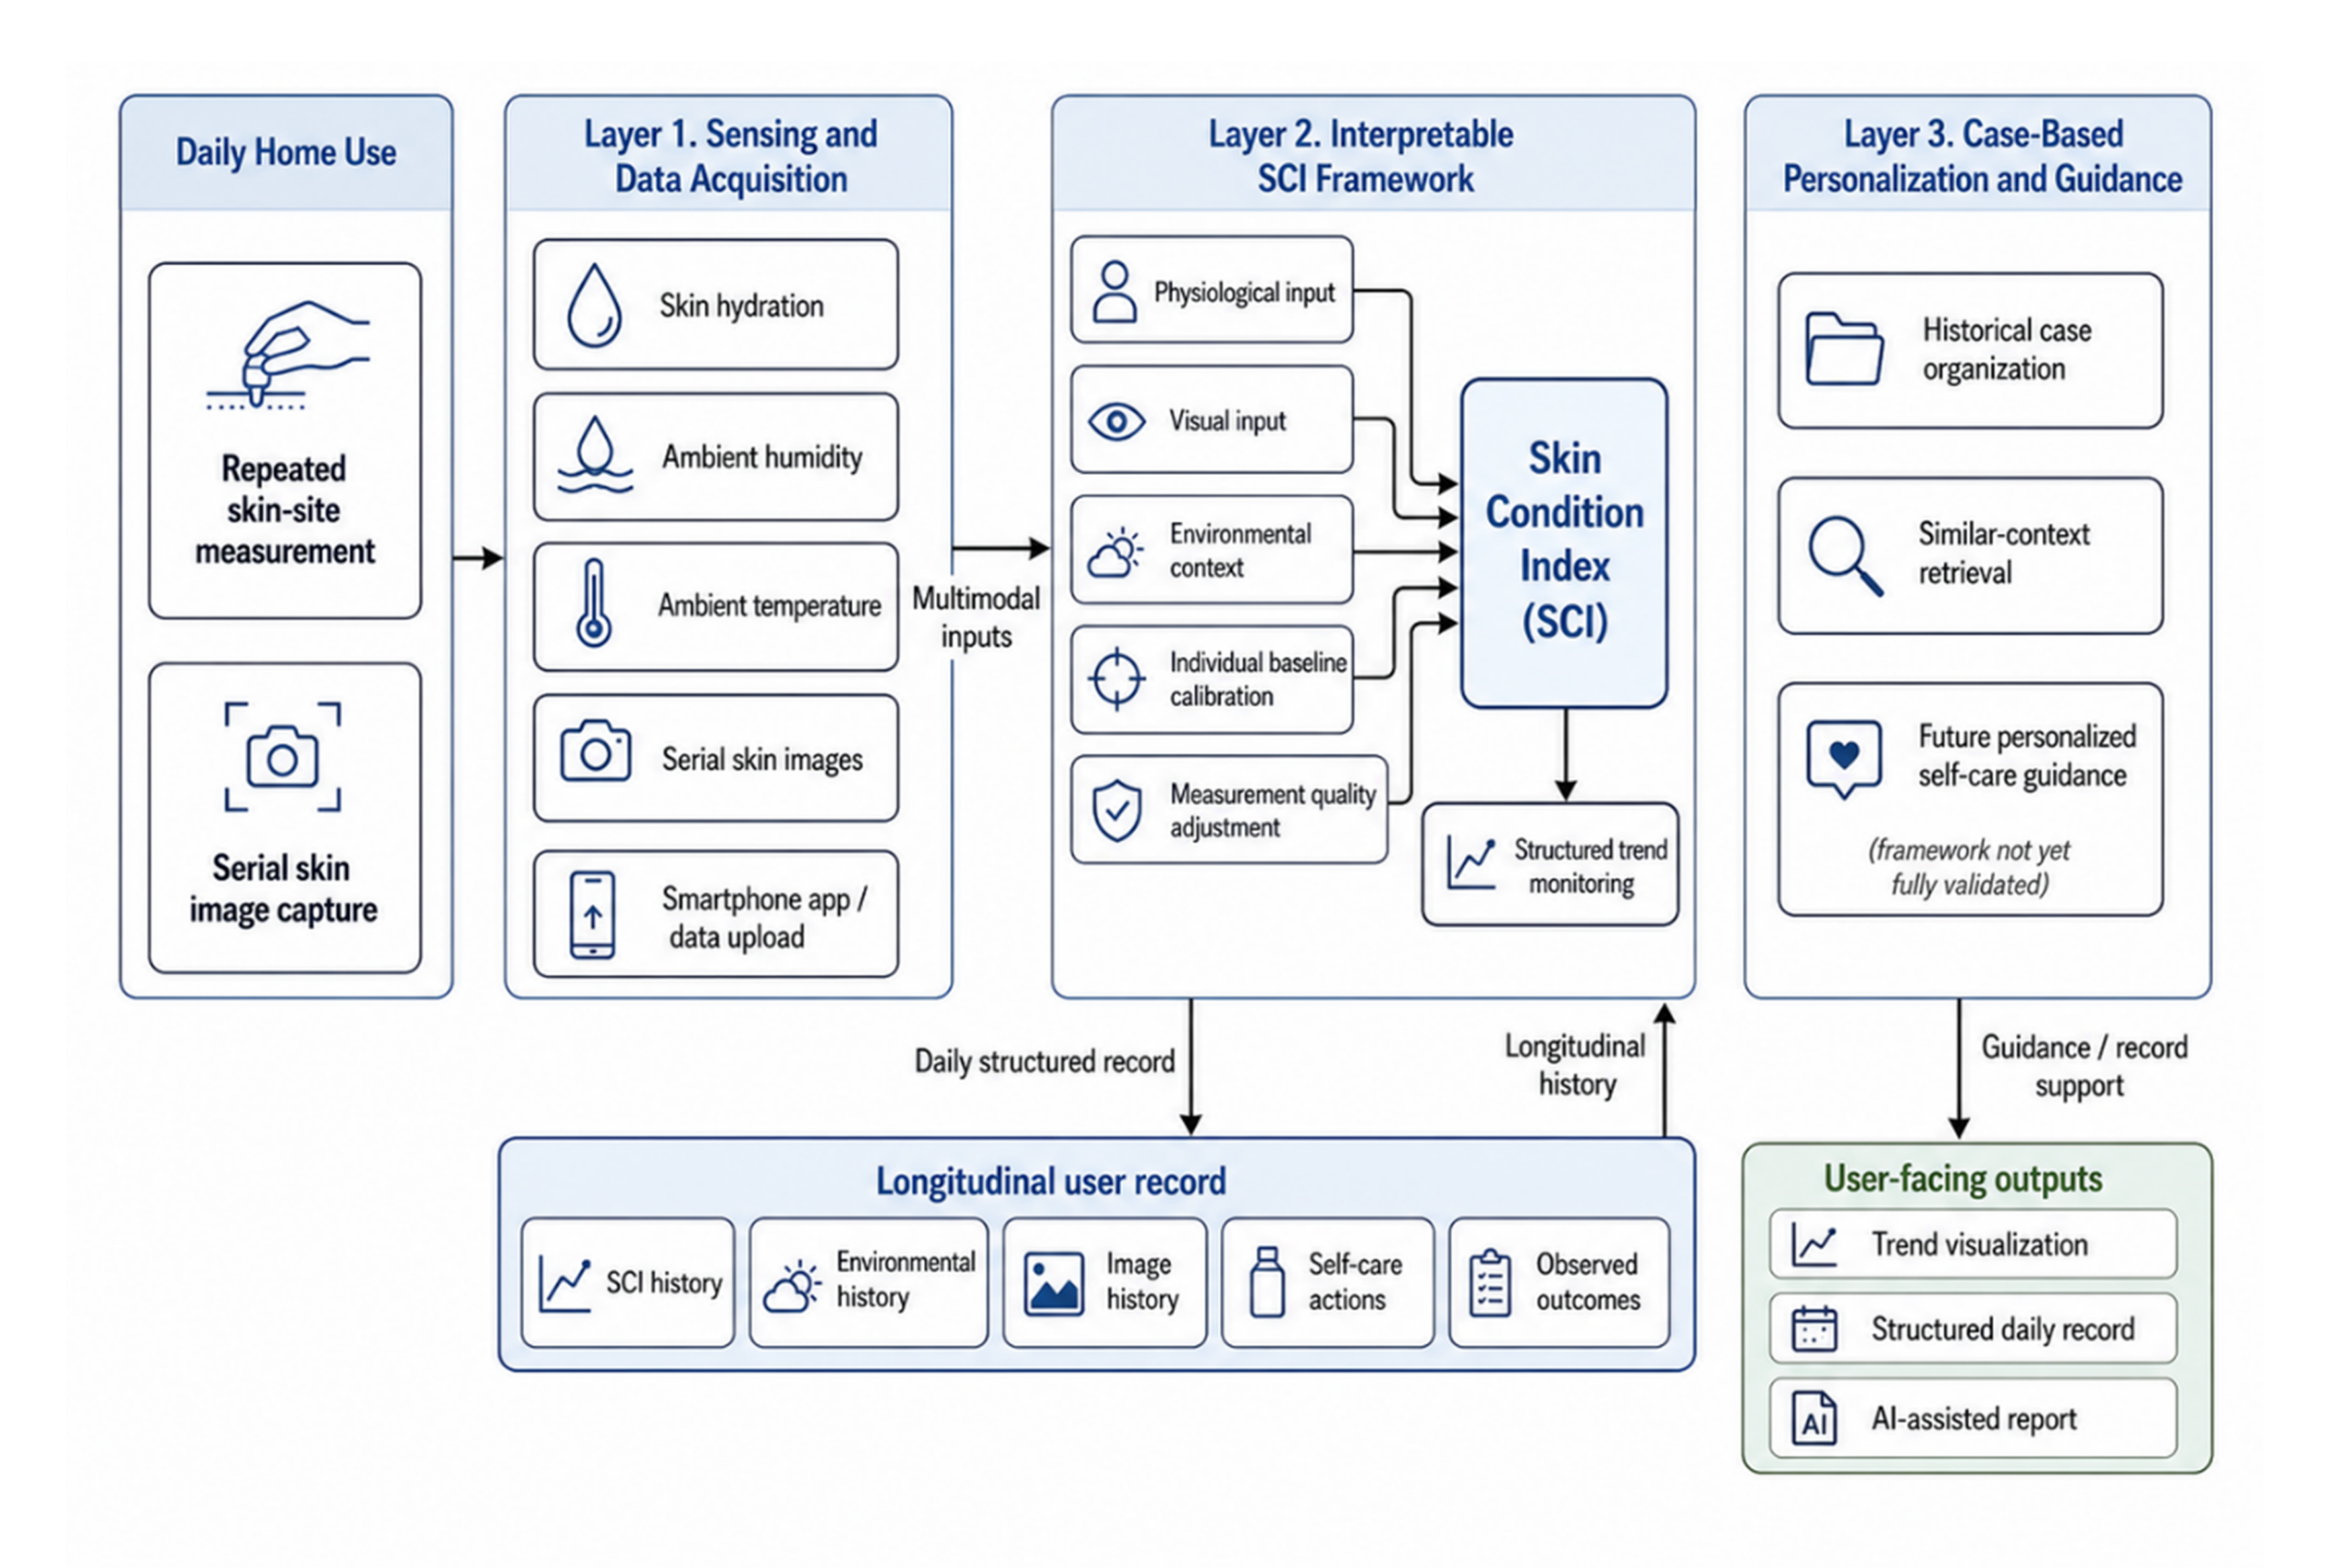
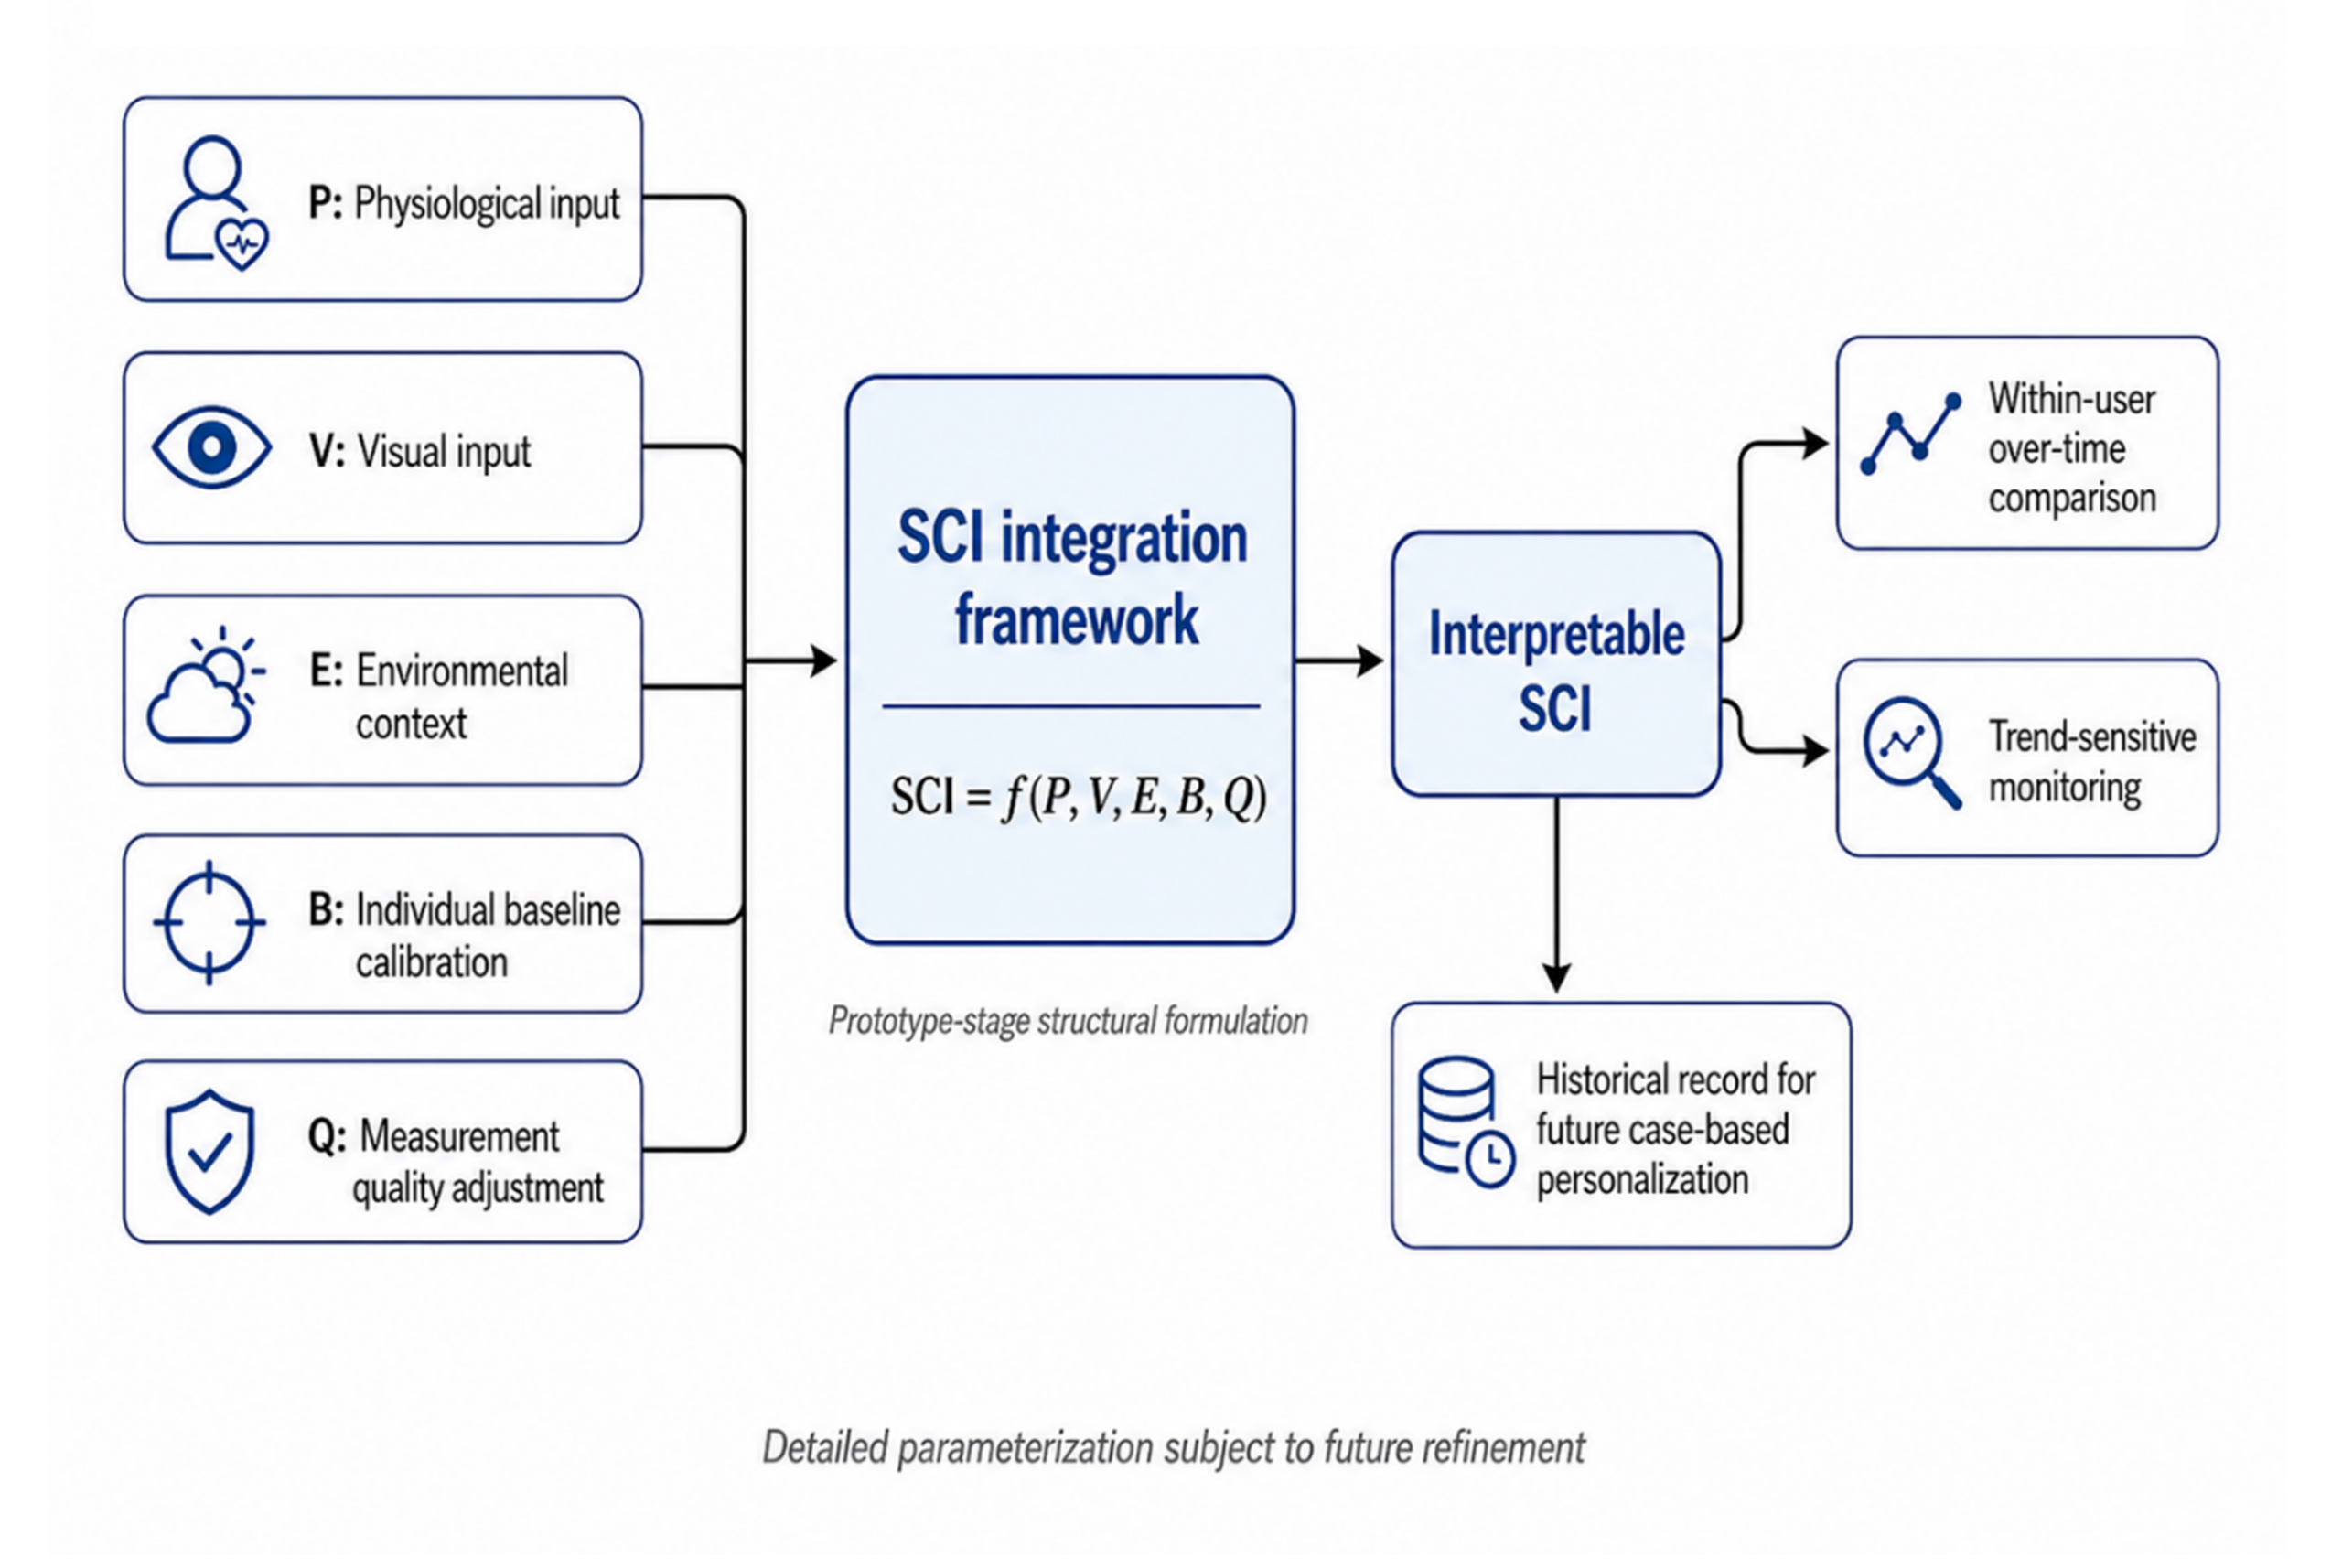
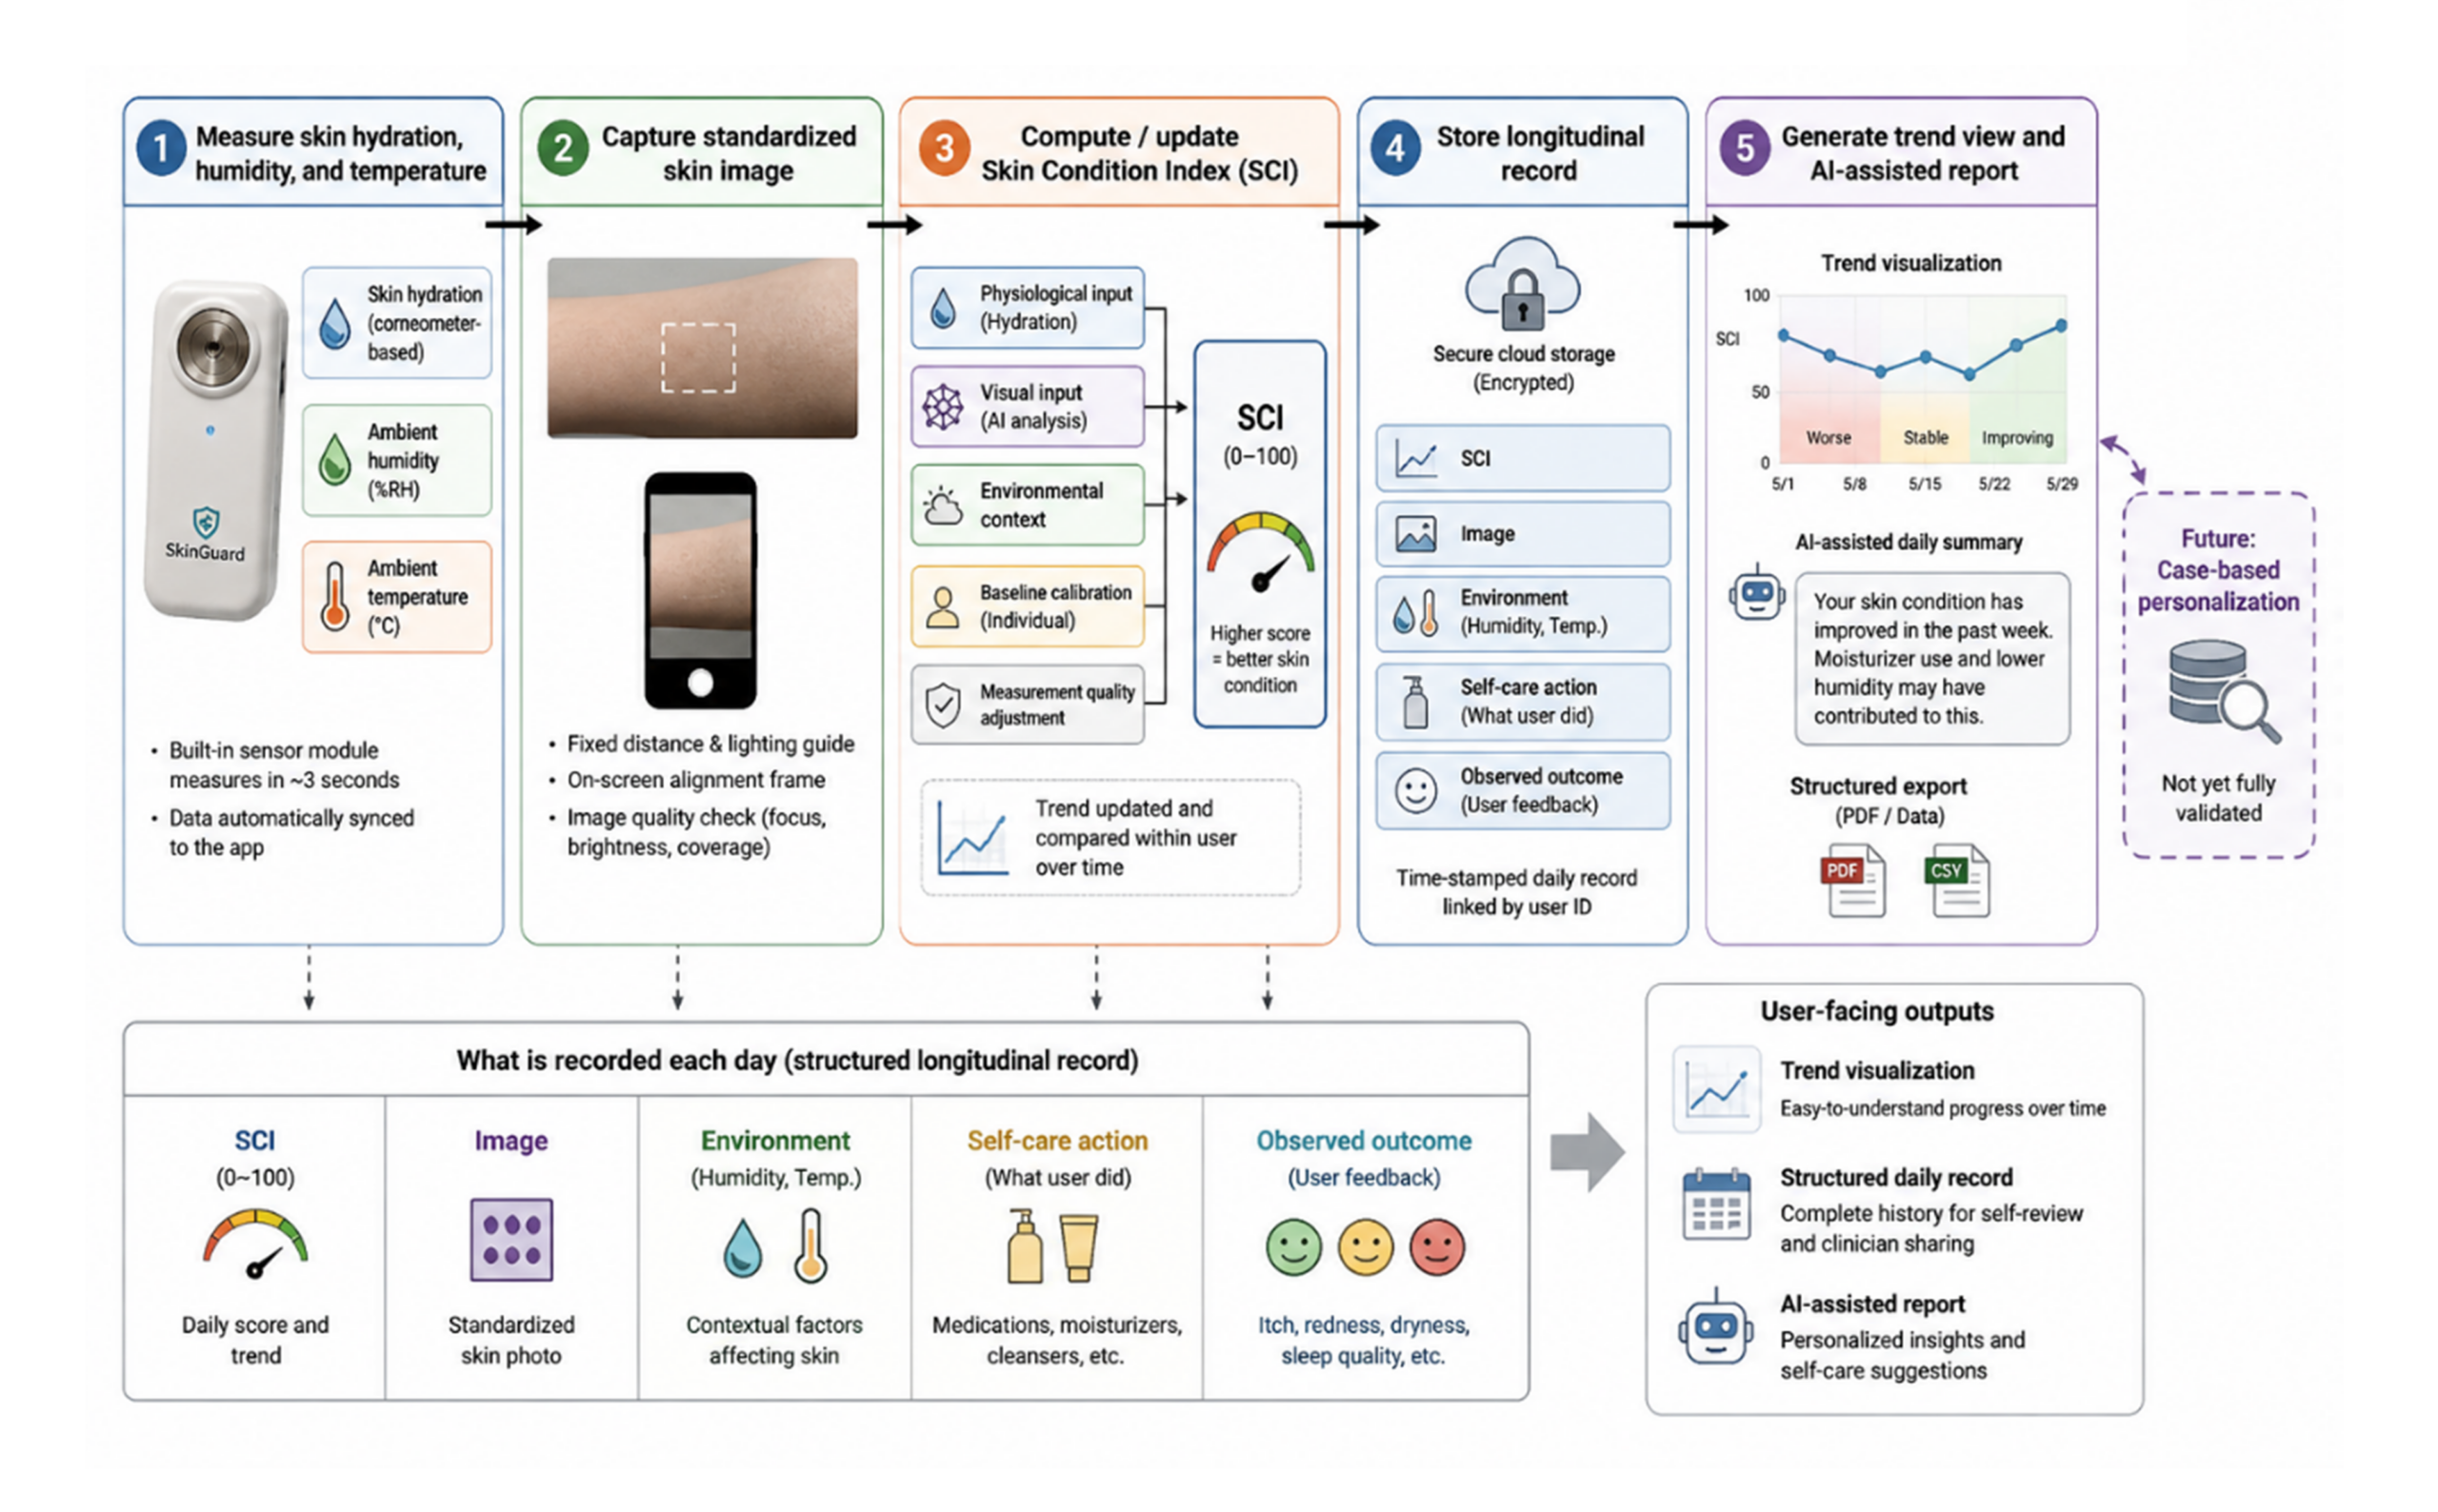
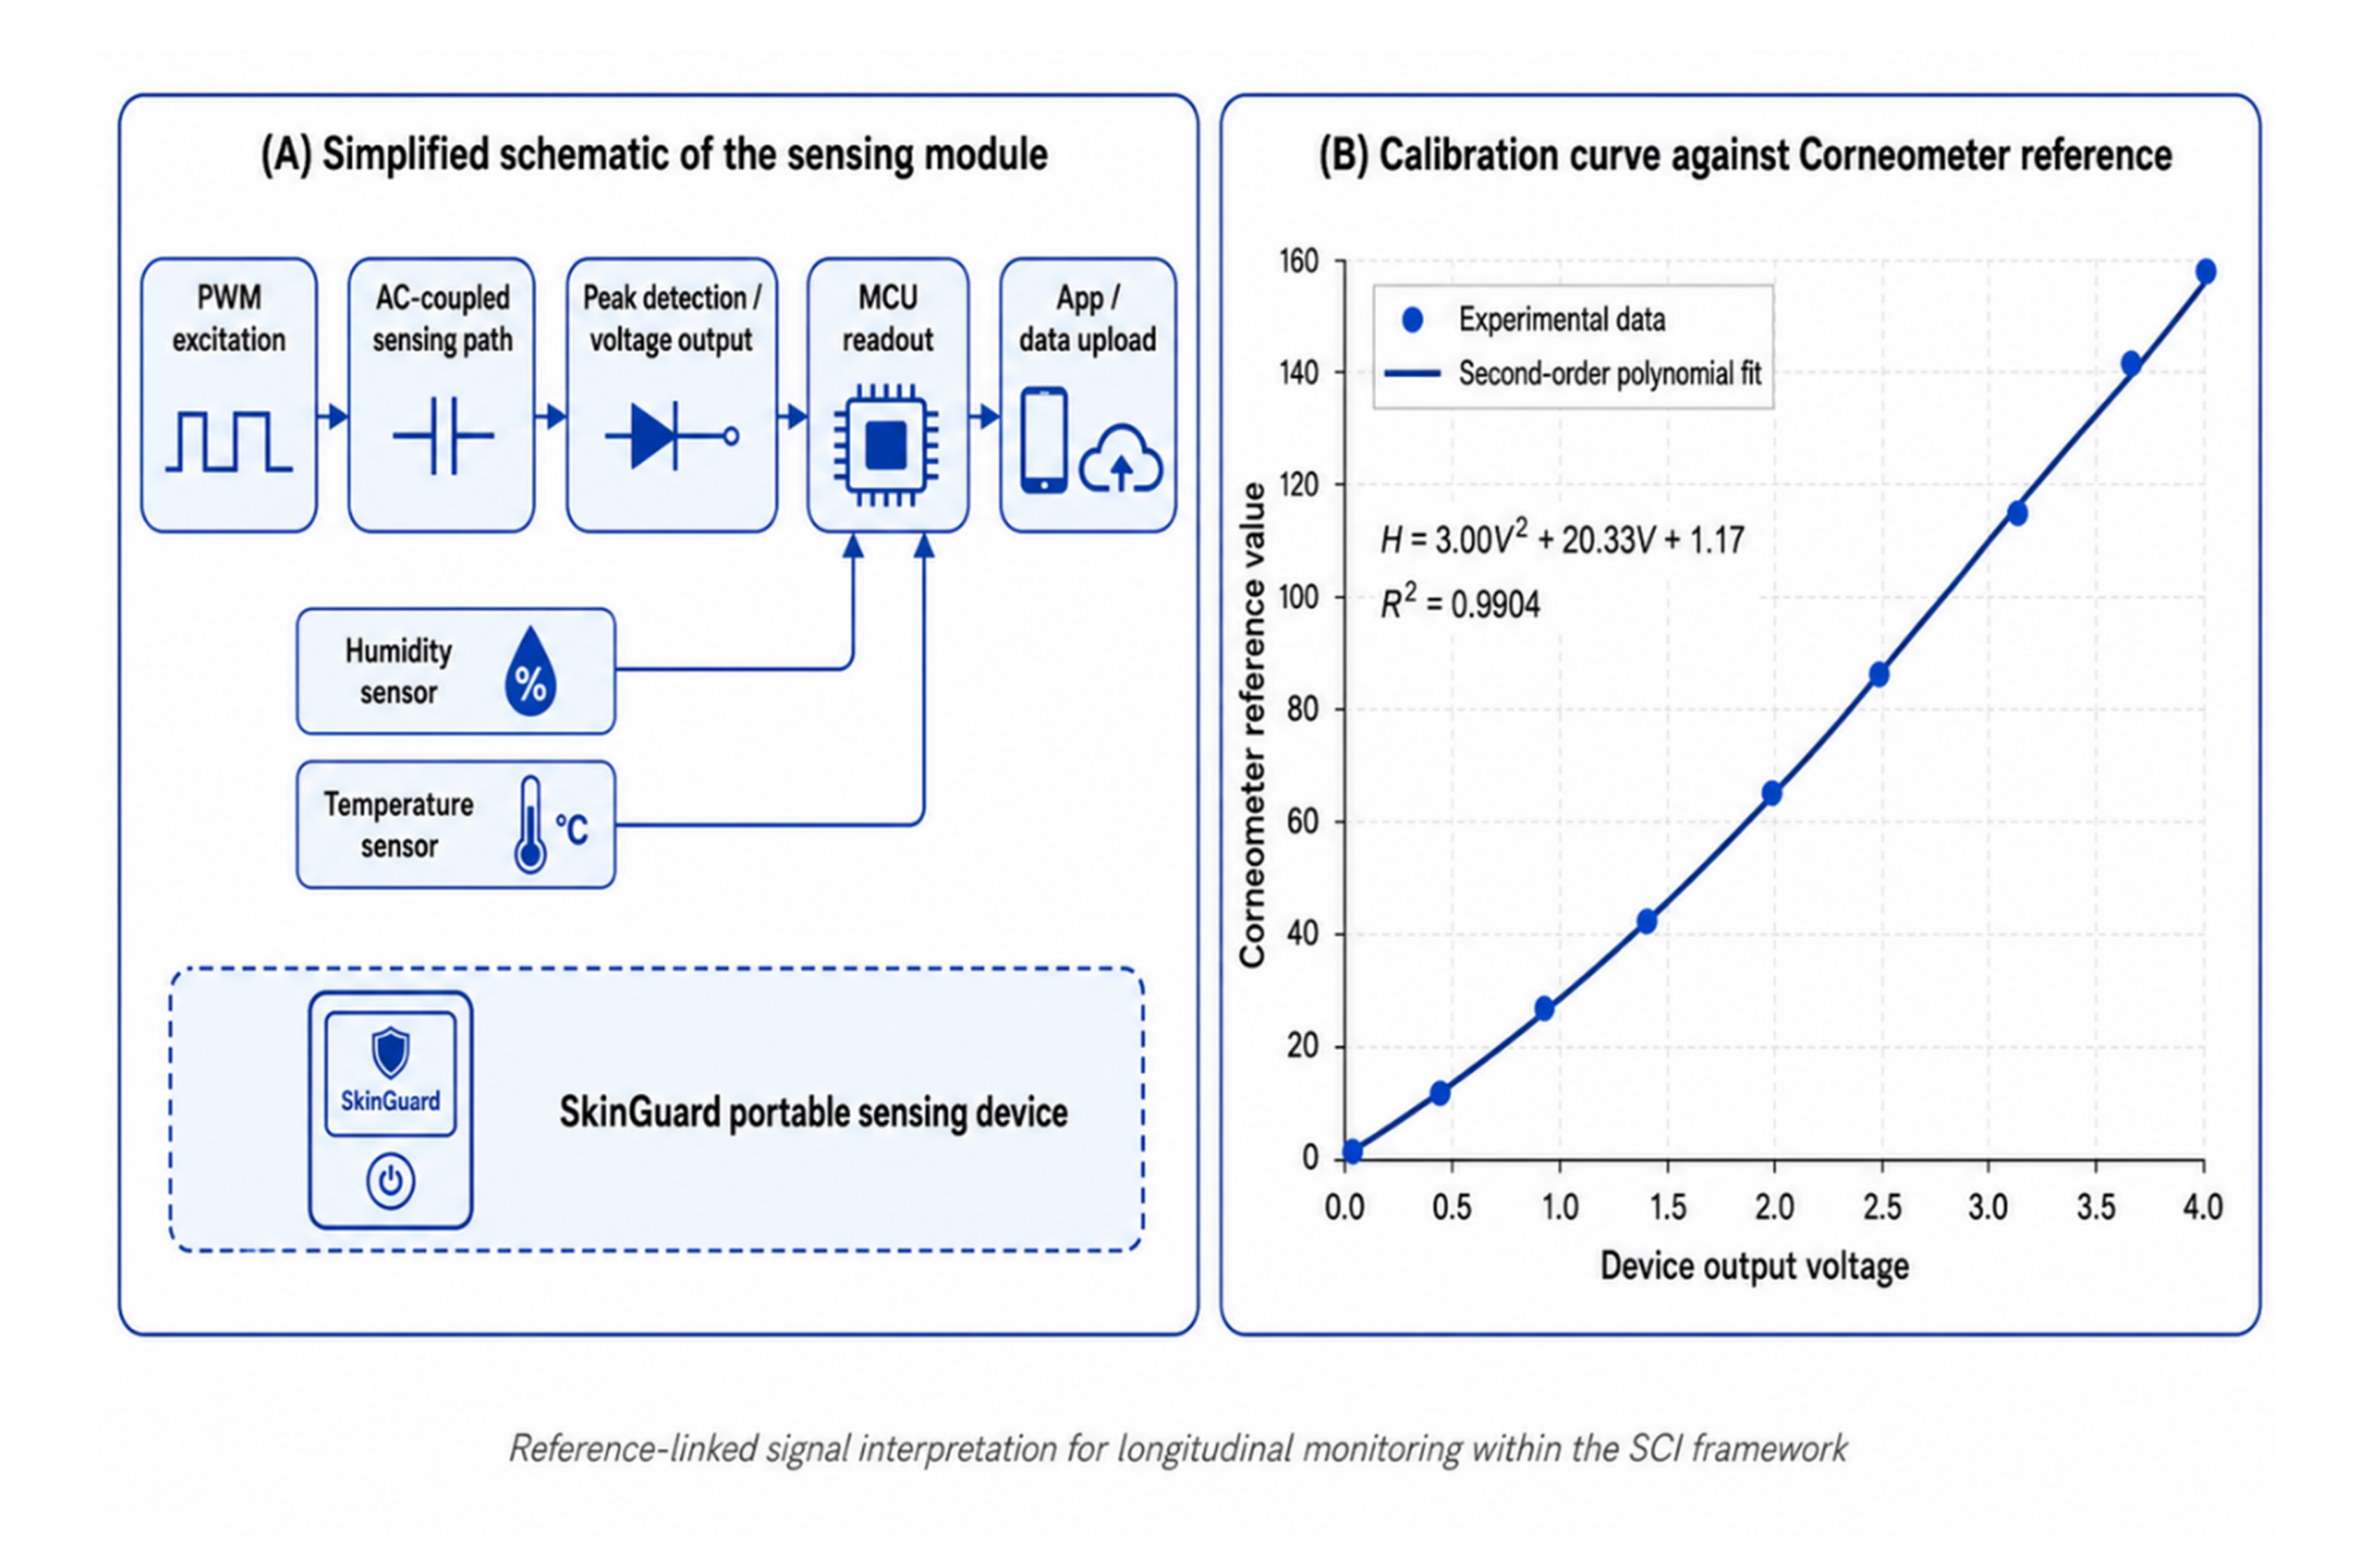
As shown in Figures 1 and 2, we built SkinGuard around a three-layer pipeline.
The first layer is the sensing layer. It collects skin-humidity signals, ambient humidity, ambient temperature, standardized site information, and a visual record. We designed a Pulse Width Modulation (PWM)–based sensing estimates skin hydration through repeatable electrical response patterns during controlled charge–discharge cycles.
The second layer is the Skin Condition Index (SCI) engine. It takes and weights multiple inputs and combines them into one number for within-user tracking. Our thinking was that a user should be able to compare today’s reading against their own past readings, not against some universal “normal” value. That’s the main value of our design—tracking and reporting on personal symptom trends.
The third layer is the reporting layer, which converts records into natural-language summaries using OpenAI or Anthropic APIs. This gives users a broader picture, showing not just the current status, but also the trend and how similar situations were involved and handled in the past.
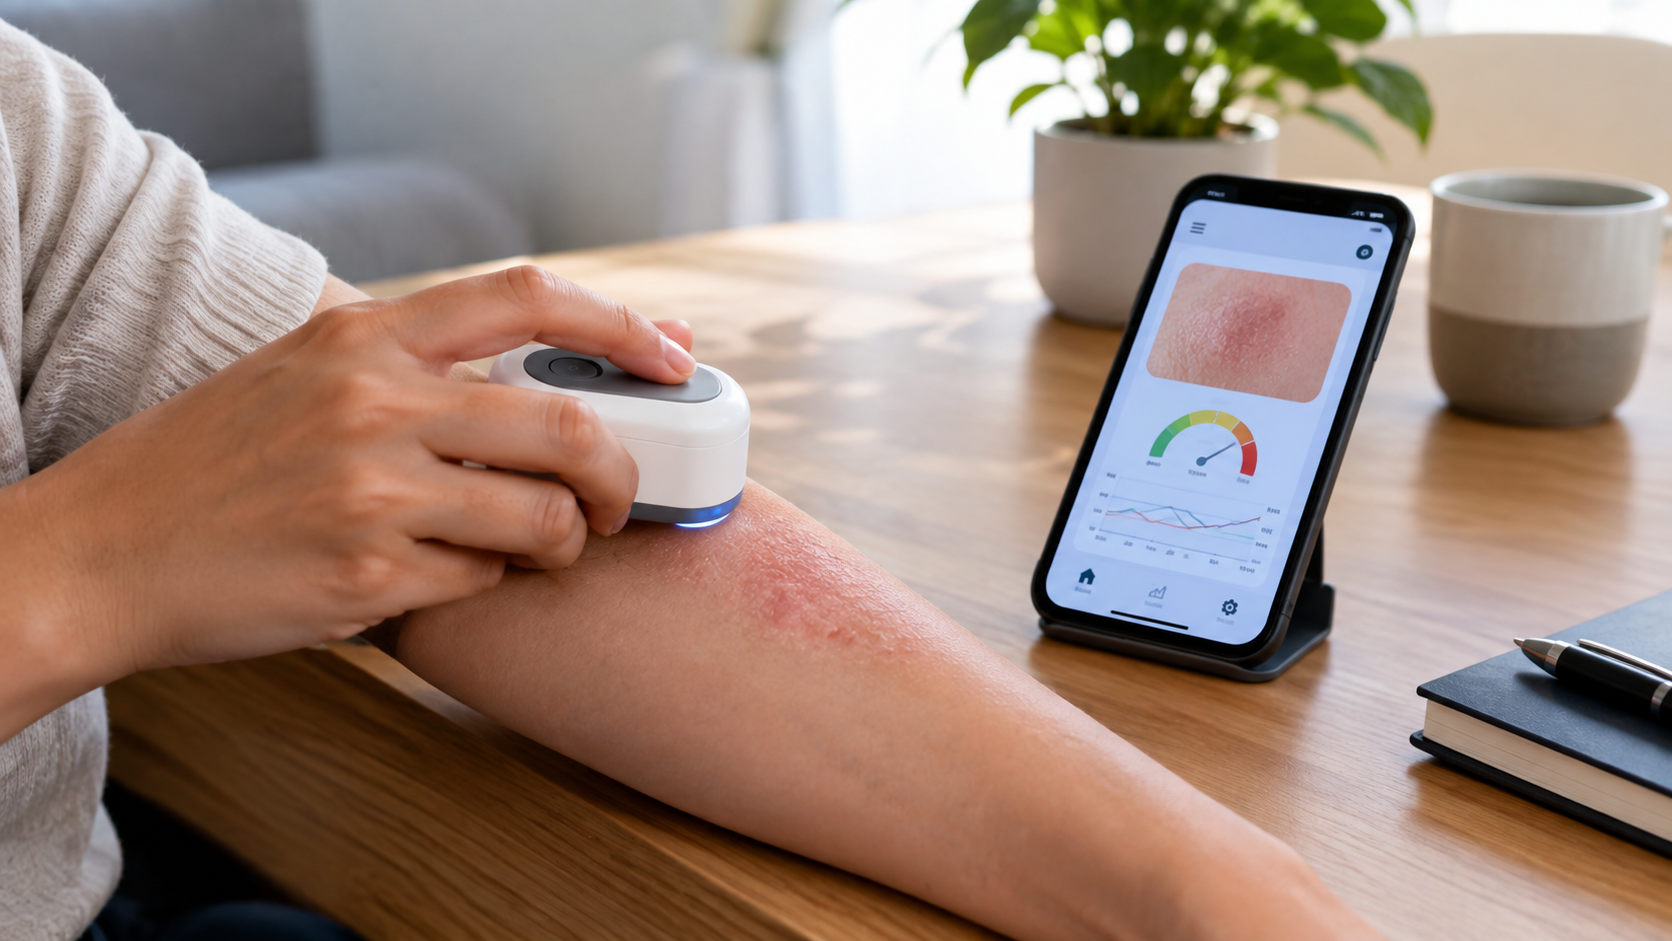
We built the sensing layer into a portable device, which contains a Bluetooth-enabled microcontroller to send everything to a standard Android phone. The phone handles compute and storage workloads, including SCI calculation, API call, and historical data storage. A user can take a daily measurement and build up patient-generated health data19 over time that could support more personalized analysis. In the studies we reviewed, we did not identify a system that combined all of these components in the same workflow.
Sensing Module and Calibration
Our portable sensing module records ambient humidity, temperature, and skin hydration signals. For temperature and humidity, we used common off-the-shelf components. Clinical-grade skin hydration sensors are expensive. But we realized that for personalized eczema tracking, the absolute value of skin hydration does not matter most. Every patient has his/her own baselines. What matters is the consistent change from that baseline over time that can show trends. So we decided to build our own skin hydration circuit.
We designed a Pulse Width Modulation (PWM) based sensing circuit that estimates skin hydration through repeatable electrical response patterns during controlled charge–discharge cycles. The sensing path uses 5 kHz PWM excitation and a peak-detection circuit.
This sensing module was built from off-the-shelf parts that keeps the cost low about  30 at scale.
We compared our sensor readings with a Corneometer, which is a standard device for measuring skin hydration20. We used seven reference points, from open circuit to wet conditions, and ran the tests in a climate-controlled room (about 22°C ± 2°C, 50% ± 5% humidity) after letting subjects sit for about 20 minutes. Skin hydration readings can vary with pressure, skin site, environment and moisturizers21,22,23. We set the contact force to be roughly 0.5 N. We also checked the circuit limits with open-circuit and agar-gel conditions. and tried the sensor on a few skin sites, such as the forearm, elbow, and palm. At each point, we recorded the Corneometer first, then our prototype.
| Measurement state | Reference Hydration Value (AU) | Prototype ADC voltage (V) |
| Open circuit | 0 | 0.08 |
| Very dry | 12.5 | 0.45 |
| Dry | 25 | 0.88 |
| Normal target | 40 | 1.55 |
| Hydrated | 55 | 2.12 |
| Very moist | 70 | 2.58 |
| Saturated/wet | 90 | 2.92 |
Skin Condition Index
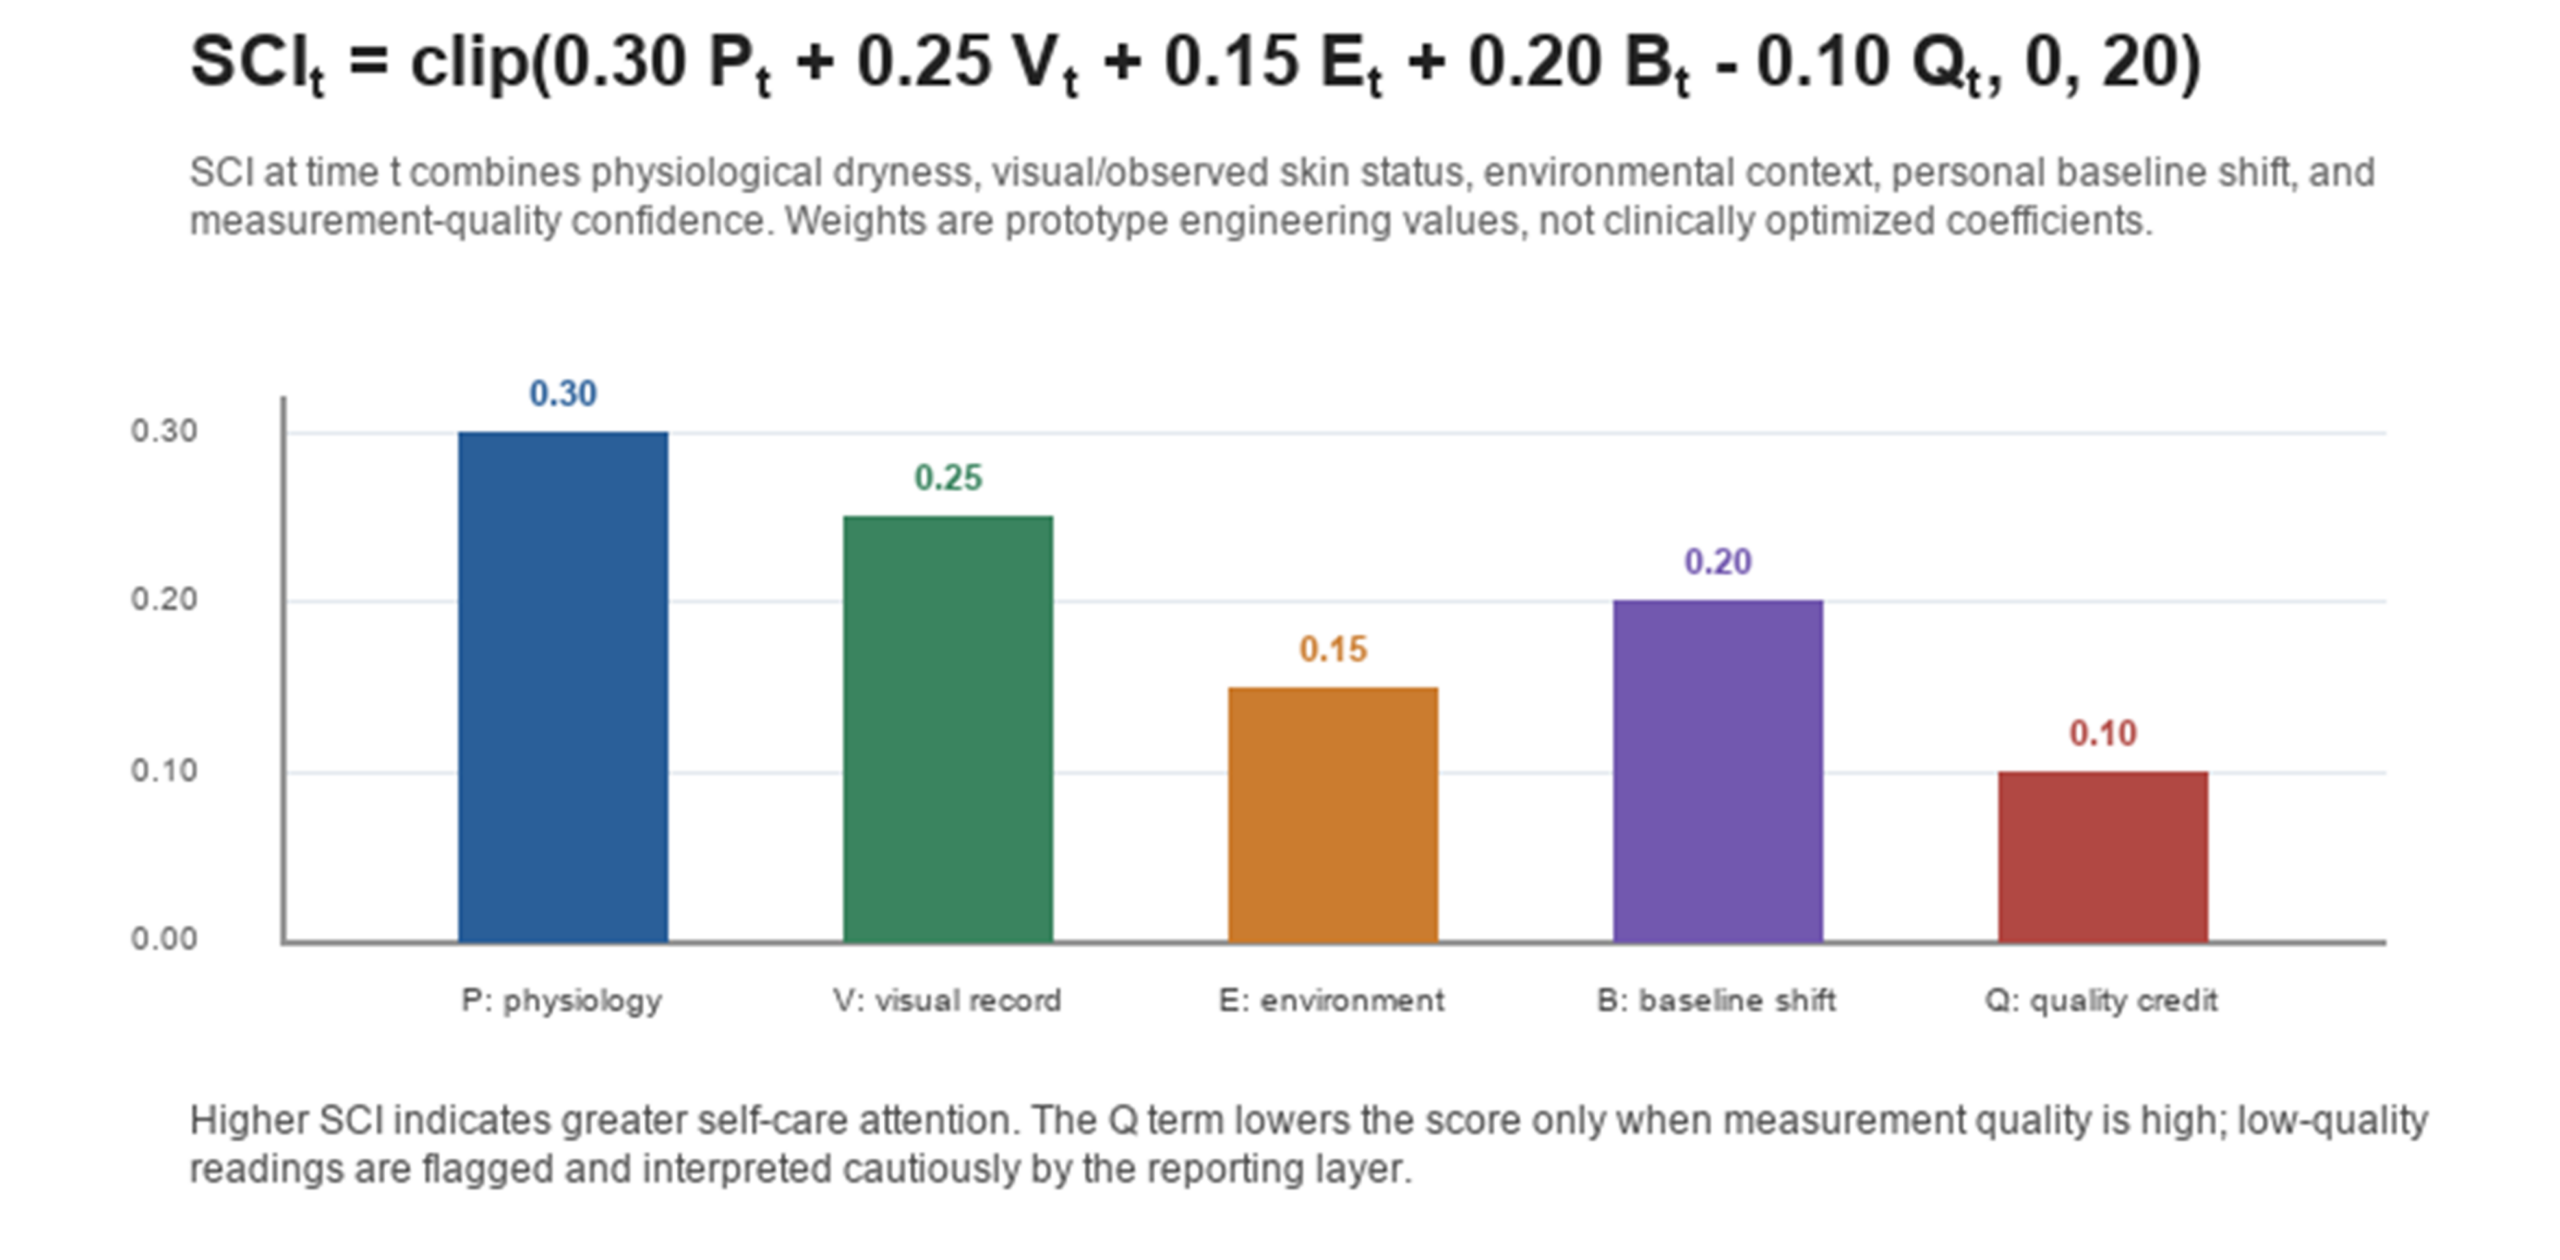
The SCI formula produces a score from 0 to 20. It combines several inputs.
![\[SCI_t= clip(0.30 P_t + 0.25V_t + 0.15E_t + 0.20B_t - 0.10Q_t, 0, 20)\]](https://nhsjs.com/wp-content/ql-cache/quicklatex.com-7f94a5067042456afc8b9be70cacc366_l3.png "Rendered by QuickLaTeX.com")
In this formula, t is a long time. The clip function keeps the final score between 0 and 20.
We assigned weights to each input based on how directly it relates to eczema symptoms.
- Pt (Dryness risk) and Vt (Visible skin condition) : We assigned the most weight (30% and 25%) to them because skin hydration and visible condition directly represent how severe the symptom is. Vt is input by user/caregiver according to their observations.
- Bt (personal baseline) was weighted at 20% because the same numerical reading can have different meanings for different people. Each individual’s own baseline matters.
- Et was given 15% to account for environmental factors, which both our own observations and prior studies (including work on ultraviolet exposure, meteorological factors, and wildfire-related air pollutiont24,25,26) suggest play a role in flareups.
- Qt is subtracted (10%) as a penalty for poor-quality readings. When a reading is low quality, Qt stays high, SCI stays low. Usually, a significant low SCI value contradicts a patients’ direct feeling. It is taken as a sign to remind the patient for a high-quality re-measure. A threshold is also set to trigger an automatic re-measure requirement.
We designed the SCI as an engineering metric for tracking individual eczema trends over time. This metric combines various influencing factors, the user’s personal baseline, and data quality into a single score. The absolute number itself doesn’t matter much. Instead, the relative change gives users more meaningful information. It tells users quantitatively how their skin and environment are changing, rather than relying on intuition and memory alone.
We will review and iterate the weights with future larger datasets. We also think it may be helpful and interesting to compare it with existing severity measures27,28.
Please refer to table 2 for each input’s definition.
| Input | Range | Source | Interpretation |
| Pt | 0-20 | The skin hydration sensor on SkinGuard device | Lower skin hydration leads to higher Pt. |
| Vt | 0-20 | User/caregiver observation | Visible skin conditions: skin redness, dryness, scratching, and roughness. |
| Et | 0-20 | Ambient humidity and temperature readings from SkinGuard sensors | Environmental risk. Dry, hot, or fast-changing conditions raise Et |
| Bt | 0-20 | 7-day user history stored on SkinGuard | Personal baseline adjustment. |
| Qt | 0-20 | Four quality checks from different angles. | A penalty based on four quality checks, including data completeness, range validity, contact stability and record usability. Low quality reading triggers a re-measure. |
API-based AI Reporting Module
The module is an API-based layer that calls OpenAI’s GPT or Anthropic’s Claude29,30. We take the current readings and past records, format them, and send them to the API. Each prompt includes de-identified current data, including ambient humidity and temperature, skin-humidity, images, recent records, SCI values, and skin-care action labels. We use a standard Android phone to run the API calls and display the outputs.
To reduce the risk of large language models from generating hallucinations31,32,33, we set rules for what the AI can and cannot do. We do not allow the AI to give diagnostic advice. The output is designed to give users current situation report, trend summary and historical similar condition reference. It tells the user today’s reading against recent records, their baselines. It also references past skin-care actions that were effective under similar trends and conditions. The report is written as a daily skin-care summary. It can remind users to see their doctors if symptoms get worse.
An output example is: “Your SCI score is 9/20. Overall your skin is in general condition. There are some concerns from your eczema photos: there are more yellow spots compared with yesterday. The red spots have spread more than a few days ago as well. Also, your environment today is drier. Humidity is 20% lower and temperature is 5% higher than recent days. A similar situation has happened two times in the past month, more often than in previous months. You may need to pay extra attention to your skin care or check with your doctor.”
Data Sampling and Statistical Analysis
Our testing data came from three volunteer users. The data were recorded between November 17 and December 22, 2025. Users measured ambient humidity, temperature, and skin hydration with our testing device. The data were sent to their own phone via Bluetooth for daily recording. They also used their phones to take eczema photos. They took measurements twice a day, before and after school, at five body sites: left elbow, right elbow, back of left knee, back of right knee, and hand.
We analyzed 102 session records, with a total of 510 site-level skin-humidity datapoints.
Calibration of the sensing module was done under controlled environmental conditions.
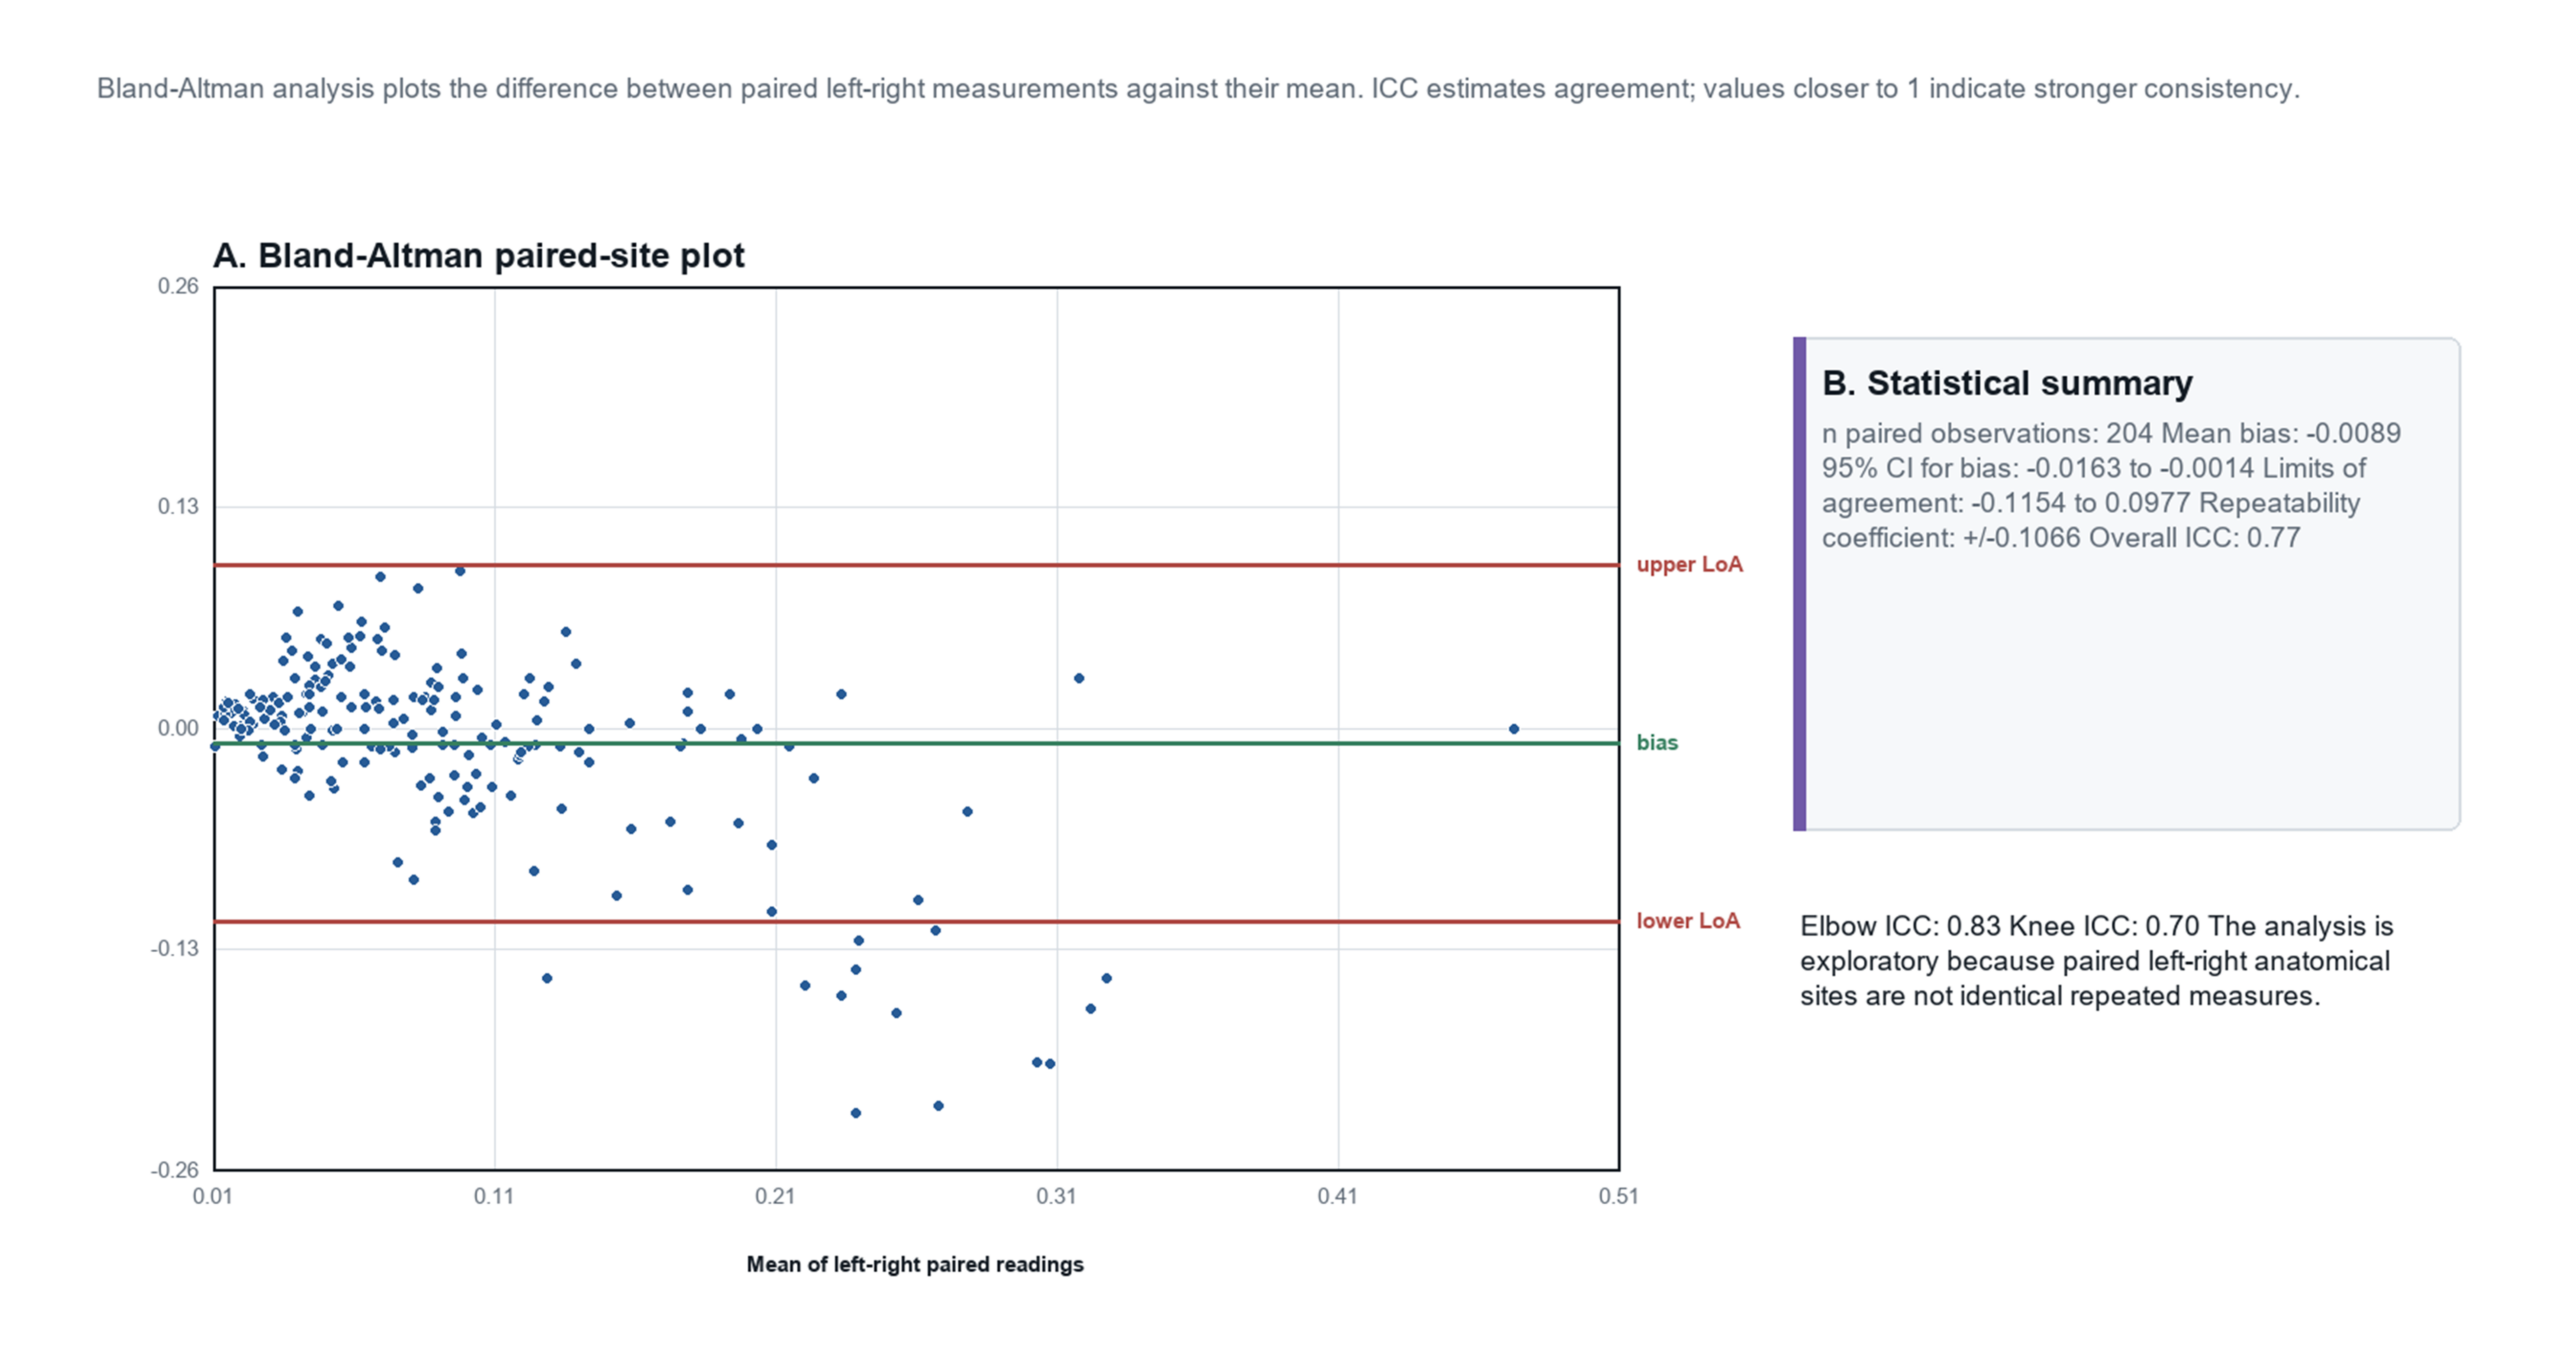
We have a detailed introduction regarding the data sampling in Figure 8. To compare paired measurements34, we used Bland-Altman plots to display the results and we used ICC (intraclass correlation coefficient) to estimate consistency35 of the data.
Since some of our analysis used paired left-right readings rather than the measurements at the same point, we report these as exploratory contralateral-site agreement results, and we calculated the ICC by using a two-way absolute-agreement model. Because the data is not normally distributed, we resampled paired data and used bootstrap to calculate the 95% CIs.
Ethics, Privacy, and Data Handling
The testing data came from three volunteer users. We obtained written permission from each user (or their guardian).
Regarding privacy, we have removed direct identifiers, including names, contact info, dates of birth, and addresses for all volunteers.
For the testing data, we asked the volunteers to download from their cellphone and send it to us after removing all sensitive information. After we received the data, we did some data processing to make sure these data are clean and in an organized format, then these datasets were kept in password-protected local storage. Only the project team has access. We call APIs with de-identified fields. Raw skin images were not shared publicly. Because we developed this prototype as a high school student interest-driven engineering project, we did not conduct a formal re-identification risk analysis which was beyond the project scope.
Results
Prototype Workflow and API Report Demonstration
We run three scenarios to test the prototype workflow. The system produced a report for each scenario with different outputs. Please check the table for each scenario description.
| Scenario | Structured input | Report |
| A stable baseline case | Skin hydration signal near baseline; stable trend; SCI = 0 | Stable record, routine monitoring |
| A moderate worsening case | Lower skin hydration signal, warming/drying environment, SCI = 9 | Worsening trend, skin-care attention |
| A severe change | Very low skin hydration signal, visible severe indicators, SCI = 18 | High-attention language, advice for doctor visits. |
Sensor Calibration Result
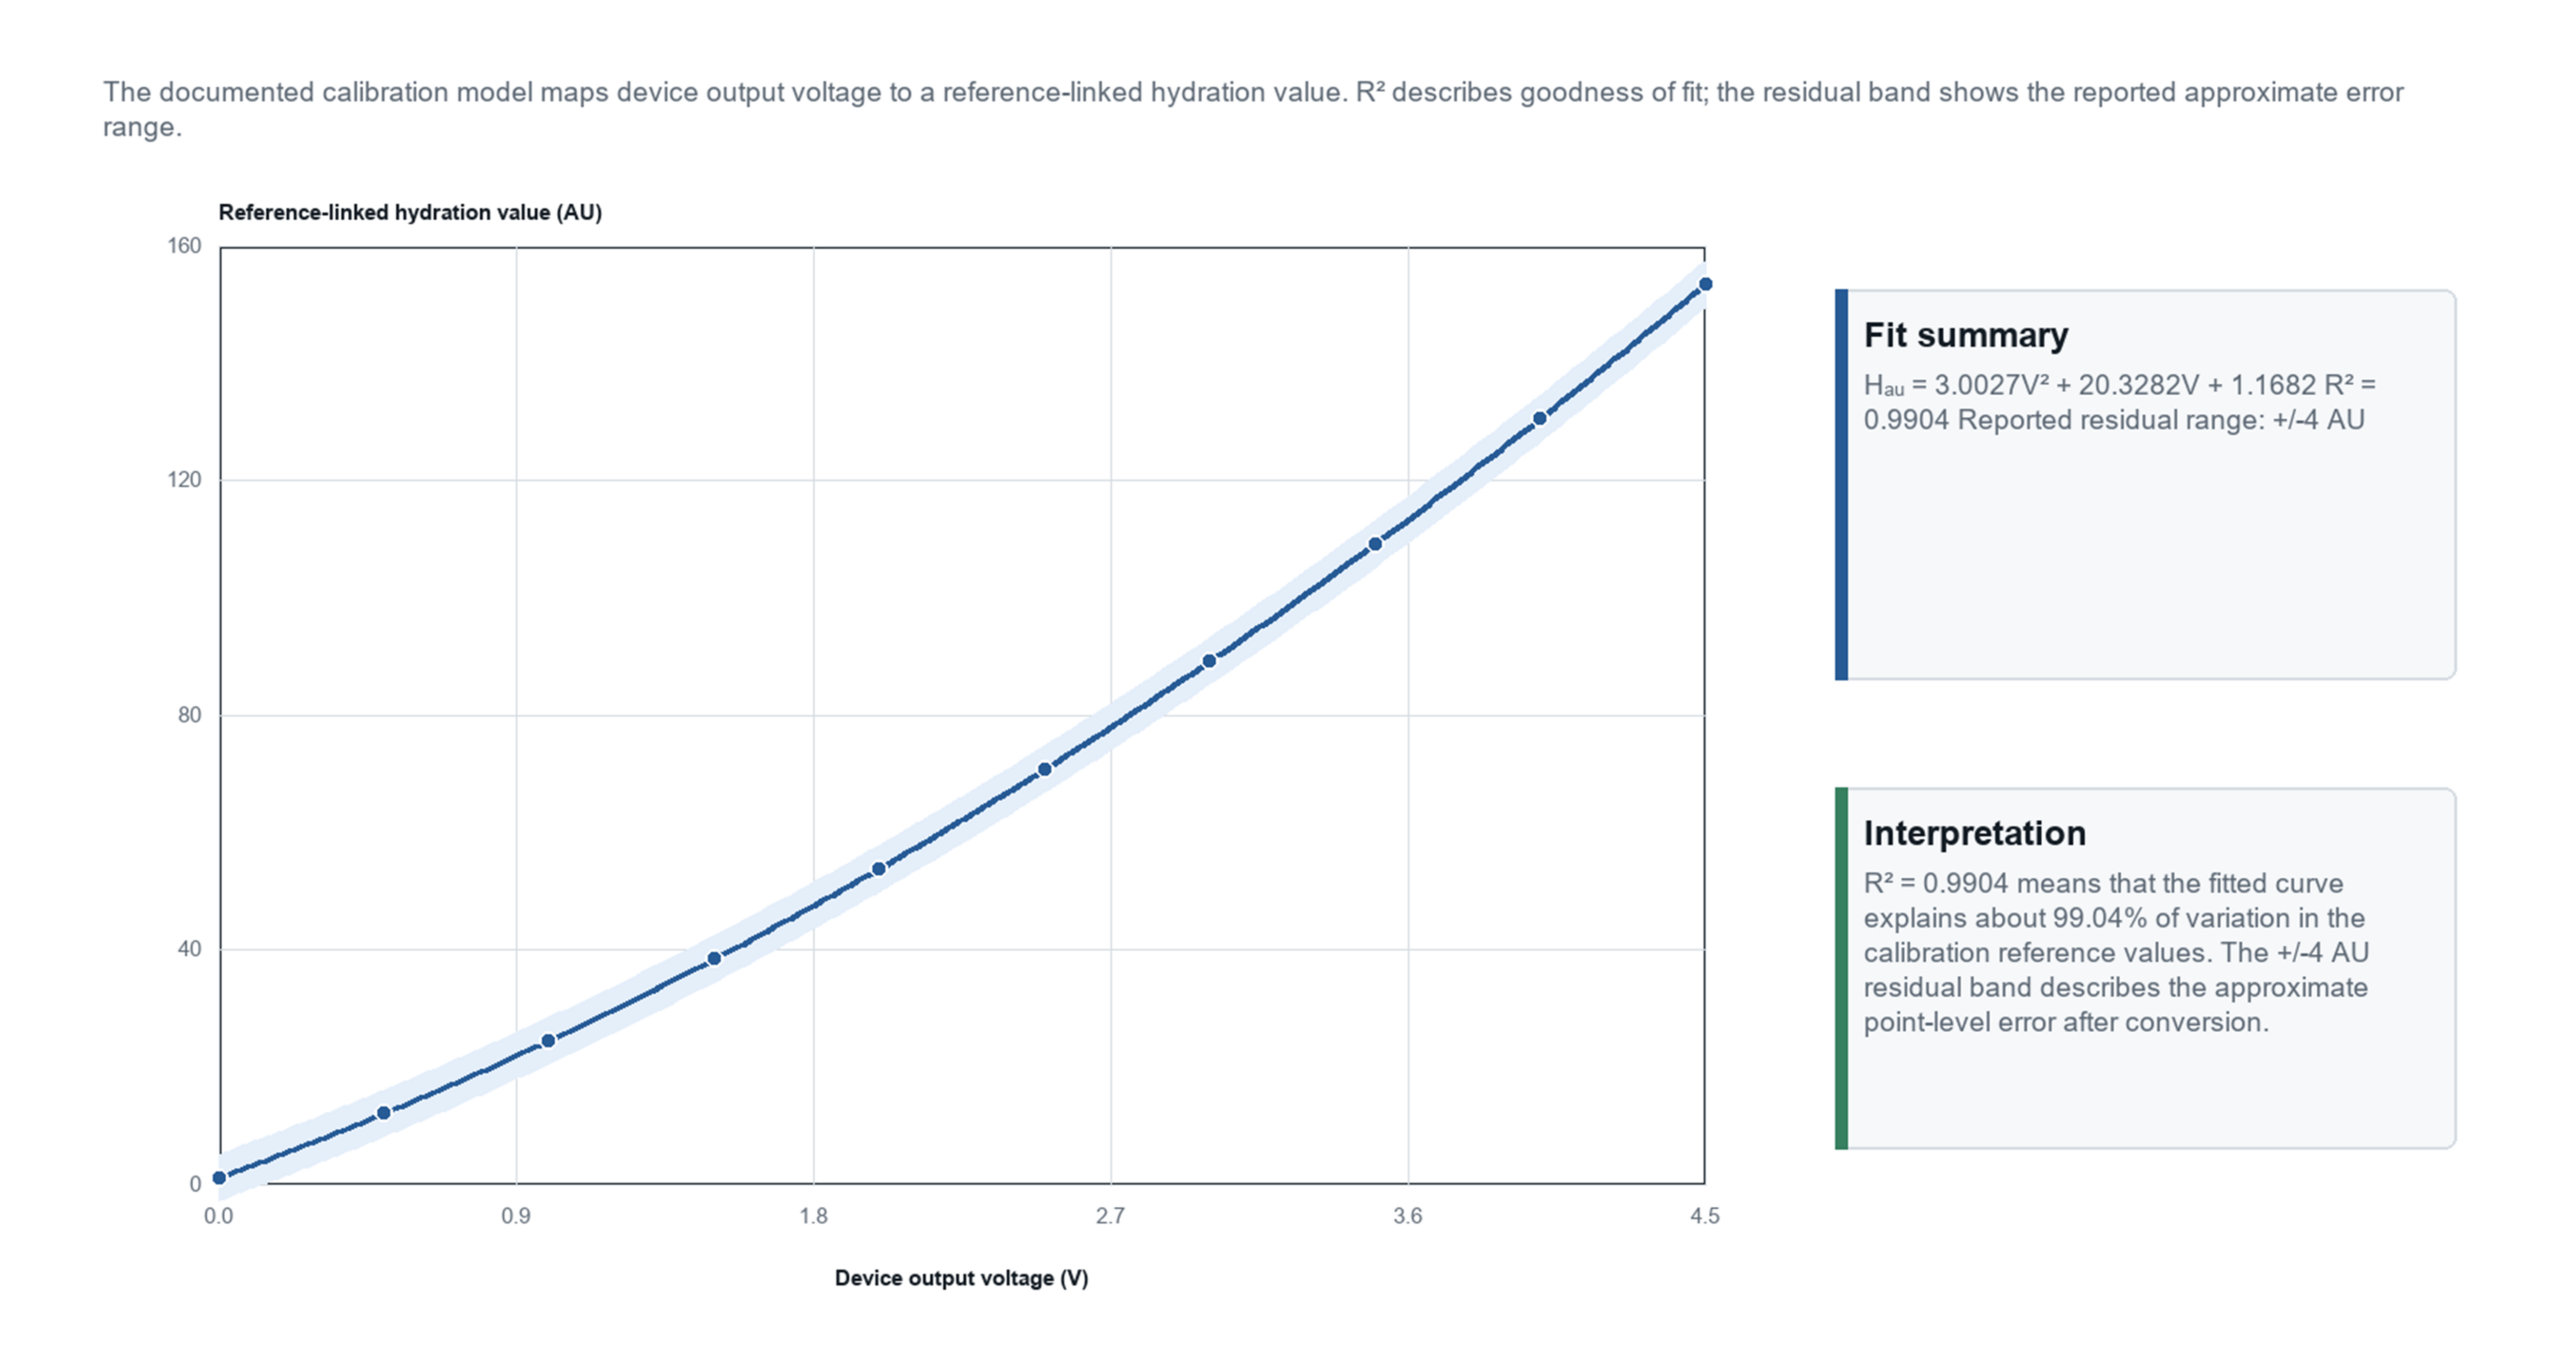
Based on our raw data, we used a second-order polynomial to calibrate the sensor. The calibrated quadratic curve was: H_AU = 3.0027V² + 20.3282V + 1.1682. Here V is the device output voltage, and H_AU is the calculated hydration value in arbitrary units.
From the analysis, we found out that R² = 0.9904, RMSE = 2.91 AU, and max residual = 3.87 AU. The R² is close to 1 which indicates that the sensor output is well correlated with the skin condition and the fitted quadratic function can represent the hydration status. The max residual is relatively small given the hydration range is 0-100 AU.
We also did leave-one-out cross-validation (LOOCV) to evaluate how much influence for each sample data. The result showed that RMSE increased to 6.66 AU (mean = 5.47 AU, max = 12.24 AU). This means that we still need more data to have a more robust calibration result.
Sampling Results from Recorded Data
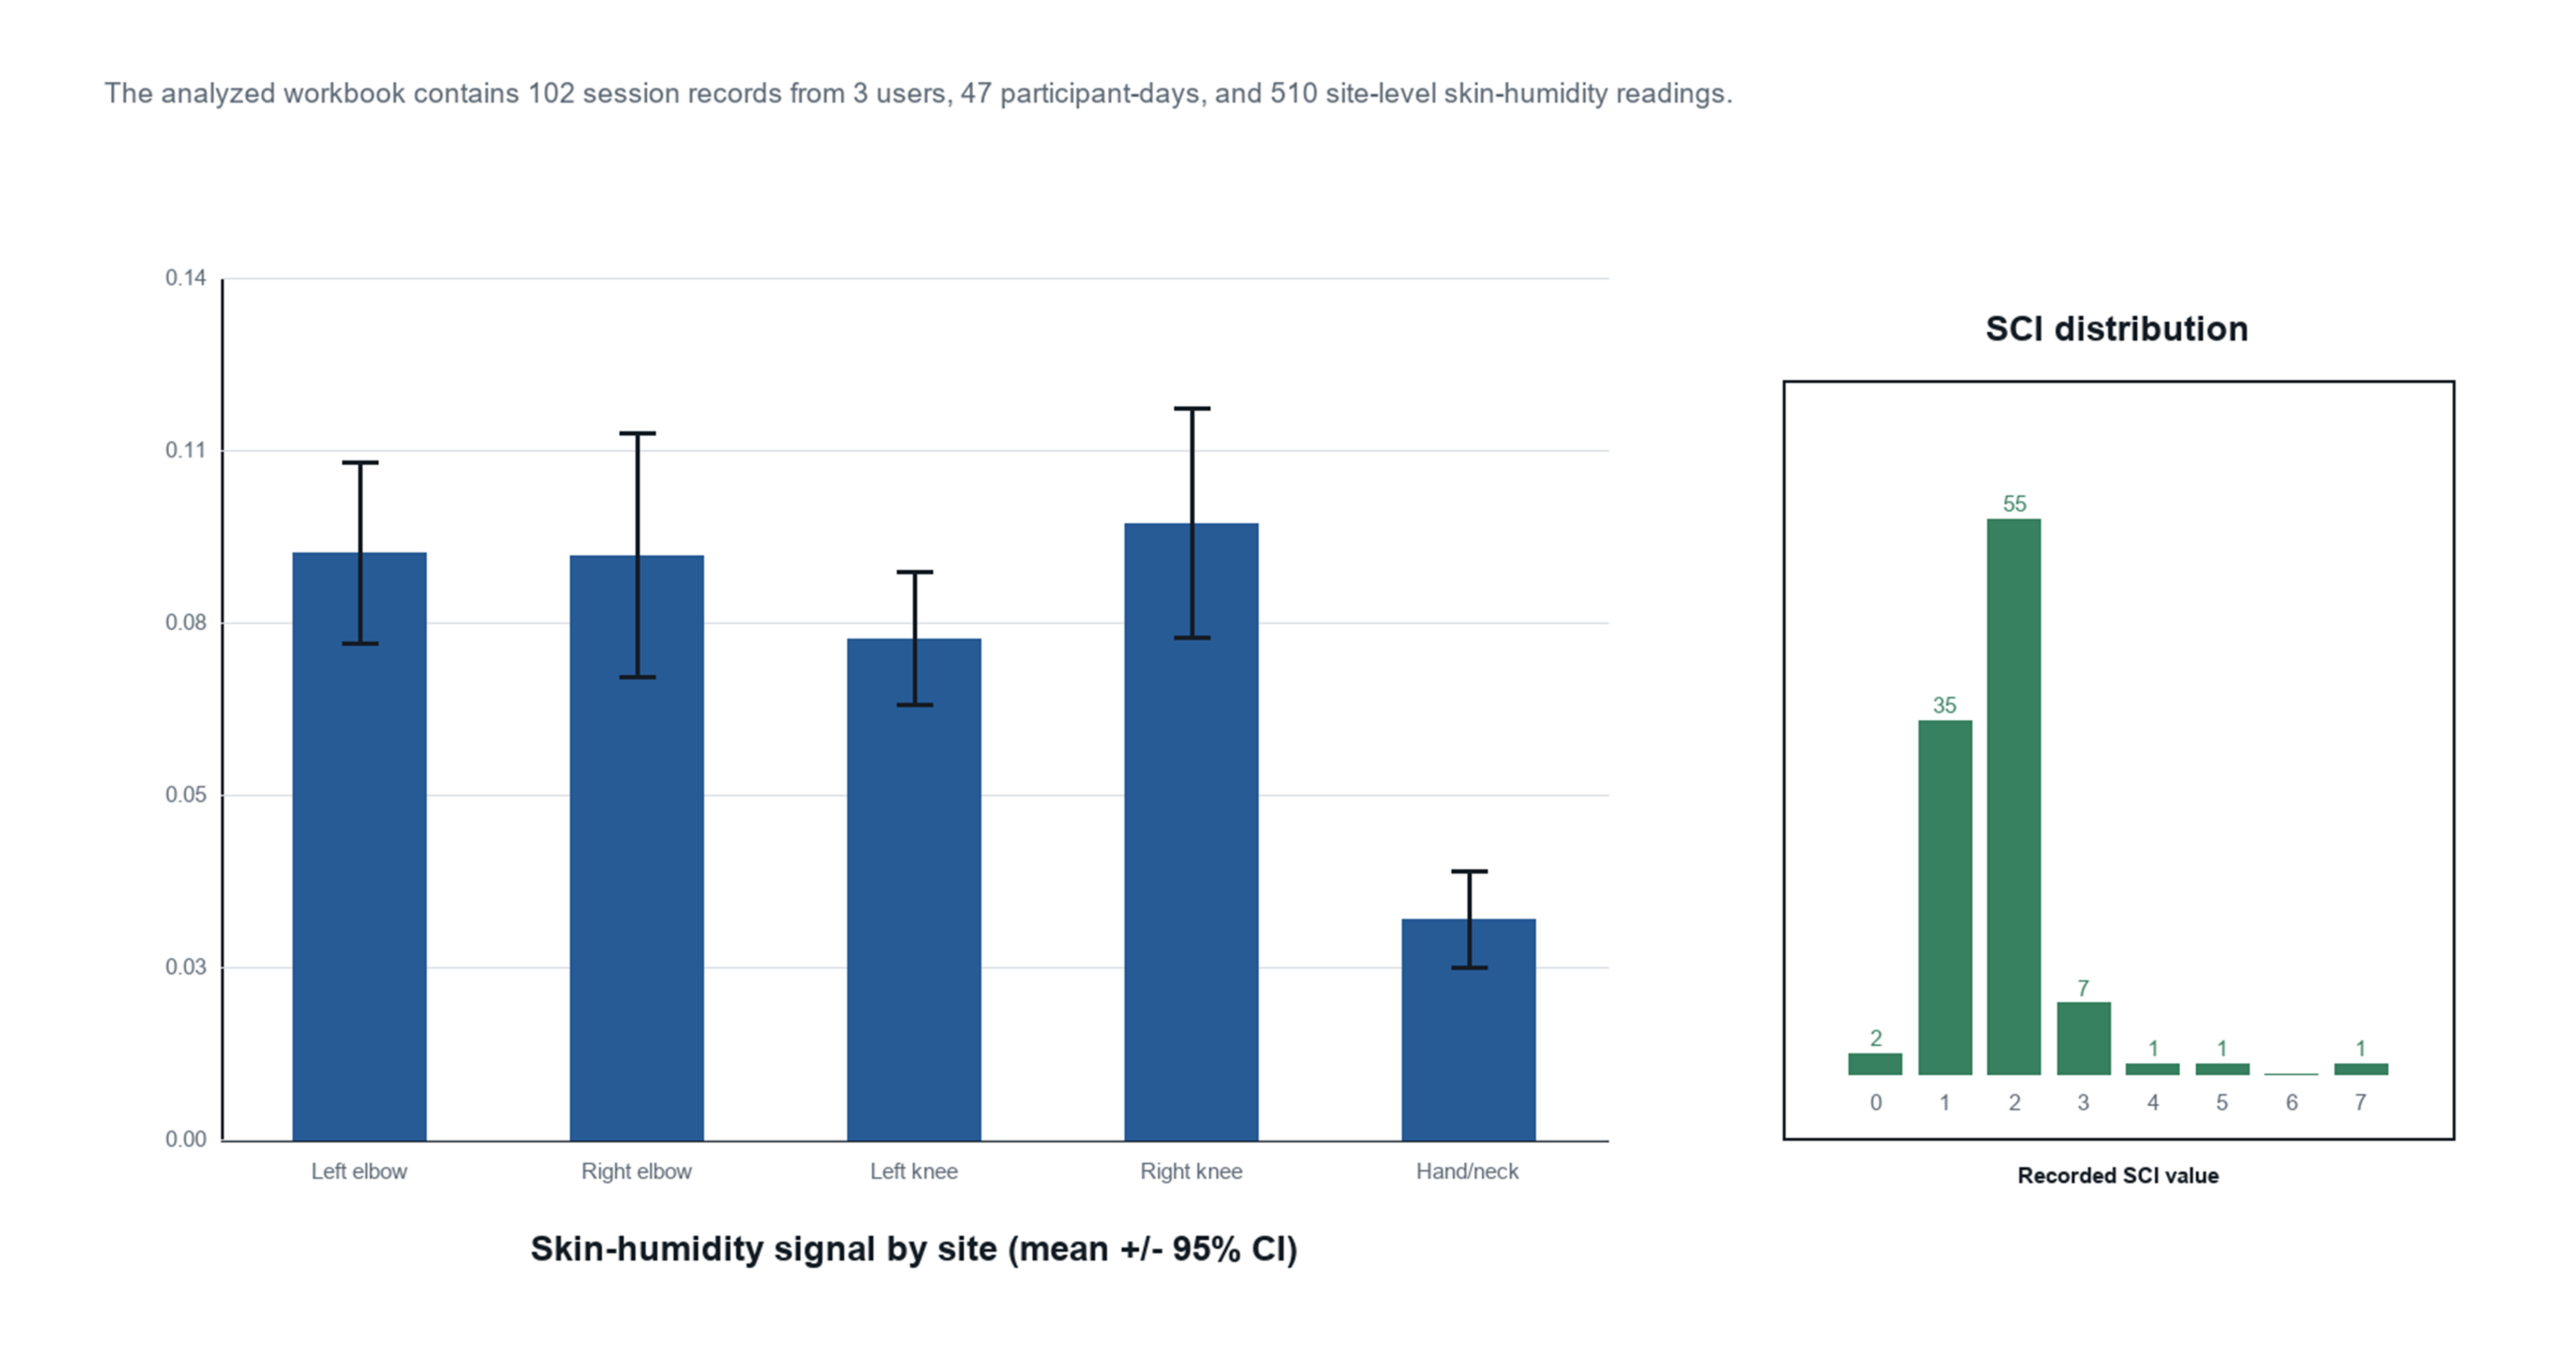
We recorded 510 valid datapoints: 3 volunteers across 36 days, 102 session records (5 data points per 1 session record). For every datapoint, it comes with our estimated SCI value. From the SCI distribution diagram, we found out 95% of the SCI values are between 1-3 while the whole SCI score range is 0-20. This aligned with the self reports from the volunteers since their skin was in good or fair condition during the testing period. We may need to get more data with different eczema levels to better represent the whole range.
From the test data, we noticed the mean skin humidity was different across different test locations. The result was close between the left elbow, right elbow and right knee (7.9%-9.7%). But the test result is much lower for hand (3.4%) which suggests we may need to have a site-specific threshold in the future to make the estimation more accurate.
Please note: the skin humidity is using percentage here (different compared to the sensor calibration hydration value AU).
| Metric | Value | Interpretation |
| Session records | 102 | Total session of recorded data |
| Datapoints | 510 | Five locations/sites were captured for each session |
| Bland-Altman bias | -0.89% | The average difference between symmetric test locations/sites |
| 95% CI for bias | -1.63% to -0.14% | Confidence interval for paired-site bias |
| Limits-of-agreement (LoA) half-width | −11.54% to 9.77% | Half-width limits of agreement of paired-site, not the repeatability of the same location. |
| Intraclass Correlation Coefficient (ICC, overall value) | 0.77 (bootstrap 95% CI 0.70-0.84) | Exploratory analysis of the paired-site agreement. |
Contralateral-site Bland-Altman and ICC Assessment
To better analyze the datapoints, we ran an exploratory assessment by pairing left-right elbow and left-right knee readings for comparison (left vs. right elbow, left vs. right knee, using python script). As listed in Table 4, the Bland-Altman bias was -0.89% with 95% CI of the bias from -1.63% to -0.14%. The LoA was from -11.54% to 9.77%. The overall ICC was 0.77 (bootstrap 95% CI 0.70-0.84), elbow ICC was 0.83 and knee ICC was 0.70. The lower knee ICC means a higher asymmetry at the knee test sites which aligned with the left-right difference data observed here (7.9% vs. 9.7%).
Left and right elbows differ in thickness, sweat gland densities and friction exposure. So we take this only as a rough check that readings are consistent across skin-sites.
Multi-day Longitudinal Case
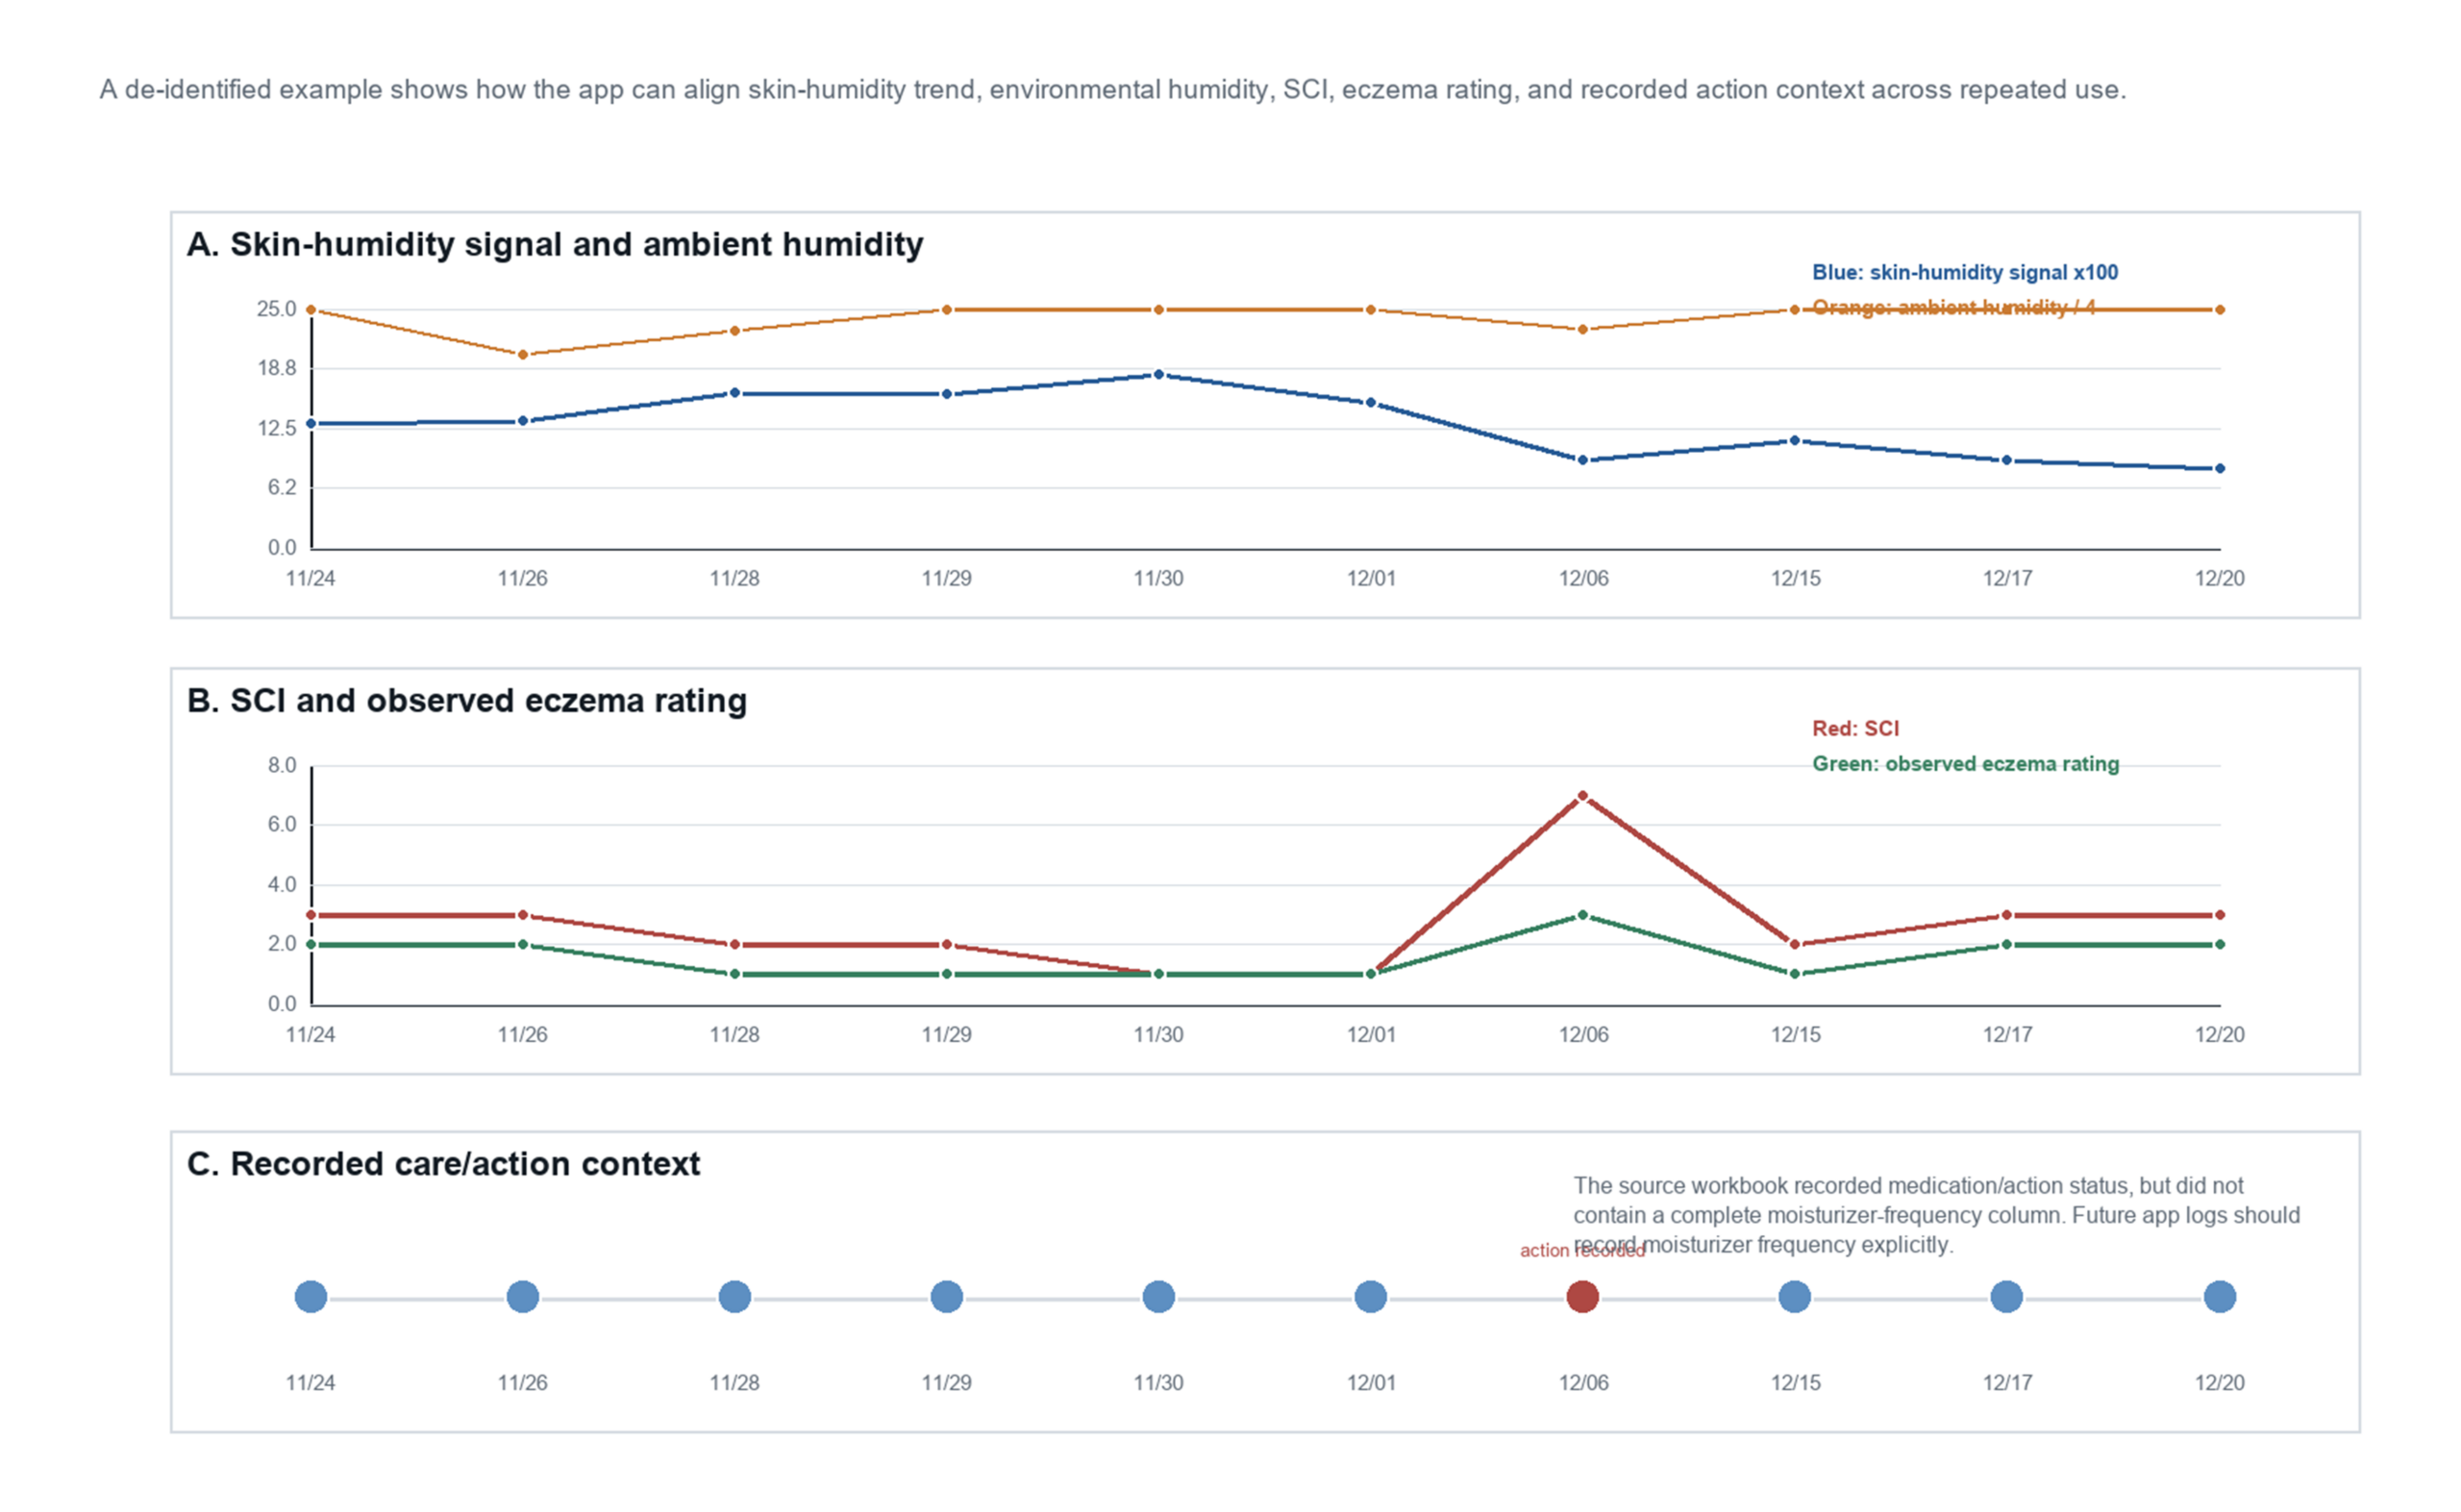
We analyzed one volunteer’s data over a multi-day period (Figure 10) to understand whether our prototype could give reasonable longitudinal estimation and recommendation. From the data, there was a flare-up event on 12/06 with an SCI of 7 (0-20 scale). Our prototype recommended that the candidate apply more moisturizer and avoid sunshine exposure. The volunteer followed the recommendation, and the following data on 12/15 showed a much lower SCI value, indicating that the symptoms had improved during that period. This case demonstrates that our prototype could provide a reasonable SCI estimation and related recommendations. However, since we didn’t have any clinical data or physician diagnoses yet, the observed improvement of symptoms could not be clinically verified.
Discussion
Engineering Value
Our methodology differentiates us in several key areas. Not only did we capture eczema on the data side, but we also integrated sensor readings like temperature and humidity, factors which we know affect eczema severity. We combined sensing, scoring, storing, and summarizing into a single pipeline, so users can easily see their own history and trends over time.
Other groups have looked at pieces separately—clinical scores5,6,7, teledermatology10,11,12, apps13,14,15,16, and wearable sensors17,18. SkinGuard’s value is pulling these pieces together into one workflow.
Trend-aware Self-monitoring and Patient-generated Data
The example of the 10-day use of the application shows in what ways its use could be useful. Considering only a single photograph or symptom score, it is not possible to understand the relationship between the skin signal, environment, and care of the patients with atopic dermatitis. However, by providing users with the ability to monitor these three factors together, SkinGuard can provide patient-generated data that can be reviewed by the patients themselves or during visits to their clinic physicians.
We did not consider in our design the need for doctors to review this data or to ensure that the patients altered their care routine after reviewing the data generated by SkinGuard. This is data that we would consider collecting in the next stage of development of SkinGuard.
SCI and API Personalization
We designed the SCI to combine sensor readings, visual observations, environment, baseline, and quality all into one consistent score. As we value transparency in the scoring process, we kept the formula open so anyone can check how it works. Because we don’t have enough user data to mirror clinical use, we haven’t optimized these weights against clinical measures like SCORAD or EASI.
The AP layer transforms data into natural-English. Since the prompt includes both current and past data points, the output is tied both to current conditions and historical data. We didn’t need to train a custom AI to do this, and thus we haven’t verified them in a clinical setting.
Practical Accessibility
Eczema is very common amongst both children and adults, which is why we kept cost as a core design metric and goal. Our system uses a standard phone for computation and data storage, plus a purpose-built sensing device assembled from off-the-shelf parts. We estimate the hardware to cost about 30 at scale. The API cost is less than $1 per user-month, so the computing can be all done in the cloud.
Limitations
There were multiple limitations in this prototype. First, we only had three users, and the testing time was short. Recruiting more users and extending the testing period would help validate the design more solidly. Second, we don’t have the corneometer model number or unit-to-unit variability data, so it is hard to reproduce calibrations under consistent conditions. Third, the left-right site comparison is only a rough consistency check; proving reliability would require more tests on various skin sites. Fourth, most of our SCI values stayed in the lower range, so we don’t know how the system performs during severe flareups when the SCI score is higher. Fifth, image quality was not consistent. Some images with poor lighting could affect visual assessment. Sixth, we did not run stress tests on the API outputs. Finally, we understand that ethics and privacy require stronger controls over how personal user data than we what did. We would need to address this systematically before moving the prototype to public testing.
Conclusion
Eczema needs daily skincare actions and long-term monitoring. Tracking over time matters. We built SkinGuard as a portable, low-cost eczema tracking system to monitor skin condition and environmental changes, as well as related skincare actions for everyday at-home use.
The prototype combines a purpose-built device, a smartphone, and an app. It adopts a three-layer architecture from sensing data collection, to SCI calculation, then to reporting. Off-the-shelf parts and a PWM-based circuit are designed and calibrated to measure skin hydration. Ambient humidity and temperature are collected from a standard chip integrated in the device. The system takes these data, eczema images and record skincare actions. Current and historical records are fed into the SCI formula for within-user tracking over time. We use ChatGPT or Claude APIs to generate a natural-language summary. The prototype was tested and found to be workable. We are going to improve the system’s reliability through a wider range of data sets and continue iterating the overall design.
Acknowledgments
We would like to thank our engineering teacher, Mrs. Dvora Celniker, for her guidance on building an engineering prototype and designing a circuit. We appreciate the volunteers who participated in our tests. We do not name them here due to privacy concerns. We also thank CESASC and Mr. Yongping Zhang, who provided us with an opportunity to demonstrate our work and receive feedback from a large audience.
References
- J. I. Silverberg, S. Barbarot, A. Gadkari, E. L. Simpson, S. Weidinger, P. Mina-Osorio, A. B. Rossi, L. Brignoli, G. Saba, I. Guillemin, M. C. Fenton, S. Auziere, L. Eckert. Atopic dermatitis in the pediatric population: a cross-sectional, international epidemiologic study. Annals of Allergy, Asthma & Immunology. Vol. 126, pg. 417-428.e2, 2021, https://doi.org/10.1016/j.anai.2020.12.020. [↩]
- Z. C. Chiesa Fuxench, J. K. Block, M. Boguniewicz, J. Boyle, L. Fonacier, J. M. Gelfand, M. H. Grayson, D. J. Margolis, L. Mitchell, J. I. Silverberg, L. Schwartz, E. L. Simpson, P. Y. Ong. Atopic Dermatitis in America Study: a cross-sectional study examining the prevalence and disease burden of atopic dermatitis in the US adult population. Journal of Investigative Dermatology. Vol. 139, pg. 583-590, 2019, https://doi.org/10.1016/j.jid.2018.08.028. [↩]
- American Academy of Dermatology Association. Eczema types: atopic dermatitis causes. https://www.aad.org/public/diseases/eczema/types/atopic-dermatitis/causes. Accessed 8 July 2026. [↩]
- American Academy of Pediatrics. Atopic dermatitis: update on skin-directed management: clinical report. Pediatrics. Vol. 155, e2025071812, 2025, https://doi.org/10.1542/peds.2025-071812. [↩]
- European Task Force on Atopic Dermatitis. Severity scoring of atopic dermatitis: the SCORAD index. Dermatology. Vol. 186, pg. 23-31, 1993, https://doi.org/10.1159/000247298. [↩] [↩]
- N. Barbier, C. Paul, T. Luger, R. Allen, Y. De Prost, K. Papp, L. F. Eichenfield, R. Cherill, J. Hanifin. Validation of the Eczema Area and Severity Index for atopic dermatitis in a cohort of 1550 patients from the pimecrolimus cream 1% randomized controlled clinical trials programme. British Journal of Dermatology. Vol. 150, pg. 96-102, 2004, https://doi.org/10.1111/j.1365-2133.2004.05696.x. [↩] [↩]
- C. R. Charman, A. J. Venn, H. C. Williams. The patient-oriented eczema measure: development and initial validation of a new tool for measuring atopic eczema severity from the patients’ perspective. Archives of Dermatology. Vol. 140, pg. 1513-1519, 2004, https://doi.org/10.1001/archderm.140.12.1513. [↩] [↩]
- J. I. Silverberg, J. Hanifin, E. L. Simpson. Climatic factors are associated with childhood eczema prevalence in the United States. Journal of Investigative Dermatology. Vol. 133, pg. 1752-1759, 2013, https://doi.org/10.1038/jid.2013.19. [↩]
- S. M. Langan, J. F. Bourke, P. Silcocks, H. C. Williams. An exploratory prospective observational study of environmental factors exacerbating atopic eczema in children. British Journal of Dermatology. Vol. 154, pg. 979-980, 2006, https://doi.org/10.1111/j.1365-2133.2006.07153.x. [↩]
- A. W. Armstrong, M. A. Johnson, S. Lin, E. Maverakis, N. Fazel, F. T. Liu. Patient-centered, direct-access online care for management of atopic dermatitis: a randomized clinical trial. JAMA Dermatology. Vol. 151, pg. 154-160, 2015, https://doi.org/10.1001/jamadermatol.2014.2299. [↩] [↩]
- H. Kornmehl, S. Singh, M. A. Johnson, A. W. Armstrong. Direct-access online care for the management of atopic dermatitis: a randomized clinical trial examining patient quality of life. Telemedicine and e-Health. Vol. 23, pg. 726-732, 2017, https://doi.org/10.1089/tmj.2016.0249. [↩] [↩]
- O. Odeshi, T. Turk, L. Fiorillo, S. Lowe, M. Dytoc. Teledermatology versus in-person visits for the follow-up of atopic dermatitis patients. Journal of Cutaneous Medicine and Surgery. Vol. 28, pg. 346-351, 2024, https://doi.org/10.1177/12034754241253192. [↩] [↩]
- A. Zvulunov, S. Lenevich, N. Migacheva. A mobile health app for facilitating disease management in children with atopic dermatitis: feasibility and impact study. JMIR Dermatology. Vol. 6, e49278, 2023, https://doi.org/10.2196/49278. [↩] [↩]
- A. Zvulunov, S. Lenevich, N. Migacheva. Mobile health app as an auxiliary tool in management of atopic dermatitis in children: randomized controlled trial. JMIR Dermatology. Vol. 8, e60479, 2025, https://doi.org/10.2196/60479. [↩] [↩]
- Z. Ali, J. A. Chrom Allerup, A. D. Andersen, J. M. Ko, J. R. Zibert, S. F. Thomsen. Using smartphone data to frequently measure atopic dermatitis severity and understand triggers: a decentralized 12-week observational study. Dermatology. Vol. 241, pg. 113-123, 2025, https://doi.org/10.1159/000542771. [↩] [↩]
- G. Marquez-Grap, A. Leung, F. Orcales, A. Kranyak, C. Johnson, P. Smith, K. Haran, H. Mills, G. Schenk, A. Kahlon, J. Kaur, N. Dhaliwal, M. Lucas, V. Rudrapatna, G. O. Cula, W. Liao. Monitoring atopic dermatitis using mobile-app based photography and surveys. Journal of Dermatological Treatment. Vol. 36, article 2555983, 2025, https://doi.org/10.1080/09546634.2025.2555983. [↩] [↩]
- E. E. Grinich, C. Topham, D. Haynes, J. Chung, E. Latour, E. L. Simpson. Validation of a novel patient-operated device for measuring skin barrier function in atopic dermatitis. Skin Research and Technology. Vol. 27, pg. 824-830, 2021, https://doi.org/10.1111/srt.13027. [↩] [↩]
- A. F. Yang, K. S. Chun, L. Yu, J. R. Walter, D. Kim, J. Y. Lee, H. Jeong, M. C. Keller, D. R. Seshadri, M. O. Olagbenro, J. W. Bae, W. Reuther, E. Wu, K. Okamoto, A. Ikoma, P. A. Lio, A. B. Fishbein, A. S. Paller, S. Xu. Validation of a hand-mounted wearable sensor for scratching movements in adults with atopic dermatitis. Journal of the American Academy of Dermatology. Vol. 88, pg. 726-729, 2023, https://doi.org/10.1016/j.jaad.2022.09.032. [↩] [↩]
- V. L. Tiase, W. Hull, M. M. McFarland, K. A. Sward, G. Del Fiol, C. Staes, C. Weir, M. R. Cummins. Patient-generated health data and electronic health record integration: a scoping review. JAMIA Open. Vol. 3, pg. 619-627, 2020, https://doi.org/10.1093/jamiaopen/ooaa052. [↩]
- P. Clarys, R. Clijsen, J. Taeymans, A. O. Barel. Hydration measurements of the stratum corneum: comparison between the capacitance method (digital version of the Corneometer CM 825) and the impedance method (Skicon-200EX). Skin Research and Technology. Vol. 18, pg. 316-323, 2012, https://doi.org/10.1111/j.1600-0846.2011.00573.x. [↩]
- M. Loden. Biophysical properties of dry atopic and normal skin with special reference to effects of skin care products. Acta Dermato-Venereologica Supplementum. Vol. 192, pg. 1-48, 1995, https://doi.org/10.2340/00015555192148. [↩]
- M. Gloor, C. Haus, J. Fluhr, W. Gehring. Do shake lotions, zinc oil and polyethylene glycol gels produce dehydration or moisturization? Skin Pharmacology and Applied Skin Physiology. Vol. 14, pg. 34-43, 2001, https://doi.org/10.1159/000056332. [↩]
- I. M. Gidado, M. Qassem, I. F. Triantis, P. A. Kyriacou. Review of advances in the measurement of skin hydration based on sensing of optical and electrical tissue properties. Sensors. Vol. 22, article 7151, 2022, https://doi.org/10.3390/s22197151. [↩]
- Y. M. Kim, J. Kim, J. Y. Lee, M. Kim, H. Kim, K. Jung, S. Eo, M. Ahn, K. Ahn. Impact of solar ultraviolet radiation on atopic dermatitis symptoms in young children: a longitudinal study. Pediatric Allergy and Immunology. Vol. 28, pg. 551-556, 2017, https://doi.org/10.1111/pai.12746. [↩]
- I. Belugina, N. Yagovdik, O. Belugina, S. Belugin. The impact of meteorological factors on the incidence of infantile atopic dermatitis. International Journal of Dermatology. Vol. 63, pg. e405-e414, 2024, https://doi.org/10.1111/ijd.17404. [↩]
- R. P. Fadadu, B. Grimes, N. P. Jewell, J. Vargo, A. T. Young, K. Abuabara, J. R. Balmes, M. L. Wei. Association of wildfire air pollution and health care use for atopic dermatitis and itch. JAMA Dermatology. Vol. 157, pg. 658-666, 2021, https://doi.org/10.1001/jamadermatol.2021.0179. [↩]
- J. I. Silverberg, D. J. Margolis, M. Boguniewicz, L. Fonacier, M. H. Grayson, P. Y. Ong, Z. C. Fuxench, E. L. Simpson. Validation of five patient-reported outcomes for atopic dermatitis severity in adults. British Journal of Dermatology. Vol. 182, pg. 104-111, 2020, https://doi.org/10.1111/bjd.18002. [↩]
- J. I. Silverberg, D. Lei, M. Yousaf, S. R. Janmohamed, P. P. Vakharia, R. Chopra, R. Chavda, S. Gabriel, K. R. Patel, V. Singam, R. Kantor, D. Y. Hsu. Comparison of Patient-Oriented Eczema Measure and Patient-Oriented Scoring Atopic Dermatitis vs Eczema Area and Severity Index and other measures of atopic dermatitis: a validation study. Annals of Allergy, Asthma & Immunology. Vol. 125, pg. 78-83, 2020, https://doi.org/10.1016/j.anai.2020.03.006. [↩]
- OpenAI. Responses API reference. https://platform.openai.com/docs/api-reference/responses. Accessed 8 July 2026. [↩]
- Anthropic. Claude API documentation: Messages API. https://docs.claude.com/en/api/messages. Accessed 8 July 2026. [↩]
- Z. Lin, S. Piao, A. Wang. Comparative evaluation of ChatGPT and ChatGLM performance in response to common queries on pediatric atopic dermatitis. Pediatric Dermatology. Vol. 42, pg. 782-788, 2025, https://doi.org/10.1111/pde.15988. [↩]
- U. Iqbal, L. T. Lee, A. R. Rahmanti, L. A. Celi, Y. J. Li. Can large language models provide secondary reliable opinion on treatment options for dermatological diseases? Journal of the American Medical Informatics Association. Vol. 31, pg. 1341-1347, 2024, https://doi.org/10.1093/jamia/ocae067. [↩]
- J. Haltaufderheide, R. Ranisch. The ethics of ChatGPT in medicine and healthcare: a systematic review on large language models. npj Digital Medicine. Vol. 7, article 183, 2024, https://doi.org/10.1038/s41746-024-01157-x. [↩]
- J. M. Bland, D. G. Altman. Statistical methods for assessing agreement between two methods of clinical measurement. The Lancet. Vol. 327, pg. 307-310, 1986, https://doi.org/10.1016/S0140-6736(86)90837-8. [↩]
- T. K. Koo, M. Y. Li. A guideline of selecting and reporting intraclass correlation coefficients for reliability research. Journal of Chiropractic Medicine. Vol. 15, pg. 155-163, 2016, https://doi.org/10.1016/j.jcm.2016.02.012. [↩]