Abstract
Objective: This research investigates the effect of behavioral and environmental factors on college students’ academic performance, measured by GPA. This was to examine the linear relationships of six daily habits: study time, sleeping, involvement in social activities, participation in extracurricular activities, physical exercise, and stress level. The research seeks to determine which habits have the most significant impact on academic achievement and what changes in habits may be most effective for improving students’ well-being.
Method: Pearson correlation coefficients were calculated for the continuous variables and Spearman’s rank correlation was determined for the ordinal stress variable, based on a Kaggle dataset consisting of 2,000 college students from Delhi, Bangalore and other surrounding areas. Multiple linear regression models were then fitted for the low-, moderate- and high-stress groups.
Results: Time spent studying is the most closely associated with a higher GPA. The involvement of social activity and participation in extracurricular activities show weak or negative correlations with academic performance. Students with high stress exhibited the best model fit. For factors associated with stress, study hours and sleep duration are the best predictors of increased stress.
Conclusion: These findings support the hypothesis that study hours are best associated with GPA. The more stressed students are, the more they study and the less they sleep. This trade-off separates high and low GPAs.
Keywords: Student lifestyle dataset, academic performance, time management, study hours, sleep duration, stress level, student wellness, Pearson correlation, Spearman correlation, multiple linear regression, coefficient of determination (R²), permutation importance.
Introduction
Background and Context
Students who go to college believe that the more time they invest in studying, the better their grades will be. However, scientific studies have shown that it is very important to get enough sleep and engage in some physical activity for the brain and psyche to function normally. Given this contradiction, an important question arises: what influence do different habits have on one another, and what is the overall impact on academic success and stress levels?
Problem Statement and Justification
This research paper examines these connections with particular emphasis on the following two questions:
1. Which lifestyle practices do correlate most strongly with GPA (as an indicator of all the grades achieved by the student in every class)?
2. What are the connections between these practices and various levels of stress?
Significance and Purpose
This study was intended to provide a data-driven account of how students manage their time. There is a statistically significant correlation between the number of hours spent studying and their GPA, which shows that better habits are linked to higher grades even though it may seem counterintuitive that spending more time studying results in greater achievement. Spending a lot of time on social activities was found to be associated with lower grades. Since the dependent variable is GPA on a 4.0 scale (with 4.00 being the highest), the results support the value of maintaining healthy habits.
Objective
Hypothesis: Among all the lifestyle habits that have been studied, the number of hours spent studying shows the strongest correlation. There is a negative correlation between the number of hours people report spending studying and the amount of sleep they get, as well as a positive correlation with their stress levels. Those individuals who experience more stress are likely to report spending more hours on academic activities and fewer hours sleeping.
Scope and Limitations
The sample is drawn from Kaggle’s data set consisting of 2,000 college students who attend university in Delhi, Bangalore, and in the surrounding cities1. Among the limitations of this sample is the fact that the information we can analyze is cross-sectional and that potential confounding factors may be included among the list of independent variables that have been excluded, for example diet and socioeconomics. Unlike some other studies which have collected such data, this one does not comprise digital recordings of activity but instead consists of self-reported levels of stress.
Theoretical Framework
The results here are in good agreement with previous research which has stressed the importance of regular habits and the quality of sleep for academic achievement. Yet this study reveals a factor that has hitherto been ignored: the individual’s perception of stress. Since the dataset contains a variable relating to stress, the analysis shows that stress affects the strength of the relationships between different habits and academic achievement. It thus appears that stress is linked to students’ performance and could influence the decisions they make about studying, socializing, sleeping and exercising.
Methodology Overview
For a Kaggle dataset consisting of 2,000 college students from Delhi, Bangalore and the surrounding areas1, Pearson correlation coefficients were calculated for the continuous variables, and Spearman correlation was applied to the ordinal stress variable. Multiple linear regression models were fitted in such a way that the analysis was carried out by stress level. A multinomial logistic regression classifier was trained to determine which habits are strong predictors of stress level.
Literature Review
There are several studies that are related to the current one. One of them is the JSTOR article entitled “The Academic Ethic and College Grades: Does Hard Work Help Students to Make the Grade2?” This article mainly demonstrates that students who study regularly and remain disciplined end up obtaining higher grades. This is in line with the findings of the present study: the students in this dataset who studied more did in fact have higher GPAs.
The other study was carried out by Horton and Snyder3 and looked at the effect of general wellness on grades. It found that students who get enough sleep, control their stress, and look after themselves are likely to do better academically. Even though the study focused more on general wellness rather than on specific daily habits, their conclusions agree with the current findings on the importance of sleep and stress.
The paper recently published by Zhang, Wang and Qu (2025)4 is once again an example of this. The researchers looked at more than three million digital activity logs from college students in China and found that eating schedules have no effect on GPA, whereas consistent routines, hygiene and self-discipline do. This result is in line with our own findings in that it is not a matter of behaving in an extreme manner but rather of having stable and healthy habits such as regular study routines and consistent sleep. However, there is one difference between them and us in that their data come from digital logs and so they are unable to measure stress directly, whereas in our dataset self-reported stress levels are included. Another difference is that this study does not examine eating habits since the dataset contains no information on them.
There is also a study which appeared in the International Journal of Environmental Research and Public Health; this study monitored 187 students over a period of three years at a high school in Montreal, Canada5. It found that changes in sleep habits were linked to changes in academic performance for both boys and girls, while the connections between a number of other lifestyle habits and the outcomes varied between female and male students. This is generally in line with the current finding that more sleep is associated with lower stress; however, the sample in that study was younger and followed over time, whereas the present study relies on a single snapshot of college students, so the comparison can only be described as suggestive rather than exact.
Together, the five studies above lead to one consistent conclusion: moderate and stable daily behaviors are more often correlated with better educational outcomes than radical ones. However, every one of them has flaws. Some are based on out-of-date information, others use limited age groups, and others indirectly measure daily behaviors. The current study was designed to address this gap in research by considering several daily behaviors together, using direct self-report measures of stress, and focusing on the most recent cohort of college students. The next section discusses daily behaviors in connection with the existing literature.
Study time. The strong association found between study hours and GPA in the present study warrants comparison with previous research. Previous studies have shown that the number of hours spent studying alone is not a reliable predictor of college GPA; instead, study quality and self-discipline have proven stronger predictors6,7,8. Meta-analyses also support this conclusion, showing that effective study habits such as planning, time management, and sustained concentration are more indicative of academic performance than the amount of time spent studying alone9,10,11. The stronger effect observed in the current data may be due to the dataset using only a single measure of daily study time, as opposed to the more detailed measures of study quality used in earlier research. Recent studies have confirmed these results. For instance, Aljaffer et al. interviewed 336 medical students at King Saud University and found that it was specific study techniques, rather than the total number of study hours, that distinguished the high achievers: actively recalling material that had just been memorized was significantly linked to a higher GPA (OR = 1.83, p = 0.05), as was studying because of a sense of self-fulfillment (OR = 1.93, p = 0.04)12. In a larger sample, Sridi et al. interviewed 701 Tunisian medical students and found that each additional hour of daily revision was independently associated with better academic performance (OR = 1.08, 95% CI 1.03–1.13, p = 0.003), with students reporting a median of 4 hours of study per day13. Both studies are cross-sectional and based on self-report, as in the present study, and both state that although study time is important, the way it is used is of equal importance.
Sleep. Studies that directly measure sleep, as well as meta-analyses of these studies, generally indicate that sleep quality, duration, and consistency are only weakly associated with improved academic performance. Several reviews report that sleep duration alone is often weakly correlated with grades or not correlated at all14,15,16,17. These findings align with the present study, which observed almost no direct correlation between sleep and GPA. This outcome also clarifies why sleep became more relevant when the entire daily time allocation was analyzed using compositional methods. The null result is further supported by recent primary research: in a sample of 701 Tunisian students surveyed by Sridi et al., neither sleep duration nor physical activity showed a significant association with academic performance, whereas study time did13. The convergence of these two independent self-report datasets on a non-significant relationship between sleep and academic performance suggests that this pattern is not unique to the present sample.
Physical activity, extracurricular, and social activity. Reviews of exercise and grades usually find a positive but small link, and they also suggest that regular exercise can help students manage stress18,19. The two other lifestyle factors which showed the weakest connections in the current data have received the least attention in the literature. Lumley et al. interviewed 700 final-year medical students from 20 UK medical schools and found that the amount of time spent on extracurricular activities had only a minimal link with academic achievement, whereas greater hours of studying during term time and during revision were linked to higher attainment20. They also discovered that higher study hours related to a lower self-reported quality of life (rho = −0.13, p < 0.01) and concluded that study skills might be more important than the number of hours spent studying. This is very similar to the findings in the present study, since extracurricular hours showed no significant association with GPA (r = −0.032, p = 0.15) while study hours at the same time were the strongest correlate of GPA and the best predictor of stress. The evidence concerning social activity is less extensive and usually concentrates on the type of socializing rather than on how long it lasts. In a cross-sectional study of 269 medical and non-medical students at Qassim University, Abdulsalim et al. looked at how social media addiction is related to anxiety and academic performance21. The way they framed the issue is relevant here because the present dataset records only total social hours, without distinguishing the context or the quality of that time, which may be one reason for the weak association observed (r = −0.086).
Stress. Traditionally, higher stress has been considered as the factor linked to poor well-being and, in many cases, low academic performance. Thus, the positive correlation between stress and GPA in the current research warrants special mention. The pattern indicates that the stress reported by the students in the current sample can be regarded as an indicator of students’ engagement and effort, not stress per se, since the most hard-working students have the highest levels of stress22,23,24. The two most recent studies, conducted independently of the current one, directly confirmed this hypothesis. So, according to Aljaffer et al., the medical students of the high GPA group had higher anxiety and depression levels than the students of the low GPA group12. Also, according to Sridi et al., moderate stress was associated with better performance in a univariate analysis, based on the inverted-U shape of the arousal-performance curve, which indicates that moderate stress helps concentration, while excessive stress interferes with it13.
Methods
Research Design
The design used was quantitative, observational, and cross-sectional. Pearson correlation was used to assess the relationship between the continuous variables. The Spearman correlation was utilized in the ordinal stress variable. Multiple linear regressions were developed, with analysis stratified by stress level. A multinomial logistic regression classifier was fitted to determine the predictors of stress level.
Participants or Sample
The data comes from a dataset on Kaggle that is available online and gives a detailed account of students’ lifestyle patterns, together with 2,000 records of their daily habits in the areas of study, extracurricular activities, sleep, socializing and physical activity. As stated in the description of how the data was collected, “The data was obtained via Google Form surveys from students in various colleges in Delhi, Bangalore and other cities.”
Data Collection
The dataset is from S. Kumar, who collected the data via Google Forms, with surveys sent to college students in Delhi, Bangalore, and other nearby cities1. The data are available in the Kaggle repository. In the current study, the dataset was obtained using version DSV/9876359. No modifications were made to the published data; the GPA values were analyzed exactly as distributed. The published dataset does not contain any information about the sampling technique, validation of the questionnaire, response frequency, or the data-cleaning procedure prior to publication. This issue is a known limitation as the data cannot be independently verified. No records were duplicated, nor were there any values outside the expected range. All 2,000 records are utilized for further analysis. The analyzed dataset contains a single academic-outcome variable, GPA on a four-point scale (observed range 2.24 to 4.00; mean 3.12; SD 0.30). There are no CGPA values or institutional grade scales included. The description states that grades have been transformed to a four-point scale; however, the transformation formula, minimum scale range, and rounding have not been provided. Thus, it is impossible to replicate the conversion process, and a sensitivity analysis on the original dataset is not feasible. Consequently, all results are reported on the four-point GPA scale; therefore, this can be considered a limitation of using the secondary dataset. To avoid problems related to the absolute values of GPA, the results of the correlational analysis are interpreted in terms of the direction and magnitude of the association and are confirmed by Spearman’s rank correlation coefficients. These statistical measures are invariant under monotonic rescaling of GPA; thus, they are not affected by the choice of transformation formula.
Variables and Measurements
An overview of all the variables used in the analysis can be found in Table 1. The GPA uses a 4-point scale (even though it was initially gathered as CGPA, it was converted into the 4-point GPA format for easier use by international researchers).
| Variable | Values (Mean ± Standard Deviation) |
| GPA | 3.12 ± 0.30 |
| Study_Hours_Per_Day | 7.48 ± 1.42 hours |
| Sleep_Hours_Per_Day | 7.50 ± 1.46 hours |
| Social_Hours_Per_Day | 2.70 ± 1.69 hours |
| Extracurricular_Hours_Per_Day | 1.99 ± 1.16 hours |
| Physical_Activity_Hours_Per_Day | 4.33 ± 2.51 hours |
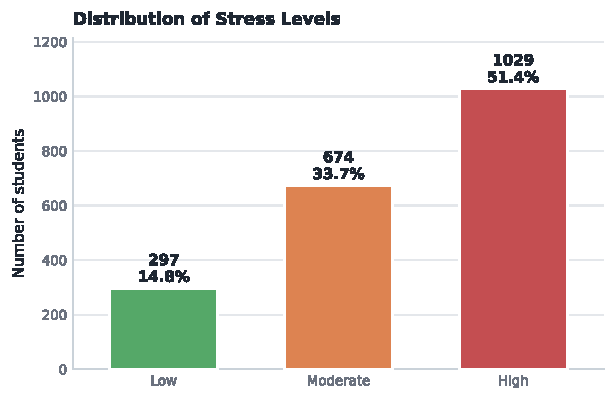
Since, for Stress_Level it is broken down into Low, Moderate, and High, the number and the percentage of the total were found for each:
Low: 297 (14.8%)
Moderate: 674 (33.7%)
High: 1029 (51.4%) (Figure 1).
Procedure
The stress level was regarded as an ordinal variable, given the values 0 for Low, 1 for Moderate, and 2 for High. Pearson correlations were employed to examine the linear relationships between GPA and each of the factors relating to the daily routine. Spearman’s correlations were used to identify the monotonic relationships between stress and GPA, as well as between stress and each of the daily habits. Several regression models were fitted, and regression analysis was also performed within each stress group. A multinomial logistic regression classifier was fitted, together with permutation importance being calculated.
Data Analysis
Pearson correlation coefficients, r, were computed for continuous variables, using the scipy.stats.pearsonr function.
For Stress Level, which is ordinal, Spearman correlation (scipy.stats.spearmanr) was applied. It was used to capture monotonic associations between stress and both GPA and lifestyle habits.
Multiple Linear Regression
Multiple linear regression models were also fitted to evaluate the association between lifestyle factors and GPA. The model included the five continuous lifestyle variables and the stress code:
The beta (β) coefficients in a regression model represent the expected change in the dependent variable (GPA) for a one-unit increase in an independent variable, while holding all other variables constant.
The regression was carried out using sklearn.linear_model.LinearRegression and the fit was measured by means of R² (more properly referred to as the coefficient of determination). Regression diagnostic plots (comparing predicted to actual GPA and showing residuals against fitted values) are given in the Results section. Multicollinearity was examined by means of variance inflation factors (VIFs), these being calculated both for the full model and after removing one time-use variable at a time to consider the dependence caused by the fixed daily time budget. Since the group of five time uses forms a closed composition, the daily time allocations were also analyzed in isometric log-ratio (ILR) coordinates: the hours were changed into proportions of the 24-hour day and presented as four ILR coordinates, which were used in place of the five original time-use variables in the regression. This eliminates the rank deficiency resulting from the fixed daily budget, and as a result the coefficients can be identified and indicate the effect of reallocating time between different activities rather than the effect of adding time in isolation. Since the log-ratio transformation is undefined when the value is zero, the 50 cases (2.5% of the sample) in which there were zero hours reported for social, extracurricular or physical activity were adjusted by means of multiplicative replacement; each zero was set to 0.065 hours, this being approximately 65% of the 0.1-hour rounding interval of the data, and the other parts of the record were rescaled to ensure that the total of 24 hours was maintained. The fitted model was then transformed into a time-reallocation table that shows the predicted change in GPA when one hour per day is transferred from one activity to another, the evaluation being made at the compositional mean.
Stratified Regression by Stress Group
To assess stress moderation of the effect of daily lifestyle habits on GPA, the regression model was refitted for each stress group (Low, Moderate, High). Each of these sub-regressions included the same predictors (minus the stress code). By comparing regression coefficients and R² between groups, we can assess how daily habits affect GPA across stress levels.
Stress Classification and Permutation Importance
The Multinomial Logistic Regression Classifier (scikit-learn implementation) has been created to identify habits that strongly predict stress levels. All continuous predictor variables were standardized. The contribution of each feature was estimated using Permutation Importance, a technique that measures the decrease in model performance when each feature is permuted. The data were split 80%/20% for training/testing via stratified sampling to preserve the proportions of stress categories, and the standardization parameters were estimated from the training set. Generalization has been evaluated using stratified 5-fold cross-validation on the whole dataset and held-out accuracy, with the confusion matrix built on the 20% held-out test set. As the classes of stress are imbalanced (14.8% Low, 33.7% Moderate, 51.4% High), the classifier was re-fitted using balanced class weights. Permutation importance was calculated on the held-out test set 30 times, with the results given as the mean and standard deviation of the decrease in accuracy for each feature. The correlational analysis is presented in an exploratory manner, while the classifier serves as the research’s predictive component.
By doing so, this analysis provides a ranking of which habits most strongly predict stress level.
Software and Reproducibility
All analyses were conducted in Python using the following libraries:
• pandas (data handling)
• NumPy (numerical operations)
• SciPy (correlation tests)
• scikit-learn (regression models, permutation importance, preprocessing)
• Matplotlib (visualization)
To enhance reproducibility, the analysis was performed on the public Kaggle dataset (version1DSV/9876359). All data preprocessing and modeling steps are described above. The pre-processing included de-duplication, range validation, GPA transformation, and ordinal labeling of stress levels (Low = 0, Moderate = 1, High = 2). The modeling included Pearson & Spearman correlations, a multiple linear regression model, stress-level-stratified regressions, and the standard multinomial logistic regression classifier.
Code availability
Ethical Considerations
The data came from surveys administered using Google Forms. The data set was freely available on Kaggle1. In this study, only secondary, publicly available data were utilized, which involved no human participant interaction; hence, there was no need to seek ethical clearance separately for this analysis. There is no mention in the publicly available dataset documentation that the first survey obtained institutional review board or ethical approval and informed consent from the students who responded to the survey, which is a limitation of the study. There were no identifiable individual details in the dataset obtained.
Results
The dataset contains 2,000 college students1, with different daily lifestyle habits and GPA scores (converted from CGPA by the dataset author prior to publication of the dataset). Mean GPA was 3.12 ± 0.30, ranging from 2.24 to 4.00. Stress levels were skewed toward higher stress: 14.8% Low, 33.7% Moderate, and 51.4% High. A summary of all variables is in Table 1.
Correlation between Lifestyle Habits and GPA
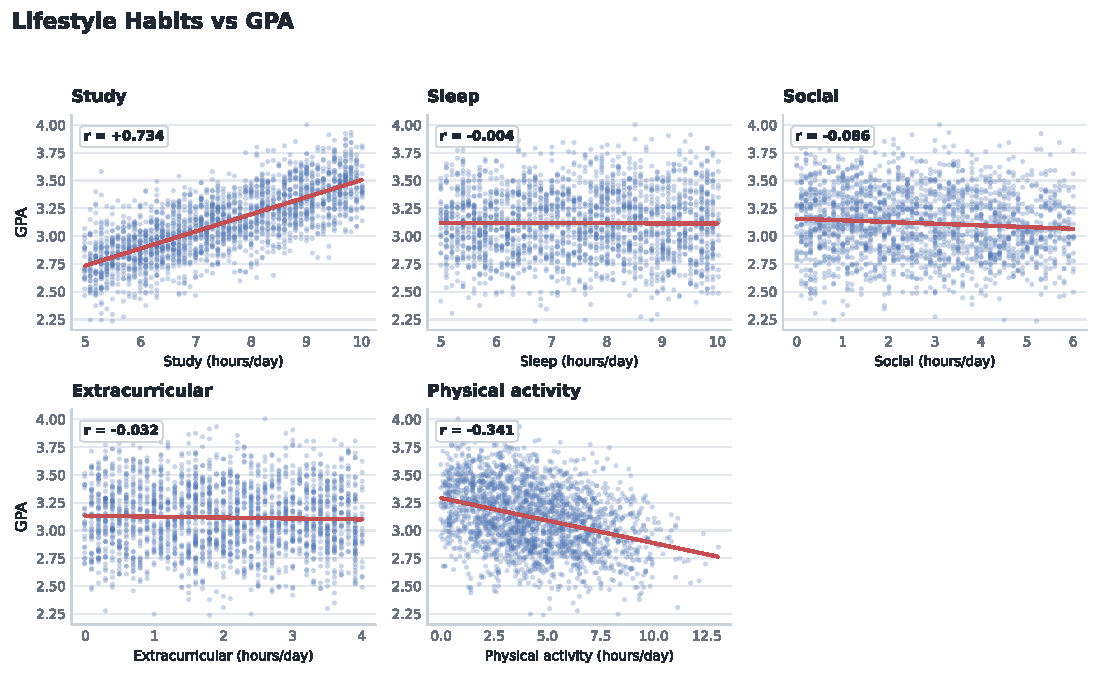
The Pearson correlation method was used to examine linear relationships between GPA and the continuous lifestyle factors. Stress, an ordinal variable, is handled separately using the Spearman correlation method and is presented below instead of the list of Pearson correlation results. The study factor had the highest positive correlation with GPA (r = 0.734, p < 0.001), followed by the rest of the factors:
Study_Hours_Per_Day: r = 0.734, p < 0.001
Physical_Activity_Hours_Per_Day: r = -0.341, p < 0.001
Social_Hours_Per_Day: r = -0.086, p < 0.001
Extracurricular_Hours_Per_Day: r = -0.032, p = 0.1503
Sleep_Hours_Per_Day: r = -0.004, p = 0.8484
These associations are illustrated in Figure 2, which shows scatter plots and regression lines depicting the association between GPA and each lifestyle factor. In each panel in Figure 2, the direction of the relationship is indicated by the direction of the slope of the regression line, while its magnitude is indicated by the degree to which points are dispersed around the line. The study hours panel shows an obvious upward trend with tightly dispersed points, indicating a strong positive correlation (r = 0.734). The physical activity panel displays a downward slope, consistent with the moderately negative correlation (r = −0.341). The social activity, extracurricular activity, and sleep panels display relatively flat lines with scattered points, consistent with weak or zero correlation found above. In particular, the virtually flat line displayed in the sleep panel explains why sleep exhibited almost no linear association with GPA (r = −0.004). As mentioned in the Limitations section, the slopes indicate relationships within a time-budget context.
Stress Level, GPA, and Lifestyle Patterns
Stress level was encoded as an ordinal variable (Low = 0, Moderate = 1, High = 2). Spearman correlations reveal:
• Study hours ↑ stress (ρ = +0.727, p < 0.001)
• Sleep ↓ stress (ρ = −0.313, p < 0.001)
• Physical activity ↓ stress (ρ = −0.208, p < 0.001)
Stress level was positively associated with GPA (Spearman ρ = +0.555, p < 0.001), indicating that students who reported higher stress also tended to report higher GPAs. Because stress is an ordinal variable, this association is reported using Spearman rather than Pearson correlation.
These patterns are visualized in Figure 3, which shows GPA and each lifestyle habit by stress level as boxplots.
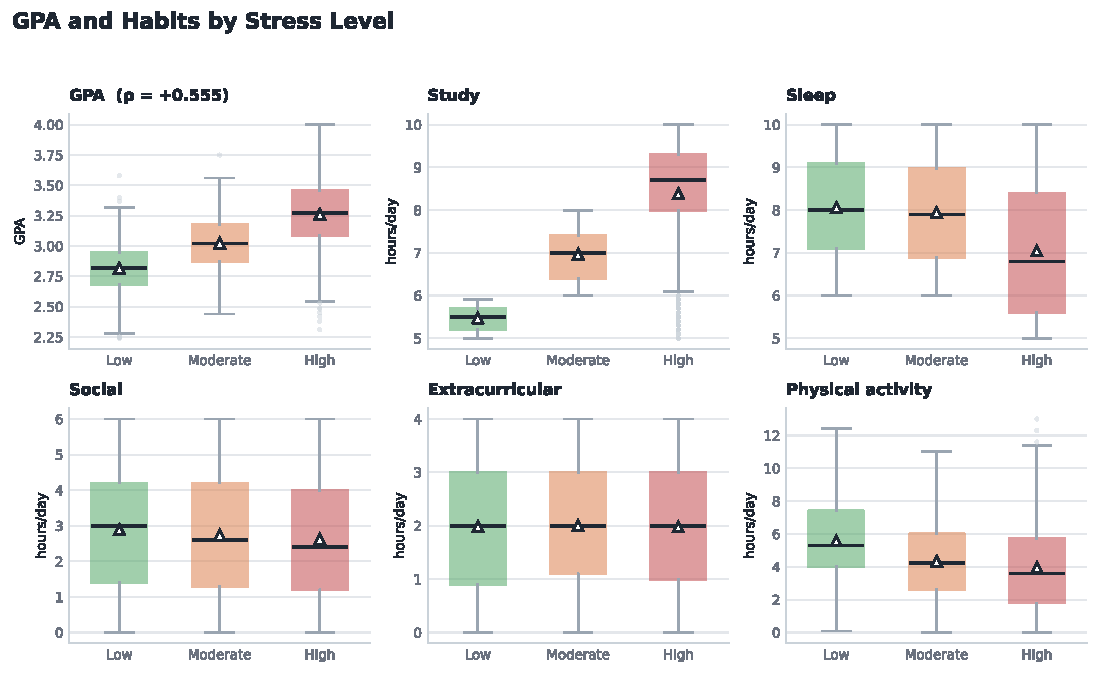
In the boxplots of Figure 3, the green triangle is the mean GPA for that group, the line is the median, and the box spans the middle 50% of the data.
In these figures, high-stress students show:
• the highest study hours,
• the lowest sleep duration,
• reduced physical activity,
supporting the correlation results above. Collectively, the plots reveal that highly stressed students engage more in academic work and reduce recovery-oriented habits.
Multiple Regression Models Predicting GPA
In the multiple linear regression analysis, both the lifestyle factors and the stress index were used, explaining 54.1% of the variance in GPA (R² = 0.541). The factor describing time dedicated to studying showed the strongest positive coefficient (+0.126); the factors describing time dedicated to sleeping, socializing, participating in extracurricular activities, and doing physical exercise showed weak negative coefficients. (Please see the full results in the repository for the analysis.) Interpreting the results literally, it is possible to state that among the successful students, a better GPA was associated with dedicating more time to studying, sleeping the same number of hours as before, and perhaps less time to socializing and physical activities.
There are many issues with this interpretation. The five time-use variables are compositional in that each student spent exactly 24.00 hours altogether on the five activities (on average: 7.48 hours studying, 7.50 hours sleeping, 2.70 hours on social activities, 1.99 hours on extracurricular activities and 4.33 hours on physical activity). Since these variables add up to a constant value, they are perfectly linearly dependent; as has already been explained, a regression which includes all five variables is rank-deficient and therefore the individual slopes cannot be determined. The negative coefficients for sleep, social, extracurricular and physical activity hours therefore do not indicate independent negative relationships with GPA. These coefficients do in fact exist (although they are artificially enlarged in magnitude) as a result of the constraint that the total must remain constant: if, for a given student who maintains a 24-hour day, study time increases, then GPA can only rise if some other time use is given up.
The artificial elevation of the estimated coefficient for study hours vanishes whenever any of the time-use variables is excluded from the regression, thus removing the linear dependence. To show this formally, we calculated the variance inflation factor (VIF) for each explanatory variable in the full model. All the five time-use variables had a VIF that was effectively infinite, whereas the stress code (which was not constrained by the time budget) had a reasonable VIF of 2.8. When physical activity hours were removed from the model, all the other VIFs returned to their expected values: study hours 2.60, sleep hours 1.33, social hours 1.08, extracurricular hours 1.02, and stress code 2.84 (Table 3).
The problem was dealt with in a formal way by applying isometric log-ratio (ILR) coordinates, which is a standard approach when data sums to a constant total. The transformation takes place in two stages. In the first stage, the five hourly variables are turned into proportions of the day; in the second stage, these proportions are expressed as four ‘balances’, each one comparing a pair of activities against each other. Since five variables that add up to a constant contain only four independent pieces of information, the four balances include all the information without the redundancy that had affected the previous model. The balances are uncorrelated by design, so the collinearity problem is eliminated (all VIFs are ≤ 3.1). Regressing GPA on the four balances along with the stress code accounted for 47.1% of the variance (R² = 0.471, adjusted R² = 0.470; F(5, 1994) = 355.5, p < 0.001), and all four balances were found to be statistically significant (p < 0.001).
The amount of time spent studying was a major factor in this model, showing up in the first equation and having a coefficient of +0.75 (SE = 0.04, t = 17.9, p < 0.001). When compared with all the other uses of time put together, study time was found to be positively related. Furthermore, the more hours one slept, the higher his or her GPA was, with sleep appearing in the second equation with a positive sign and being contrasted against the three leisure activities.
To interpret these balances, it is necessary to consider the entire situation. The raw data indicate that students with higher GPAs sleep almost as many hours as those with lower GPAs. This finding, however, depends on how students distribute their time over the full 24-hour period. If the amount of time spent studying is kept the same, then those students who spend a larger share of the day sleeping achieve higher GPAs, thus explaining the null result found in the current data in the light of the existing literature.
Since the coefficients in ILR space are not directly interpretable, the model was transformed back into terms of hours. Table 2 gives the predicted change in GPA that results when one hour per day is shifted from one activity to another, the total number of hours remaining at 24 and all values being based on the compositional mean (study 8.20 h, sleep 8.22 h, social 2.17 h, extracurricular 1.66 h, physical activity 3.75 h; baseline predicted GPA 3.116). The pattern is asymmetric: shifting an hour from any other activity into study is linked to a gain of about +0.11 to +0.13 GPA points, whereas shifting an hour out of study is associated with a comparable loss. All reallocations that do not involve study are nearly zero, varying from −0.007 to +0.028. This means that the previously negative coefficients for sleep, social, extracurricular, and physical activity should be understood as due to the fixed time budget rather than as indicating that these activities are harmful. Only the time spent on study shows a substantial relationship with GPA; the other four activities show essentially no change.
| Gains an hour ↓ / loses an hour → | Study | Sleep | Social | Extra. | Physical |
| Study | — | +0.127 | +0.115 | +0.126 | +0.114 |
| Sleep | −0.131 | — | −0.006 | +0.005 | −0.007 |
| Social | −0.110 | +0.028 | — | +0.026 | +0.014 |
| Extracurricular | −0.111 | +0.026 | +0.014 | — | +0.013 |
| Physical | −0.114 | +0.023 | +0.011 | +0.022 | — |
| Predictor | Full model (all 5 time-use vars) | Reduced model (1 var dropped) |
| Study hours | ∞ (rank-deficient) | 2.60 |
| Sleep hours | ∞ (rank-deficient) | 1.33 |
| Social hours | ∞ (rank-deficient) | 1.08 |
| Extracurricular hours | ∞ (rank-deficient) | 1.02 |
| Physical activity hours | ∞ (rank-deficient) | dropped |
| Stress level (code) | 2.8 | 2.84 |
Model diagnostics appear in Figure 4 (predicted versus actual GPA, and residuals versus fitted values).
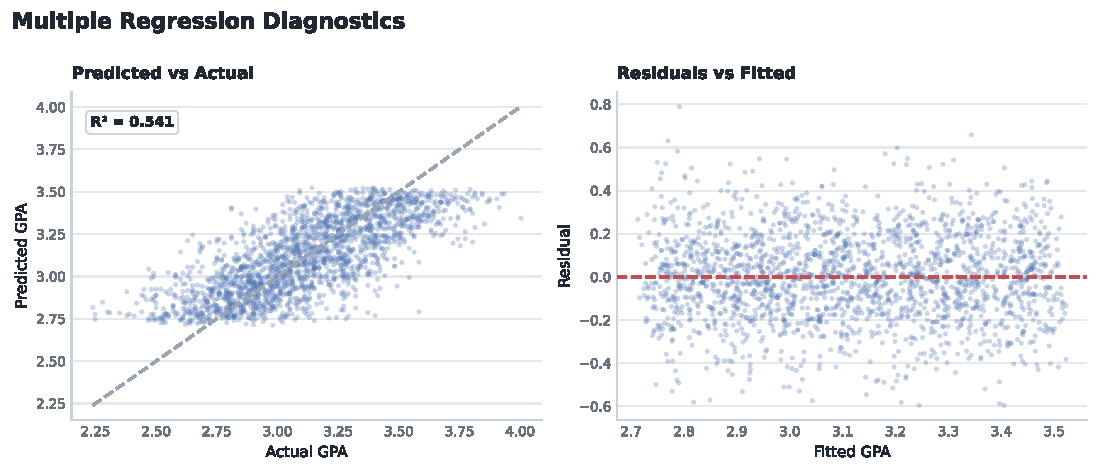
The left panel of Figure 4 shows that predictions align closely with actual GPAs, supporting the model’s fit, and the right panel indicates mostly homoscedastic residuals with no obvious violations of assumptions.
Regression by Stress Level
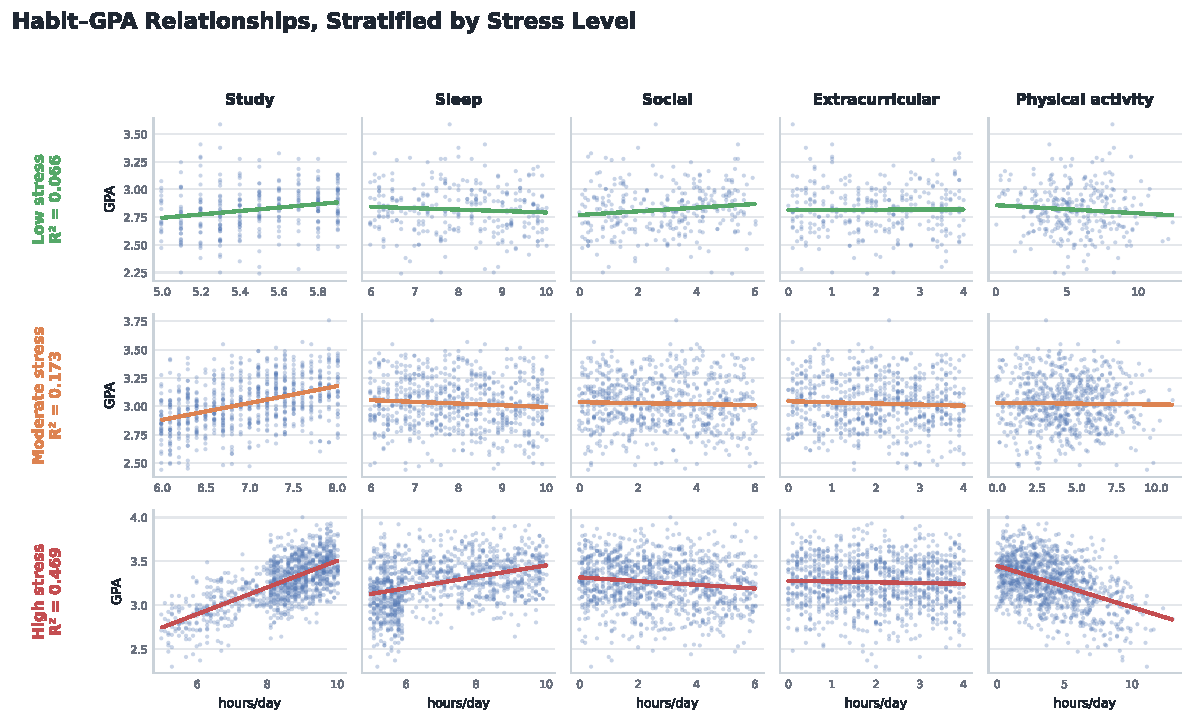
To examine whether stress moderates the relationship between lifestyle habits and GPA, the regression model was re-fit separately for each stress group.
Model fits were:
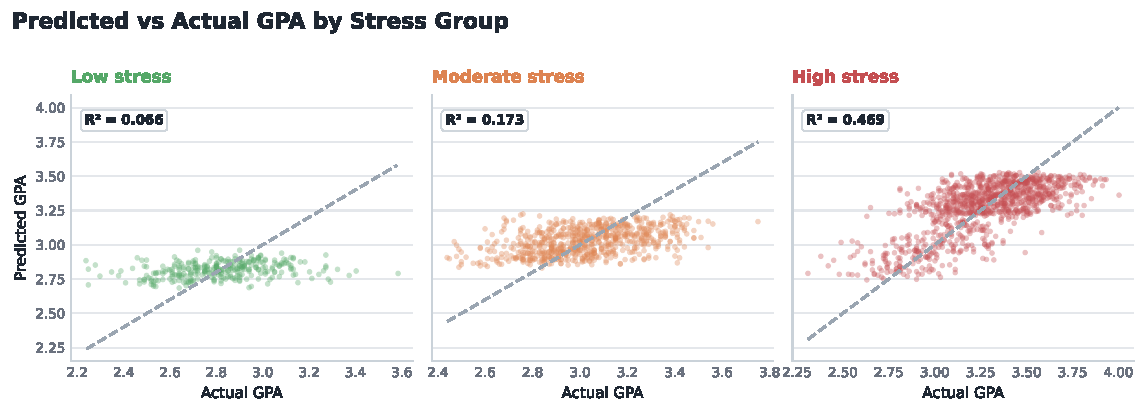
• Low Stress: R² = 0.066
• Moderate Stress: R² = 0.173
• High Stress: R² = 0.469
This indicates that lifestyle habits predict GPA far more strongly in high-stress students.
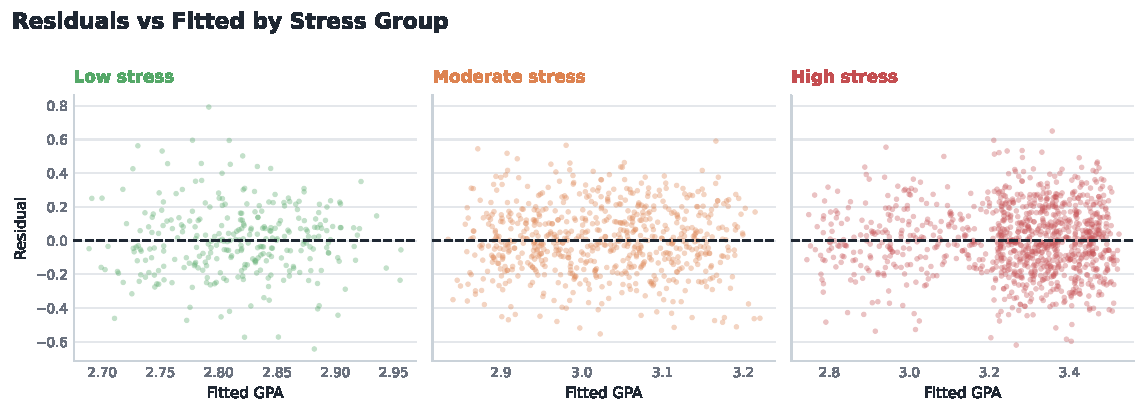
Included among the supporting visual aids are the following graphs showing the relationship for each stress group. In all the graphs in Figure 5, the important trend to be noted is that the relationship between the two becomes stronger as the level of stress goes up; the scatter is greatest and the fitted lines are least steep in the low stress graph and the data points fall closest to the fitted line in the high stress graph, mirroring the increase in the R² value in each group (0.066, 0.173, 0.469). The other plots in Figure 6 show a similar trend, with the high-stress predictions being closest to the diagonal line. Residuals versus fitted values within each stress group are shown in Figure 7.
Stress Prediction Using Permutation Importance
To identify the lifestyle factors that predict the stress category to which a student belongs, we constructed a multinomial logistic regression classifier. With 80 percent of the data allocated to training and 20 percent to testing, and standardized predictor variables, this classifier achieved 84.3 percent accuracy on the test sample, which had not been seen by the model during training. The accuracy of five-fold cross validation was 82.4 percent (with a standard deviation of 1.5 percent). The high correspondence between these two measures indicates the classifier’s good performance on unseen data and the absence of overfitting. Since the stress-category classes have different proportions (14.8 percent – Low Stress, 33.7 percent – Moderate Stress, 51.4 percent – High Stress), we repeated the analysis with balanced class weights. The accuracy did not change (84.3 percent), thus proving the absence of bias due to imbalance in the previous results. Below is the confusion matrix for the unweighted model (rows denote real stress category values and columns – predicted values): Low [54, 5, 0], Moderate [3, 103, 29], High [8, 18, 180]. Most errors fell between adjacent categories, though eight high-stress students were misclassified as low stress. For comparison, it should be noted that the above correlation analyses were exploratory, whereas this classifier represents the predictive component of our work.
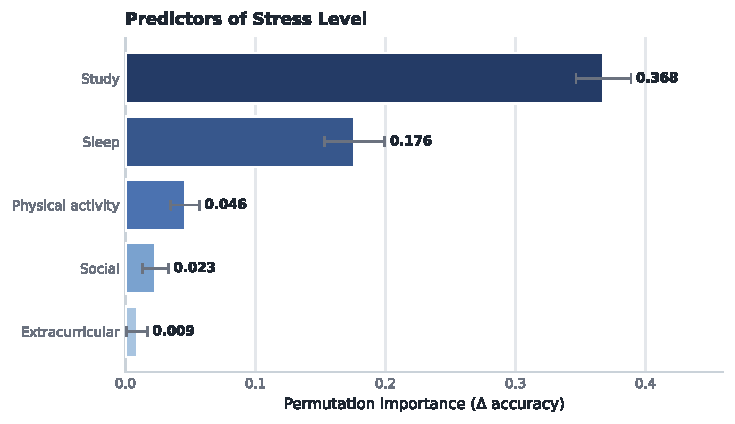
Permutation importance revealed:
• Study hours: Δ accuracy = 0.368 ± 0.021 (mean ± SD over 30 permutations)
• Sleep hours: Δ accuracy = 0.176 ± 0.023
• Physical activity: Δ accuracy = 0.046 ± 0.011
• Social hours: Δ accuracy = 0.023 ± 0.010, and extracurricular hours: Δ accuracy = 0.009 ± 0.008. The 95% interval for extracurricular hours (−0.007 to 0.024) includes zero, so its contribution is not distinguishable from chance.
These scores are shown in Figure 8.
Discussion
Restatement of Key Findings
This research examined how students’ daily habits, such as study time, sleep, social interaction, exercise, and extracurricular activities, relate to both GPA and stress. The data broadly support the thesis that study time has the largest association with GPA and that heavier study loads are associated with higher stress.
Implications and Significance
A takeaway from this analysis was the very strong positive association between self-reported study time and GPA (r = 0.734): Students who put more time into studying also tended to get better grades. Because these data are observational and the time-use variables are constrained to sum to 24 hours, this association should not imply that studying more would, by itself, raise a student’s GPA. The moderate negative correlation observed for physical activity (r = −0.341) is also explained by this budget constraint and does not imply that exercising causes students to have lower grades. Due to the compositional structure of the data, the negative associations observed for sleep, social, extracurricular, and physical activity reflect the fixed 24-hour time budget rather than independent relationships with GPA.
Stress interacted with these relationships in complex ways as well. Students who put more time into studying also reported feeling more stressed and getting less sleep. The Spearman correlations calculated showed that students who spent more time studying also had stronger associations with stress (ρ = 0.727) and inverse associations with sleep (ρ = −0.313). Stress was also positively correlated with GPA (ρ = 0.555): the students who put in the most academic effort tended to also report the highest stress levels. These relationships support the interpretation that students who spend longer hours studying tend to sacrifice sleep and other activities to accommodate their study schedule. However, due to the cross-sectional design of the study, we cannot conclude anything about the direction of these associations.
Splitting the regression models by students’ self-reported stress levels illustrated this. Students who were more stressed had the highest model fits of R² = 0.469. This implies that for students who experience higher amounts of stress, their habits can explain about 47% of the variance in their GPA. For students in the moderate-stress group, this relationship was weaker (R² = 0.173), and for students who experience less stress, their hourly habits were not very predictive of GPA (R² = 0.066). It seems that when students are under a larger amount of pressure, how they spend their day, specifically how much they study and sleep, is closely related to their grades. However, when students experience less stress, small differences in daily routine do not have large associations with GPA.
The results from the permutation-importance analysis supported this conclusion. Study hours were by far the best predictor of stress, with sleep hours being a distant second. These two variables were the most important predictors in both the stress and GPA models.
Connection to Objectives
The hypothesis stated that study hours would show the strongest association with GPA and that higher reported study time and lower reported sleep would be associated with higher stress. The results are consistent with both parts of this hypothesis. Study hours showed the strongest positive correlation with GPA (r = 0.734), and study hours were also the strongest predictor of stress in the classifier (ρ = 0.727; permutation importance Δ accuracy = 0.368 ± 0.021). Reported sleep duration was inversely associated with stress (ρ = −0.313). Because the design is cross-sectional, these results describe associations consistent with the stated objectives rather than causal effects.
Connection to Previous Research
This result is consistent with existing literature on several occasions. For example, a very strong correlation detected in this study between studying time and GPA contrasts with the low and inconsistent effects discovered by other researchers when looking at college students and examining how much study time and study quality affect GPA, which is due to the fact that self-regulation was more important for GPA than the total amount of time spent studying6,7,9. This contrast can be explained by the different way the current dataset records time spent studying within the daily time budget compared with previous research. The low correlation between sleep duration and GPA is consistent with meta-analyses showing that, contrary to sleep quality, sleep duration is generally weakly correlated with academic performance14,16. Moreover, the compositional analysis shows that time allocation is very important for the detected relationships. It is necessary to emphasize that the relationship between stress and GPA is inconsistent with the literature on this issue, in which a high level of perceived stress is associated with low academic achievement22,24. It means that the stress variable used in this dataset combines both engagement and distress. The major contribution of this paper lies in considering several daily activities at once, namely, measuring stress.
Recommendations
To begin with, because study hours have the highest correlation with a student’s GPA and are more predictive of high stress levels, future longitudinal research is required to determine at what point study hours become less useful for improving GPA and trigger an increased stress. To continue, considering the compositional nature of the data, any interventions should focus on redistributing time rather than increasing the amount of a given activity. The next step is to conduct further research into the possibility of redistributing time spent on social media or extracurricular activities in favor of sleep and the stress reduction without lowering GPA. Finally, universities should develop a mechanism to identify students with excessive study hours and insufficient sleep and provide them with appropriate facilities.
Limitations
One limitation is that the dataset relies on self-reported survey answers. Response bias or inaccurate recall could affect variables like self-reported time spent studying, sleeping, or perceived stress level. The study’s cross-sectional dataset also cannot claim any causal effects between lifestyle habits and GPA. The dataset only covers colleges in Delhi, Bangalore, and neighboring cities; this may limit its applicability to students elsewhere.
There are also other missing variables that could affect both stress level and GPA that are not included in the dataset. Eating habits, background, and other factors are not accounted for. Prior achievement ability/aptitude, family educational background, major, or degree-seeking status are all missing; because any of these could also be related to students’ habits and GPA, the associations we report are probably confounded to some degree, and the results should be interpreted with that in mind.
Finally, it should be noted that some of our predictors are highly correlated with each other. Study hours and stress level have a Spearman correlation of ρ = 0.727. This may cause instability of individual regression coefficients. A more serious issue is that the five time-use predictors mathematically sum to 24 hours for every student. This closed or compositional nature of the time-use variables means the full multivariable model is rank-deficient and per-variable coefficients are non-identifiable. As discussed in the Results section, the individual coefficients therefore should be treated as descriptive. The compositional (ILR) reanalysis above is thus the preferred basis for any claim about a single habit.
Also interestingly, the reported hours of sleep are almost uncorrelated with GPA (r = −0.004), which is not in line with previous findings25,26. This could be caused by the compositional constraint (sleep hours are coupled with study time, which has a larger association with GPA), or the lack of variation in self-reported sleep in this sample or possibly sleep has a stronger relationship with perceived stress level (ρ = −0.313) than it does with GPA. Like the other individual coefficients, this should be interpreted cautiously rather than as strong evidence that sleep does not correlate with academic performance. Despite these weaknesses, our analysis does give some insight into students’ daily lives.
Closing Thought
Overall, this research reveals the tension in a student’s life: more study time is associated with higher grades but is also most strongly linked to higher stress. Due to the data being collected at a single point in time, an establishment of causation cannot be made. Nevertheless, the pattern aligns with the idea that steady, balanced routines may support strong performance without the same rise in stress. Longitudinal studies that follow the same students over time would be well suited to test this.
References
- S. Kumar. Student lifestyle dataset. 2024, https://doi.org/10.34740/kaggle/dsv/9876359. [↩] [↩] [↩] [↩] [↩] [↩]
- W. Rau, A. Durand. The academic ethic and college grades: does hard work help students to “make the grade”?. Sociology of Education. Vol. 73, pg. 19, 2000, https://doi.org/10.2307/2673197. [↩]
- B. W. Horton, C. S. Snyder. Wellness: its impact on student grades and implications for business. Journal of Human Resources in Hospitality & Tourism. Vol. 8, pg. 215–233, 2009, https://doi.org/10.1080/15332840802269858. [↩]
- Z. Zhang, L. Wang, Y. Qu. The interplay between positive lifestyle habits and academic excellence in higher education. Humanities and Social Sciences Communications. Vol. 12, 2025, https://doi.org/10.1057/s41599-025-04630-4. [↩]
- M.-M. Dubuc, M. Aubertin-Leheudre, A. D. Karelis. Lifestyle habits predict academic performance in high school students: the adolescent student academic performance longitudinal study (ASAP). International Journal of Environmental Research and Public Health. Vol. 17, pg. 243, 2019, https://doi.org/10.3390/ijerph17010243. [↩]
- R. Plant, K. A. Ericsson, L. Hill, K. Asberg. Why study time does not predict grade point average across college students: implications of deliberate practice for academic performance. Contemporary Educational Psychology. Vol. 30, pg. 96–116, 2005, https://doi.org/10.1016/j.cedpsych.2004.06.001. [↩] [↩]
- S. A. Nonis, G. I. Hudson. Academic performance of college students: influence of time spent studying and working. Journal of Education for Business. Vol. 81, pg. 151–159, 2006, https://doi.org/10.3200/JOEB.81.3.151-159. [↩] [↩]
- S. A. Nonis, G. I. Hudson. Performance of college students: impact of study time and study habits. Journal of Education for Business. Vol. 85, pg. 229–238, 2010, https://doi.org/10.1080/08832320903449550. [↩]
- M. Credé, N. R. Kuncel. Study habits, skills, and attitudes: the third pillar supporting collegiate academic performance. Perspectives on Psychological Science. Vol. 3, pg. 425–453, 2008, https://doi.org/10.1111/j.1745-6924.2008.00089.x. [↩] [↩]
- J. Broadbent, W. L. Poon. Self-regulated learning strategies and academic achievement in online higher education learning environments: a systematic review. The Internet and Higher Education. Vol. 27, pg. 1–13, 2015, https://doi.org/10.1016/j.iheduc.2015.04.007. [↩]
- R. V. Adams, E. Blair. Impact of time management behaviors on undergraduate engineering students’ performance. SAGE Open. Vol. 9, 2019, https://doi.org/10.1177/2158244018824506. [↩]
- M. A. Aljaffer, A. H. Almadani, A. S. AlDughaither, A. A. Basfar, S. M. AlGhadir, Y. A. AlGhamdi, B. N. AlHubaysh, O. A. AlMayouf, S. A. AlGhamdi, T. Ahmad, H. M. Abdulghani. The impact of study habits and personal factors on the academic achievement performances of medical students. BMC Medical Education. Vol. 24, art. 888, 2024, https://doi.org/10.1186/s12909-024-05889-y. [↩] [↩]
- C. Sridi, M. Aribi, L. Lassoued, I. Kacem, F. Chelly, N. Belhadj, A. Fki, N. Elleuch, I. Chouchene, M. Maoua, M. Ben Dhiab. Sociodemographic, lifestyle, and educational environment factors associated with academic performance among Tunisian medical students: a cross-sectional study. BMC Medical Education. Vol. 26, art. 190, 2026, https://doi.org/10.1186/s12909-025-08518-4. [↩] [↩] [↩]
- J. F. Dewald, A. M. Meijer, F. J. Oort, G. A. Kerkhof, S. M. Bögels. The influence of sleep quality, sleep duration and sleepiness on school performance in children and adolescents: a meta-analytic review. Sleep Medicine Reviews. Vol. 14, pg. 179–189, 2010, https://doi.org/10.1016/j.smrv.2009.10.004. [↩] [↩]
- H. A. Seoane, L. Moschetto, F. Orliacq, J. Orliacq, E. Serrano, M. I. Cazenave, D. E. Vigo, S. Perez-Lloret. Sleep disruption in medicine students and its relationship with impaired academic performance: a systematic review and meta-analysis. Sleep Medicine Reviews. Vol. 53, art. 101333, 2020, https://doi.org/10.1016/j.smrv.2020.101333. [↩]
- L. A. Musshafen, R. S. Tyrone, A. Abdelaziz, C. E. Sims-Gomillia, L. S. Pongetti, F. Teng, L. M. Fletcher, J. C. Reneker. Associations between sleep and academic performance in US adolescents: a systematic review and meta-analysis. Sleep Medicine. Vol. 83, pg. 71–82, 2021, https://doi.org/10.1016/j.sleep.2021.04.015. [↩] [↩]
- J. Zhou, Y. Liu, C. Yue, M. Wang, K. Chen, K. P. Rosales. The effect of sleep quality on academic performance: a systematic review and meta-analysis study. Behavioral Sciences. Vol. 16, art. 634, 2026, https://doi.org/10.3390/bs16050634. [↩]
- K. Wunsch, J. Fiedler, P. Bachert, A. Woll. The tridirectional relationship among physical activity, stress, and academic performance in university students: a systematic review and meta-analysis. International Journal of Environmental Research and Public Health. Vol. 18, art. 739, 2021, https://doi.org/10.3390/ijerph18020739. [↩]
- Y. Rosales-Ricardo, V. Cáceres-Manzano. Effects of physical exercise on academic performance in university students: a systematic review. Health Professions Education. Vol. 10, 2024, https://doi.org/10.55890/2452-3011.1174. [↩]
- S. Lumley, P. Ward, L. Roberts, J. P. Mann. Self-reported extracurricular activity, academic success, and quality of life in UK medical students. International Journal of Medical Education. Vol. 6, pg. 111–117, 2015, https://doi.org/10.5116/ijme.55f8.5f04. [↩]
- S. Abdulsalim, M. S. Anaam, M. Farooqui, M. S. Alshammari, S. Alfadly, J. Alolayan, A. A. Aljarallah, S. Alsahali. Evaluation of social media addiction and its relationship with anxiety and academic performance among medical and non-medical students: a cross-sectional study from Saudi Arabia. Healthcare. Vol. 13, art. 295, 2025, https://doi.org/10.3390/healthcare13030295. [↩]
- A. Barbayannis, M. Bandari, X. Zheng, H. Baquerizo, K. W. Pecor, X. Ming. Academic stress and mental well-being in college students: correlations, affected groups, and COVID-19. Frontiers in Psychology. Vol. 13, art. 886344, 2022, https://doi.org/10.3389/fpsyg.2022.886344. [↩] [↩]
- M. D. Bedewy, A. Gabriel. Examining perceptions of academic stress and its sources among university students: the Perception of Academic Stress Scale. Health Psychology Open. Vol. 2, 2015, https://doi.org/10.1177/2055102915596714. [↩]
- M. C. Pascoe, S. E. Hetrick, A. G. Parker. The impact of stress on students in secondary school and higher education. International Journal of Adolescence and Youth. Vol. 25, pg. 104–112, 2020, https://doi.org/10.1080/02673843.2019.1596823. [↩] [↩]
- K. Okano, J. R. Kaczmarzyk, N. Dave, J. D. E. Gabrieli, J. C. Grossman. Sleep quality, duration, and consistency are associated with better academic performance in college students. npj Science of Learning. Vol. 4, art. 16, 2019, https://doi.org/10.1038/s41539-019-0055-z. [↩]
- J. D. Creswell, M. J. Tumminia, S. Price, Y. S. Sefidgar, S. Cohen, Y. Ren, J. Brown, A. K. Dey, J. M. Dutcher, D. K. Villalba, J. Mankoff, X. Xu, K. G. Creswell, A. Doryab, S. M. Mattingly, A. Striegel, D. Hachen, G. J. Martinez, M. C. Lovett. Nightly sleep duration Proceedings of the National Academy of Sciences. Vol. 120, art. e2209123120, 2023, https://doi.org/10.1073/pnas.2209123120. [↩]