

Abstract
This study examined vaccination using an illustrative SEIRV model and an exploratory analysis of COVID-19 indicators in five countries during 2021-2022. Susceptible, exposed, infectious, recovered, and vaccinated populations were tracked by the model, while incorporating imperfect protection, breakthrough infections, waning immunity, and reinfection over 200 days. In the empirical analysis, a total of 474 country-week observations from Bulgaria, Japan, South Korea, the United Kingdom, and the United States were included. For the regressions, vaccination coverage lagged by two weeks, country and calendar-week fixed effects, policy stringency, variant sequence shares, and Driscoll-Kraay standard errors were used. Peak infectious prevalence was reduced from 20.27% to 15.02%, a 25.90% reduction, by increasing the simulated vaccination rate from zero to 0.010 per day. In the primary observational model, each additional 10 percentage points of vaccination coverage were associated with 170.95 more reported cases per million per day (95% CI: 28.84 – 313.06). The corresponding reproduction number coefficient was 0.0046 (95% CI: -0.0367 – 0.0459). Statistical significance was lost in the case association after including country-specific trends. The hypothesized reduction in transmission indicators was not consistently supported by the empirical results. Interpretation was limited by the small country sample, reporting differences, and residual confounding. These findings show conditional epidemic reductions within the simulation without establishing causal vaccination effects from the observational analysis.
Keywords: COVID-19; Vaccination; SEIRV Model; Infectious Disease Modeling; Epidemiology
Introduction
COVID-19 vaccination has been examined through mathematical modeling, clinical research, and population-level observational studies. The global mortality impact of vaccination was estimated by using a mathematical model, providing evidence about modeled deaths averted rather than directly observed changes in transmission1. Associations between BNT162b2 vaccination were examined by studies of Israel’s vaccination program, documenting infection, hospitalization, and death2,3. With these different approaches, complementary evidence was provided, but their outcomes and assumptions need to be distinguished when interpreting vaccination research.
Protection against infection differs with the circulating variant and time since vaccination. In the research conducted in the United Kingdom, how Delta affected vaccine effectiveness against newly detected infections was examined. In addition, a cohort study was conducted in the United States, documenting changes in protection over several months4,5. In addition, studies of transmission among contacts and within households examined why vaccination should not be represented as universally preventing subsequent infection or onward transmission6,7. These findings motivate models that vaccination individuals can be allowed to remain partially susceptible.
Additional challenges were introduced by Omicron for interpreting vaccination coverage. Vaccine effectiveness against symptomatic Omicron infection and the combined roles of previous infection and vaccination were examined by studies8,9. Longer-term booster effectiveness and differences in protection against reinfection before and after Omicron were investigated by subsequent research10,11. Therefore, the current protection of from the percentage of a population completing a primary vaccination series cannot be fully described. The relationship between vaccination coverage and epidemic outcomes may be influenced by dose history, previous infection, waning immunity, and variant circulation.
A structural way is offered by mathematical models to examine vaccination under explicit assumptions. Modeling was used to investigate vaccination priorities by age and serostatus, while examining vaccination alongside non-pharmaceutical interventions12,13. In addition, vaccination, interventions, and the Delta variant were modeled in England14. These studies show that population structure, epidemic timing, and assumptions about other measures affecting transmission need to be considered for vaccination projections.
To examine epidemic trajectories and intervention scenarios, compartmental vaccination models have also been used. An enhanced SEIR model was developed incorporating vaccination, while analyzing vaccination in a COVID-19 compartmental framework15,16. Other modeling studies also incorporated waning immunity and control measures, emphasizing the importance of allowing protection to change over time17,18. Waning protection was represented explicitly by a model of breakthrough infections in Israel, while the importance of distinguishing infectious periods from symptom timing was demonstrated by longitudinal research on infectiousness19,20. Together, these studies examined mechanisms that a simplified vaccination model should either represent or acknowledge as limitations.
Particular care is required for observational comparisons due to vaccination coverage changing alongside epidemic conditions. Vaccination coverage and COVID-19 outcomes were examined in a United States observational study21. First-dose effectiveness against COVID-19 mortality in England was estimated by an age-based regression discontinuity design22. These studies show how interpretation may be influenced by research design. The same identification was not provided as a design using an external eligibility rule by a country-level comparison before and after a coverage threshold.
In this study, an illustrative SEIRV model was combined with an exploratory analysis of Bulgaria, Japan, South Korea, the United Kingdom, and the United States. The contribution of them is transparent comparison between the behavior of an assumption-based epidemic model and associations observed in a small country panel. The simulation was not calibrated to these countries, and causal validation was not provided by the empirical analysis. Instead, both components were used to examine how assumptions, exposure definitions, variant timing, and statistical adjustment influence the conclusions.
This study particularly seeks to answer the research question about how vaccination intensity affects the simulated infectious peak, and how the observed vaccination coverage is associated with reported cases and the estimated reproduction number in the selected countries. This study hypothesizes that the simulated infectious peak will be reduced by higher vaccination intensity and that lower reported cases and a lower reproduction number will be associated with higher lagged vaccination coverage. These predictions distinguish the theoretical and empirical components, allowing their findings to be separately evaluated.
Methods
In this study, two complementary analytical components were used. The simulation differed vaccination assumptions while other conditions fixed within each comparison were held. In the country analysis, vaccination coverage was examined under observed changes in policy, variant circulation, and epidemic conditions. Therefore, a modeled mechanism from an observational association was distinguished by the conceptual framework. Agreement between the two components did not itself establish causality, and differences in assumptions, measurement, or confounding may be reflected by the disagreement.
SEIRV Model
The mathematical modeling of infectious diseases provides a useful framework for understanding how epidemics spread and evaluating the effectiveness of public health interventions. Among various compartmental models, the SIR, SEIR, and SEIRV models have been widely used to describe disease transmission dynamics.
The Susceptible-Infectious-Recovered (SIR) model divides a population into three compartments: susceptible (S), infected (I), and recovered (R). The dynamics of disease transmission are represented by the following system of differential equations:
Where β denotes the transmission rate of the disease and γ denotes the recovery rate. Although the SIR model provides a simple framework for describing epidemic dynamics, it assumes that infected individuals become infectious immediately after infection.
To account for the latent period observed in many infectious diseases, the Susceptible-Exposed-Infectious-Recovered (SEIR) model introduces an exposed (E) compartment between susceptible and infectious individuals. The SEIR model is represented as follows:
where  represents the rate at which exposed individuals become infectious. The SEIR model provides a more realistic representation of diseases such as COVID-19 by incorporating the latent period before infected individuals become infectious.
However, the SEIR model does not explicitly account for vaccination. To evaluate the effect of vaccination on disease transmission, this study employs the Susceptible-Exposed-Infectious-Recovered-Vaccinated (SEIRV) model, which extends the SEIR framework by introducing a vaccinated (V) compartment. The model is expressed as follows:
The population was divided into susceptible (S), exposed but not yet infectious (E), infectious (I), recovered (R), and vaccinated (V) compartments. A proportion  was used to represent recued vaccination susceptibility to infection, allowing breakthrough infections through the term (1-)
 VI. Vaccine-derived protection decreased at rate
 v that individuals returned from V to S. Infection-derived immunity decreased at rate
 that recovered individuals returned to the susceptible compartment and permitting reinfection. Limitations of models that assumed permanent protection after vaccination were addressed by aforementioned mechanisms17,18.
In the model, homogeneous mixing, constant parameters with each simulation, and identical infectiousness and recovery rates for breakthrough and other infections were retained. The proportion currently in the model’s partially protected state was represented by the vaccinated compartment, rather than cumulative vaccination coverage. After returning to the susceptible compartment, individuals could be vaccinated again. Age, vaccine product, dose number, and hybrid immunity were not modeled separately.
The basic reproduction number ( ) is the expected number of secondary infections generated by one infectious individual in a fully susceptible population. This number was used as
 for the model without vaccination. The baseline transmission coefficient of = 0.30 per day and recovery rate of
 = 0.10 per day. Therefore, it gave = 3. An illustrative baseline scenario was defined by this value. This value was not estimated from the country data or intended to show a particular country, epidemic period, or SARS-CoV-2 variant.
Simulation Design
To examine the effect of vaccination, a SEIRV model was simulated for 200 days. The initial population consisted of 99.0% susceptible, 0.5% exposed, and 0.5% infected individuals. No one was initially recovered or vaccinated. The total population was normalized to one so that all compartments represented population proportions rather than absolute numbers.
Baseline protection against susceptibility was set to η = 0.60 as an illustrative intermediate scenario rather than a pooled clinical estimate. Mean durations of vaccine-derived and recovered immunity were set to 180 and 270 days, respectively, by following a published modeling specification18. Due to the nature of vaccine protection varying over time with breakthrough occurring, lower and higher protection assumptions were examined19.
The baseline transmission coefficient was β = 0.30 per day, the exposed-to-infectious progression rate was σ = 0.20 per day, and the recovery rate was γ = 0.10 per day. These values indicate mean latent and infectious periods of five and ten days, respectively. They were retained from the original simulation to permit comparison between model structures without being fitted to a particular country or variant. In a fully susceptible population without vaccination, the corresponding basic reproduction number is  . The latent period is the interval from infection to infectiousness, while the incubation period is the interval from infection to symptom onset. Research on infectious viral shedding supports distinguishing symptom timing from infectiousness20. The baseline parameter values and sensitivity ranges are summarized in the Supplementary Table S1.
| Parameter | Baseline | Values examined |
| Transmission coefficient, β | 0.30/day | 0.20, 0.30, 0.40/day |
| Mean latent period, 1/σ | 5 days | 2, 3.5, 5 days |
| Mean infectious period, 1/γ | 10 days | 3, 5, 10 days |
| Susceptibility reduction, η | 0.60 | 0.20, 0.60, 0.90 |
| Mean vaccine-protection duration, 1/ωV | 180 days | 90, 180, 365 days |
| Mean recovered-immunity duration, 1/ωR | 270 days | 90, 180, 270 days |
| Vaccination rate, ν | Four scenarios | 0, 0.002, 0.005, 0.010/day |
The sensitivity values show deliberately broad scenario assumptions. To examine alternatives to the original baseline, shorter latent and infectious periods were included as informed by published modeling and infectiousness studies19,20. The parameter grid is not a confidence region. Therefore, its endpoints should not be interpreted as universally applicable biological estimates.
To present increasing vaccination intensity, vaccination rates of 0, 0.002, 0.005, and 0.010 per day were used. The vaccination flow was vS(t). Therefore, the susceptible population remaining at each time mattered for the number entering the vaccinated compartment. These rates were hypothetical without being calibrated to the rollout of any particular country. How vaccination assumptions changed epidemic trajectories was examined by the simulation, while associations involving observed population vaccination coverage were examined by the empirical analysis.
Data
This study uses COVID-19 data from Our World in Data (OWID), which includes data from the World Health Organization (WHO) and national public health organizations. The OWID database provides information on COVID-19 cases, vaccination progress, government response measures, and epidemiological indicators, making it suitable for cross-country comparative analysis.
To compare differences in vaccination coverage, government interventions, and reported epidemic patterns, the United Kingdom, United States, Japan, South Korea, and Bulgaria were deliberately chosen. An exploratory comparison was supported by this selection rather than a globally representative sample. Selecting countries with contrasting experiences may introduce selection bias and limits generalization.
The sample period covers January 2021 to December 2022. January 2021 marked the beginning of large-scale COVID-19 vaccination campaigns in most countries, allowing the analysis to capture the effects of vaccination on disease transmission. The dataset ends in December 2022 because many countries revised their COVID-19 testing and case reporting systems during 2023.
All five countries contributed to the continuous-coverage analysis. In the primary sample, there were a total of 474 country-weeks. Among them, 95 for Bulgaria, 90 for the United Kingdom, 92 for Japan, 94 for South Korea, and 103 for the United States. The differing contributions indicated vaccination-data availability and analytical eligibility.
Only the United Kingdom, United States, Japan, and South Korea were included in the threshold comparisons since 50% primary-series coverage was not met by Bulgaria during the study period. The four ±90-day descriptive windows had a total of 724 daily observations. Among them, there were 90 pre-threshold days and 91 post-threshold days per country. Therefore, only countries that attained the specified coverage level were relevant to threshold results.
Two outcomes were analyzed separately: reported new COVID-19 cases per million people and the estimated effective reproduction number. The principal explanatory variable was primary-series vaccination coverage that was expressed as the number of people fully vaccinated per 100 population. Coverage was continuously analyzed and lagged by two weeks. Stringency Index and the proportions of sequenced samples classified as Delta or Omicron were additional explanatory variables. People fully vaccinated per hundred measures the proportion of the population that completed the primary vaccination series in each country. The reproduction rate (R) represents the average number of secondary infections from an infected individual and reflects the intensity of disease transmission. The Stringency Index is a composite indicator ranging from 0 to 100 that summarizes the strictness of government containment policies, including school closures, workplace closures, travel restrictions, and restrictions on public gatherings. Vaccination rate refers to the model parameter v, vaccination coverage refers to the observed population percentage completing the initial vaccination protocol, and vaccination threshold refers to a specified coverage percentage used in the descriptive comparisons. These quantities are conceptually related but are not interchangeable. Together, these variables were used to examine how vaccination, transmission intensity, and government interventions influenced COVID-19 case trends across countries.
The analysis used the archived Our World in Data COVID-19 dataset for Bulgaria, Japan, South Korea, the United Kingdom, and the United States from January 1, 2021, through December 31, 2022. A total of 3,650 country-day records were extracted in the dataset. People_fully_vaccinated_per_hundred, which recorded completion of the initial vaccination protocol rather than booster coverage, was used to measure primary-series vaccination coverage. Mathieu and colleagues described the construction of the OWID vaccination database23.
Stringency_index was used to measure government responses. Nine policy indicators were combined by this index on a scale from 0 to 100, with higher values showing stricter recorded containment policies. Individual compliance or the effectiveness of those policies was not measured directly24.
New_cases_per_million and reproduction_rate were two outcomes. The archived case series was supplied through the WHO COVID-19 reporting system, representing reported cases rather than all infections. To reduce the influence of daily reporting batches, weekly means were used. The reproduction-number series comprised of model-based estimates associated with the Tracking R framework that used a Kalman-filter approach. Since it was not a directly observed outcome, it should not be treated as independent confirmation patterns in reported cases.
Missing vaccination observations were carried forward within countries for a maximum of 14 days. Before the first available observation, values were not filled. Then, coverage was measured at the end of each week and lagged by two weeks. The primary models only included complete calendar weeks with the required outcomes, exposure, policy, and usable variant information. The analysis used archived OWID data from owid-covid-data.csv and CoVariant sequence counts from perCountryData.json. For each country and 14-day CoVariants reporting period, Delta and Omicron shares were calculated by dividing each variant’s sequence count by the total sequence count. These shares were assigned to dates within each period and averaged by week. Periods with fewer than 20 sequences were treated as missing, while excluding weeks without seven day of usable variant information.
For descriptive summaries only, country-day observations were classified as low coverage when the initial vaccination protocol was completed by fewer than 30 people per 100 population, medium coverage when it was completed from 30 to below 60 people, and high coverage when it was completed by 60 or more people. These categories were presentation choices rather than biological thresholds. Continuous vaccination coverage was used in the primary regressions.
Regression Model
The empirical analysis proceeds in two stages. First, descriptive analyses are conducted using summary statistics and graphical comparisons before and after each country reached 50% full vaccination coverage. These analyses provide an overview of how COVID-19 cases, vaccination coverage, and government response measures changed around the vaccination threshold.
Continuous vaccination coverage was used in the primary analysis to have the findings not depend on a single threshold. The 50% threshold was not interpreted as a biological herd-immunity threshold but was retained as a descriptive reference point. 40% and 60% thresholds were used in the additional analyses. In these analyses, complete calendar weeks within ±90-day window in each country were included, while excluding weeks containing both pre-threshold and post-threshold days.
| Vaccination threshold | N | Reported cases per million Coefficient (95% CI) | Reproduction number Coefficient (95% CI) |
| 40% | 96 | 73.60 (−30.75, 177.95) | −0.031 (−0.381, 0.318) |
| 50% | 97 | 50.95 (−110.47, 212.37) | −0.334 (−0.743, 0.075) |
| 60% | 96 | 5.45 (−84.92, 95.81) | −0.138 (−0.400, 0.124) |
Second, associations between continuous vaccination coverage lagged by two weeks and each outcome were examined by weekly panel regressions, adjusting for country and calendar-week fixed effects, policy, stringency, and Delta and Omicron sequence shares.
Where,  shows either mean daily reported cases per million or the mean estimated reproduction number for country i in week w. The term
 shows a primary-series vaccination coverage two weeks earlier and is measured as a percentage of the population. b is the association corresponding to a ten-percentage-point increase when dividing the coverage. A ten-percentage-point increase corresponds to the dividing coverage by ten.
 indicates mean policy stringency, while
 and
 represent Delta and Omicron sequence shares expressed from zero to one.
 shows the country fixed effects,
 shows calendar-week fixed effects, and
 shows unexplained variation.
Daily observations were aggregated into complete Monday-Sunday calendar weeks. Weekly means were used to represent outcomes and the Stringency Index, while the latest eligible observation available by the end of each week was used to measure vaccination coverage. In both outcome models, country and calendar-week fixed effect were included. Driscoll-Kraay standard errors with a four-week bandwidth were used to explain serial correlation and dependence across countries. Two- and eight-week bandwidths were used in the sensitivity analyses, while adding country-specific linear trends.
Ordinary least squares were used to estimate models through explicit fixed-effect indicators. For Driscoll-Kraay covariance estimates, calendar-week sums of regression scores were used, along with Bartlett weights, and the finite-sample multiplier  where k included the fixed-effect coefficients. A t-distribution was used for approximately 95% confidence interval with the number of observed calendar weeks minus one degree of freedom. In the primary models, a total of 103 calendar weeks were included. Therefore, 102 degrees of freedom were used for interval estimation.
The empirical analysis was observational and descriptive. Selected sources of confounding were addressed by country and calendar-week fixed effects, but causal identification was not established. Therefore, regression coefficients represent conditional associations rather than causal effects of vaccination or government policy.
Results
Simulation Results
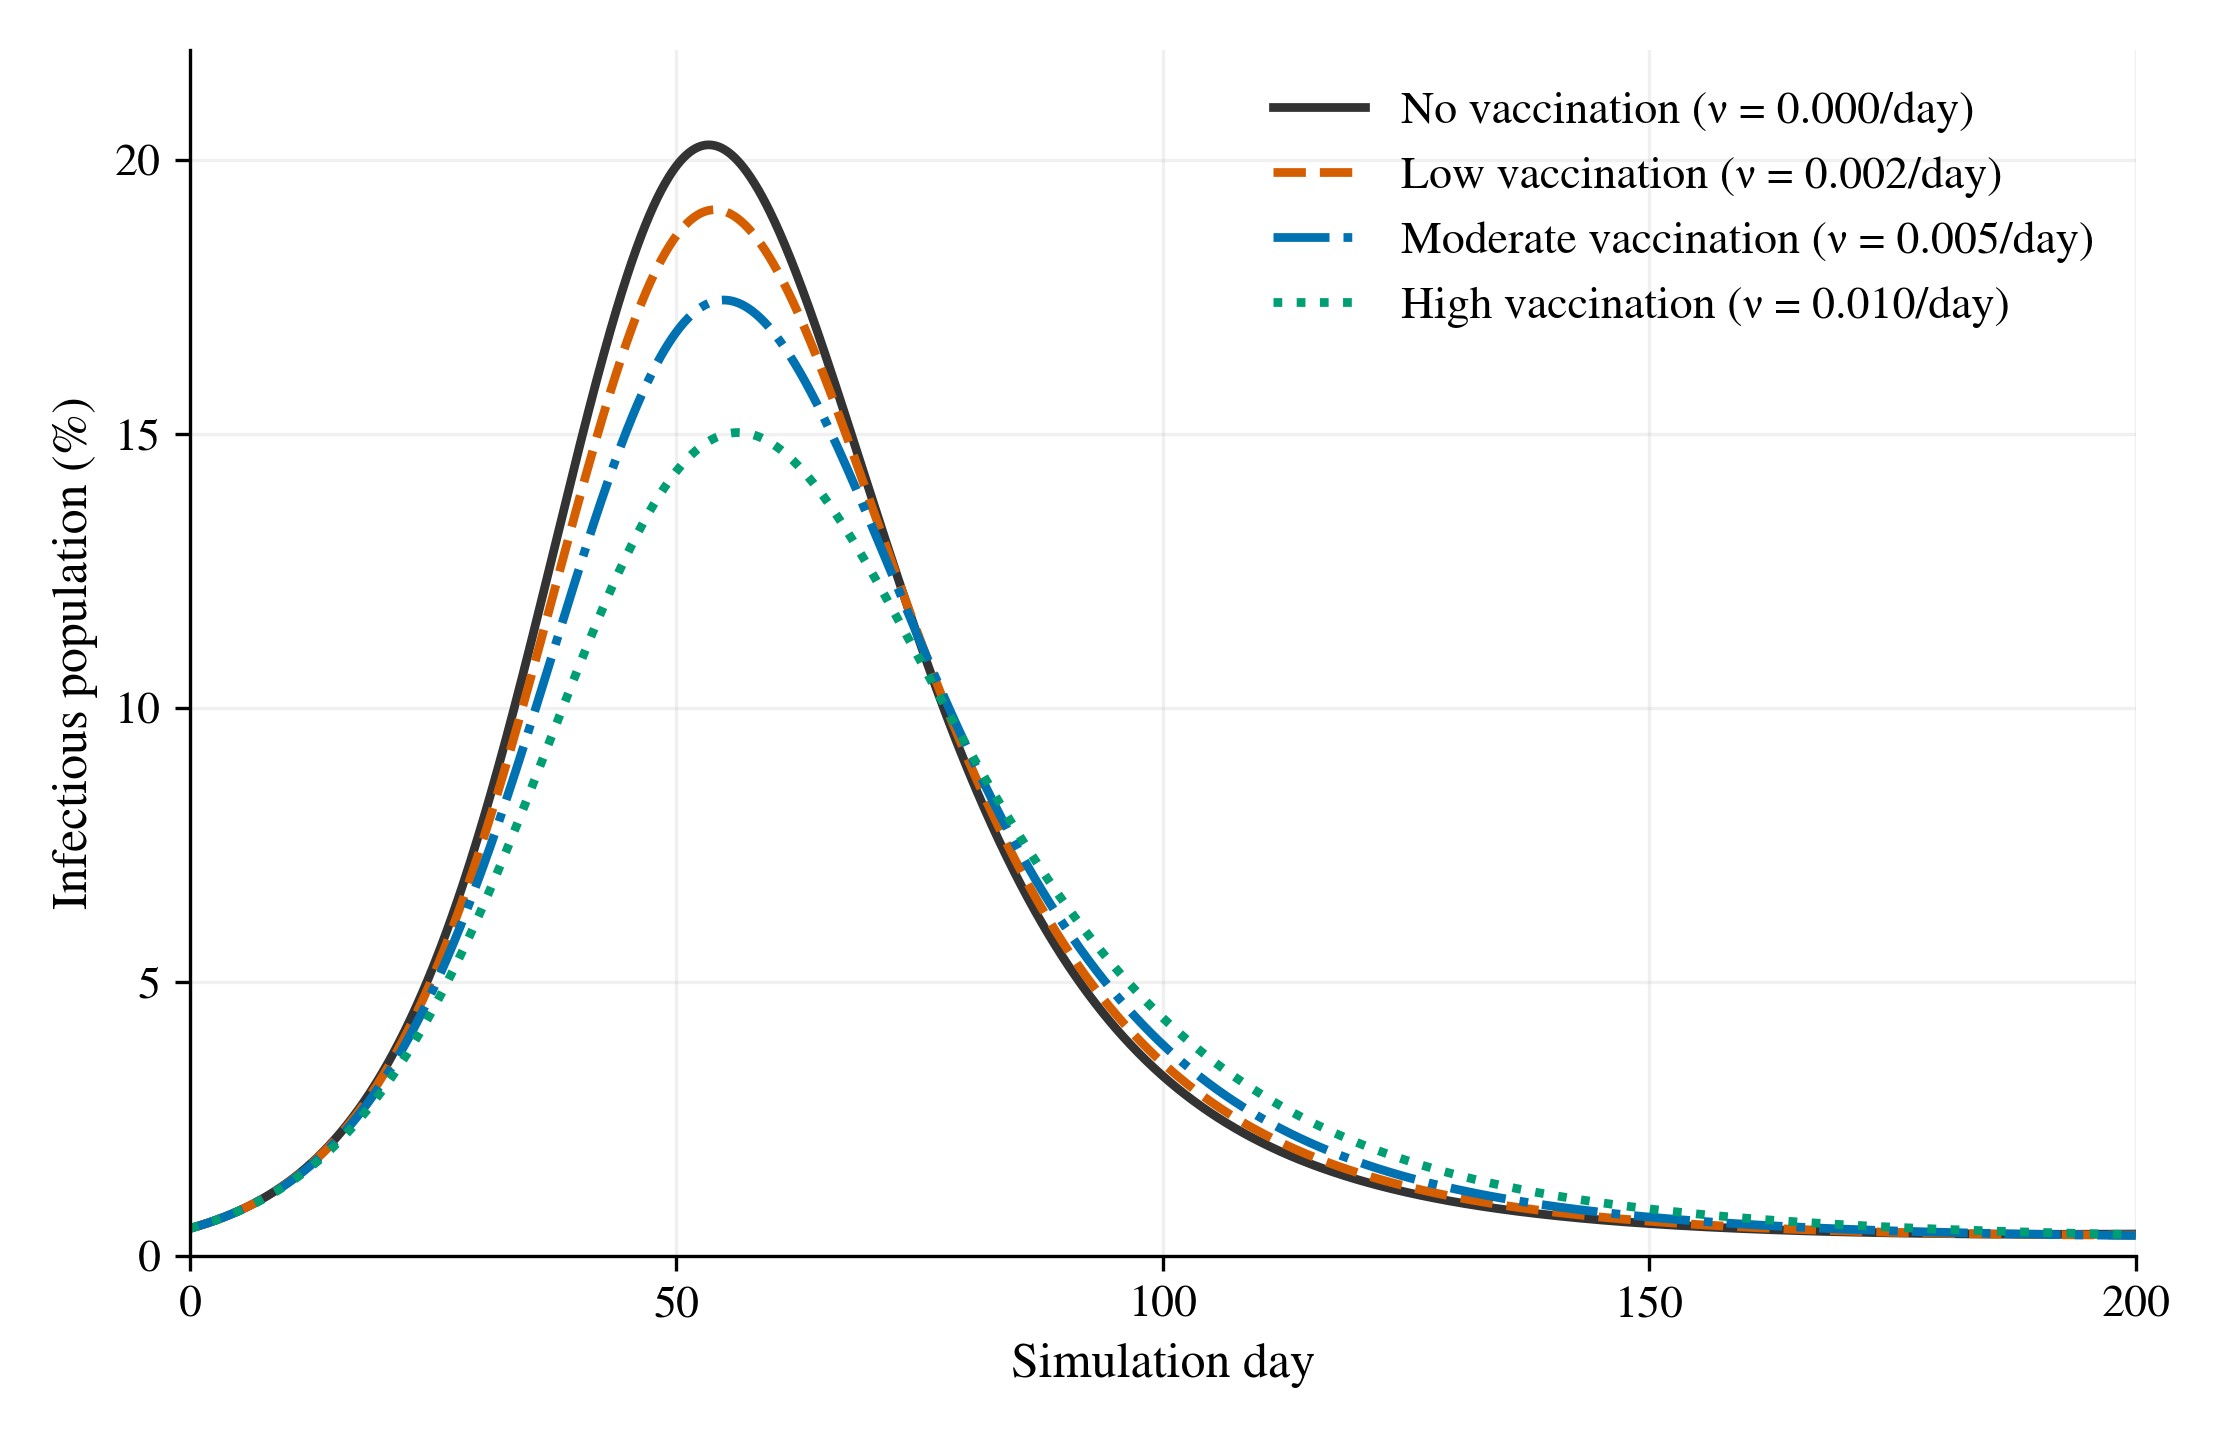
In figure 1, the simulated proportion of infectious individuals over 200 days under four vaccination scenarios are shown. The same epidemiological parameters were used in all scenarios, including partial vaccine protection, breakthrough infections, waning immunity, and reinfection. During the initial epidemic wave, infectious prevalence increased, followed by the peaks within approximately two months, and subsequently decline thereafter.
Peak infectious prevalence was 20.27% without vaccination, followed by 19.09% under low vaccination, 17.44% under moderate vaccination, and 15.02% under high vaccination. These values represented peak reductions of 5.84%, 13.97%, and 25.90%, respectively, relative to the no-vaccination scenario. Therefore, the peak infectious proportion was reduced by higher vaccination intensity under the specified baseline assumptions.
Under no, low, moderate, and high vaccination, the peak occurred on days 53.32, 53.94, 54.85, and 56.33. High vaccination delayed the peak by 3.01 days compared with no vaccination. Conditional behavior within an illustrative model was described by these findings. Therefore, it should not be interpreted as estimate of vaccine effectiveness in the study countries.
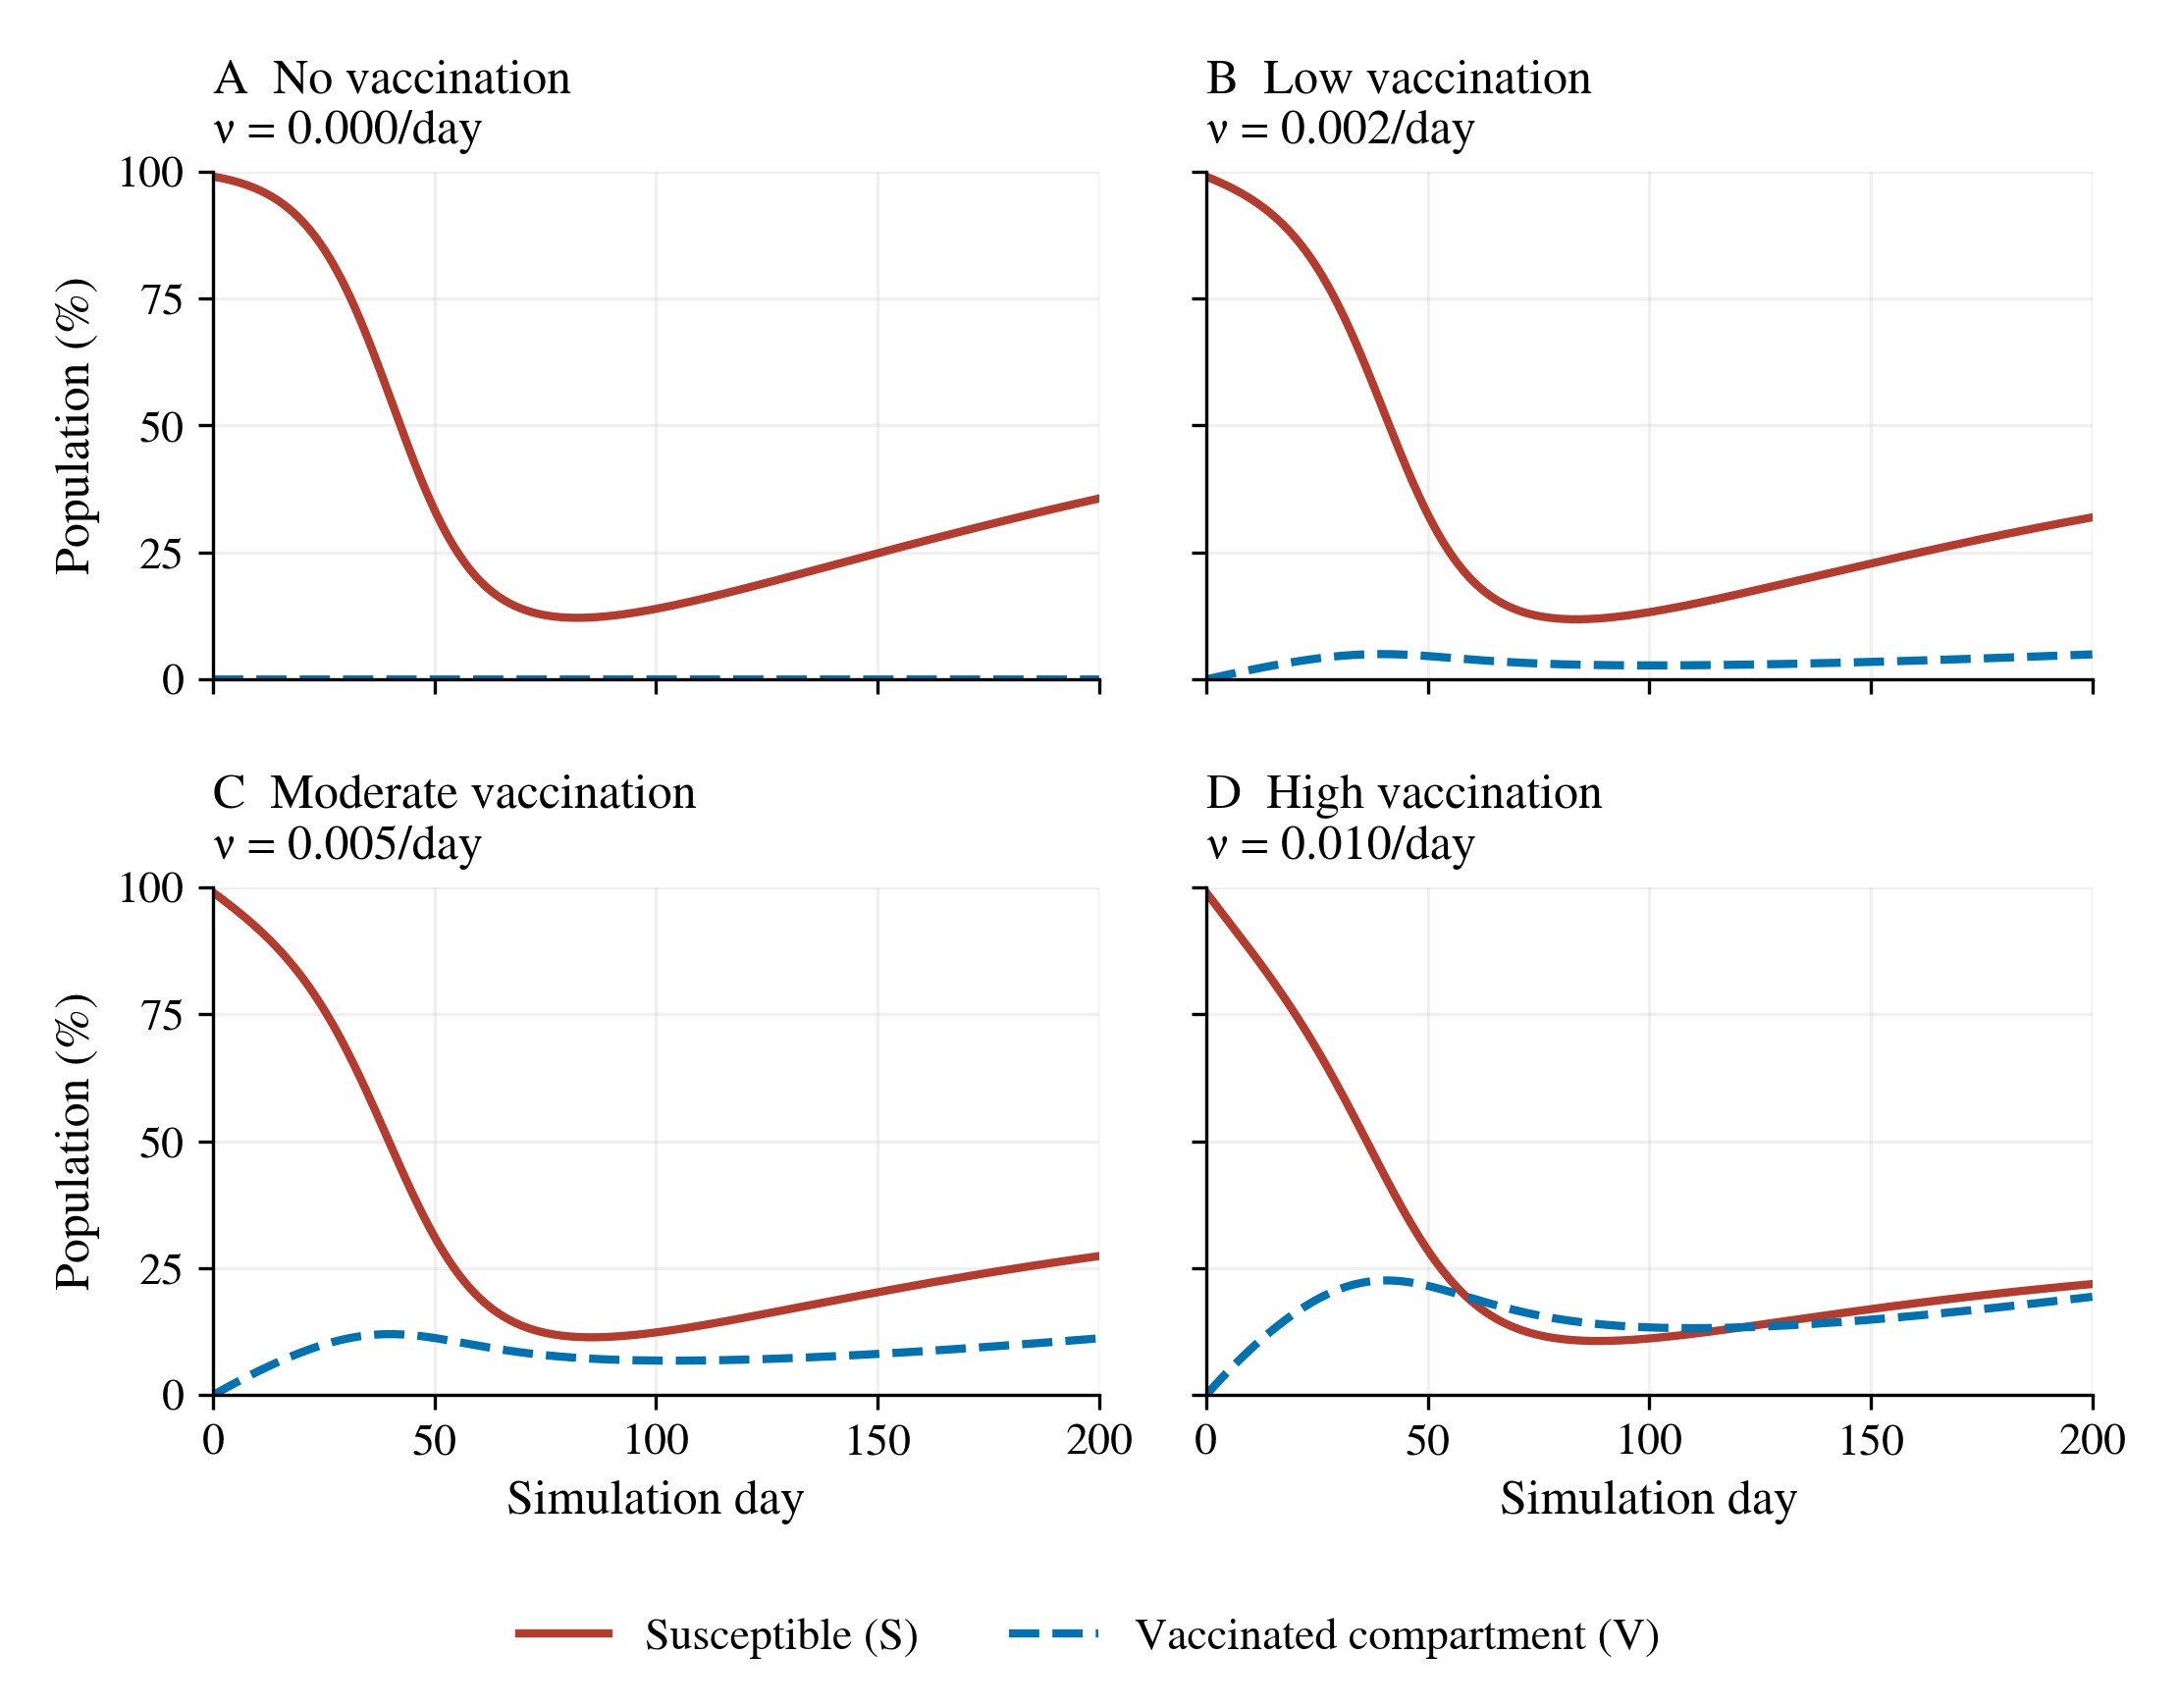
In Figure 2, changes in the susceptible and vaccinated compartments over 200 days under four vaccination scenarios are shown. Susceptible individuals are represented by the solid red lines, while individuals in the vaccinated compartment are represented by the dashed blue lines. Across all scenarios, the susceptible proportion initially decreased during the epidemic and gradually increased as waning immunity returned individuals to the susceptible compartment. There may be an increase or a decrease in the vaccinated proportion as compartment membership is jointly determined by vaccination, breakthrough infections, and waning protection.
At day 200, 0.00%, 4.94%, 11.19%, and 19.37% of the population under no, low, moderate, and high vaccination were represented in the vaccinated compartment, respectively. The corresponding susceptible proportions reported 35.62%, 31.91%, 27.39%, and 21.88%. Therefore, a larger vaccinated compartment was associated with higher vaccination intensity first, followed by a smaller susceptible compartment at the end of the simulation. With these compartment proportions, current model states were described. They should not be interpreted as cumulative primary-series vaccination coverage.
| Vaccination scenario | Vaccination rate, ν (per day) | Peak infectious population | Peak reduction | Peak day |
| None | 0.000 | 20.27% | 0.00% | 53.32 |
| Low | 0.002 | 19.09% | 5.84% | 53.94 |
| Moderate | 0.005 | 17.44% | 13.97% | 54.85 |
| High | 0.010 | 15.02% | 25.90% | 56.33 |
Under the baseline assumptions, the peak infectious proportion reported 0.202694 without vaccination. This peak was reduced to 0.190853, 0.174382, and 0.150204, respectively, in the low-, moderate-, and high-vaccination scenarios. The peak occurred between days 53.32 and 56.33. These results are not about estimates of vaccine effectiveness in the study countries but indicate hypothetical model scenarios.
A sensitivity analysis evaluated three values for each of six parameters: transmission coefficient, latent period, infectious period, susceptibility reduction following vaccination, vaccine-protection duration, and recovered-immunity duration. A total of 729 parameter combinations were produced. With four vaccination rates, each combination was simulated, generating 2,916 runs. The highest reductions were calculated against the no-vaccination simulation by applying the same remaining parameter values (Table 2).
| Vaccination scenario | Vaccination rate, ν (per day) | Minimum peak reduction (%) | Median peak reduction (%) | Maximum peak reduction (%) |
| No vaccination | 0.000 | 0.00 | 0.00 | 0.00 |
| Low | 0.002 | 0.00 | 3.59 | 33.21 |
| Moderate | 0.005 | 0.00 | 8.40 | 56.10 |
| High | 0.010 | 0.00 | 15.34 | 72.35 |
Higher vaccination rates reduced or remained unchanged with the maximum infectious population relative to the matched no-vaccination scenario across the specified parameter grid. Peak reductions were in a range from 0.00% to 72.35%, with a median of 15.34%, under high vaccination. Variation across selected deterministic scenarios was described by these values rather than statistical confidence intervals. They also indicated that the magnitude of the modeled benefit was influenced by the epidemiological and protection assumptions.
For the baseline simulations, an adaptive Runge-Kutta solver was used with relative tolerance of  , absolute tolerance of
 , and a 0.01-day grid for identifying peaks. Fourth-order Runge-Kutta integration was used with a 0.10-day step. Selected sensitivity simulations were checked against the adaptive solver. Around 1.74 x
 was calculated as the maximum checked differences in peak infectious proportion. Both population conservation and compartment non-negativity were also checked.
Empirical Results
Table 3 summarizes a total of 3,293 country-day observations, including 929 in the low vaccination group, 646 in the medium group, and 1,718 in the high group. For those three groups, the mean full vaccination coverage reported 10.338%, 41.542%, and 75.827%, respectively. The highest mean reported cases per million was 680.675 in the high vaccination group, compared with 191.247 in the low group and 137.929 in the medium group. According to reported cases, the greatest variability was shown in the high group, with a standard deviation of 3,132.519, compared with 833.107 and 532.046 in the low and medium groups.
Mean estimated reproduction numbers were also close to one across the three groups. It reported 1.014 in the low group, 1.018 in the medium group, and 1.050 in the high group. Mean Stringency Index values were 54.845, 37.049, and 32.163, respectively. This indicated that observations with high vaccination coverage corresponded with lower average policy stringency. These groups had observations from different countries and calendar periods. Therefore, vaccination effects cannot be established by their unadjusted differences. Hereupon, continuous vaccination coverage was examined by the subsequent regression analyses, while explaining country differences, calendar time, policy stringency, and variant sequence shares.
| Group | Variable | N | Mean | SD | Min. | Max. |
| Low <30% | New cases per million | 929 | 191.247 | 833.107 | 0.000 | 9058.340 |
| Low <30% | Reproduction number | 929 | 1.014 | 0.221 | 0.610 | 1.690 |
| Low <30% | Fully vaccinated (%) | 929 | 10.338 | 9.921 | 0.000 | 29.990 |
| Low <30% | Stringency Index | 929 | 54.845 | 13.086 | 23.150 | 87.96 |
| Medium 30–<60% | New cases per million | 646 | 137.929 | 532.046 | 0.000 | 4741.530 |
| Medium 30–<60% | Reproduction number | 646 | 1.018 | 0.244 | 0.420 | 1.840 |
| Medium 30–<60% | Fully vaccinated (%) | 646 | 41.542 | 10.888 | 30.030 | 59.990 |
| Medium 30–<60% | Stringency Index | 646 | 37.049 | 19.547 | 11.110 | 62.500 |
| High ≥60% | New cases per million | 1718 | 680.675 | 3132.519 | 0.000 | 52456.860 |
| High ≥60% | Reproduction number | 1718 | 1.050 | 0.321 | 0.420 | 4.080 |
| High ≥60% | Fully vaccinated (%) | 1718 | 75.827 | 7.849 | 60.040 | 85.600 |
| High ≥60% | Stringency Index | 1718 | 32.163 | 13.373 | 5.560 | 54.860 |
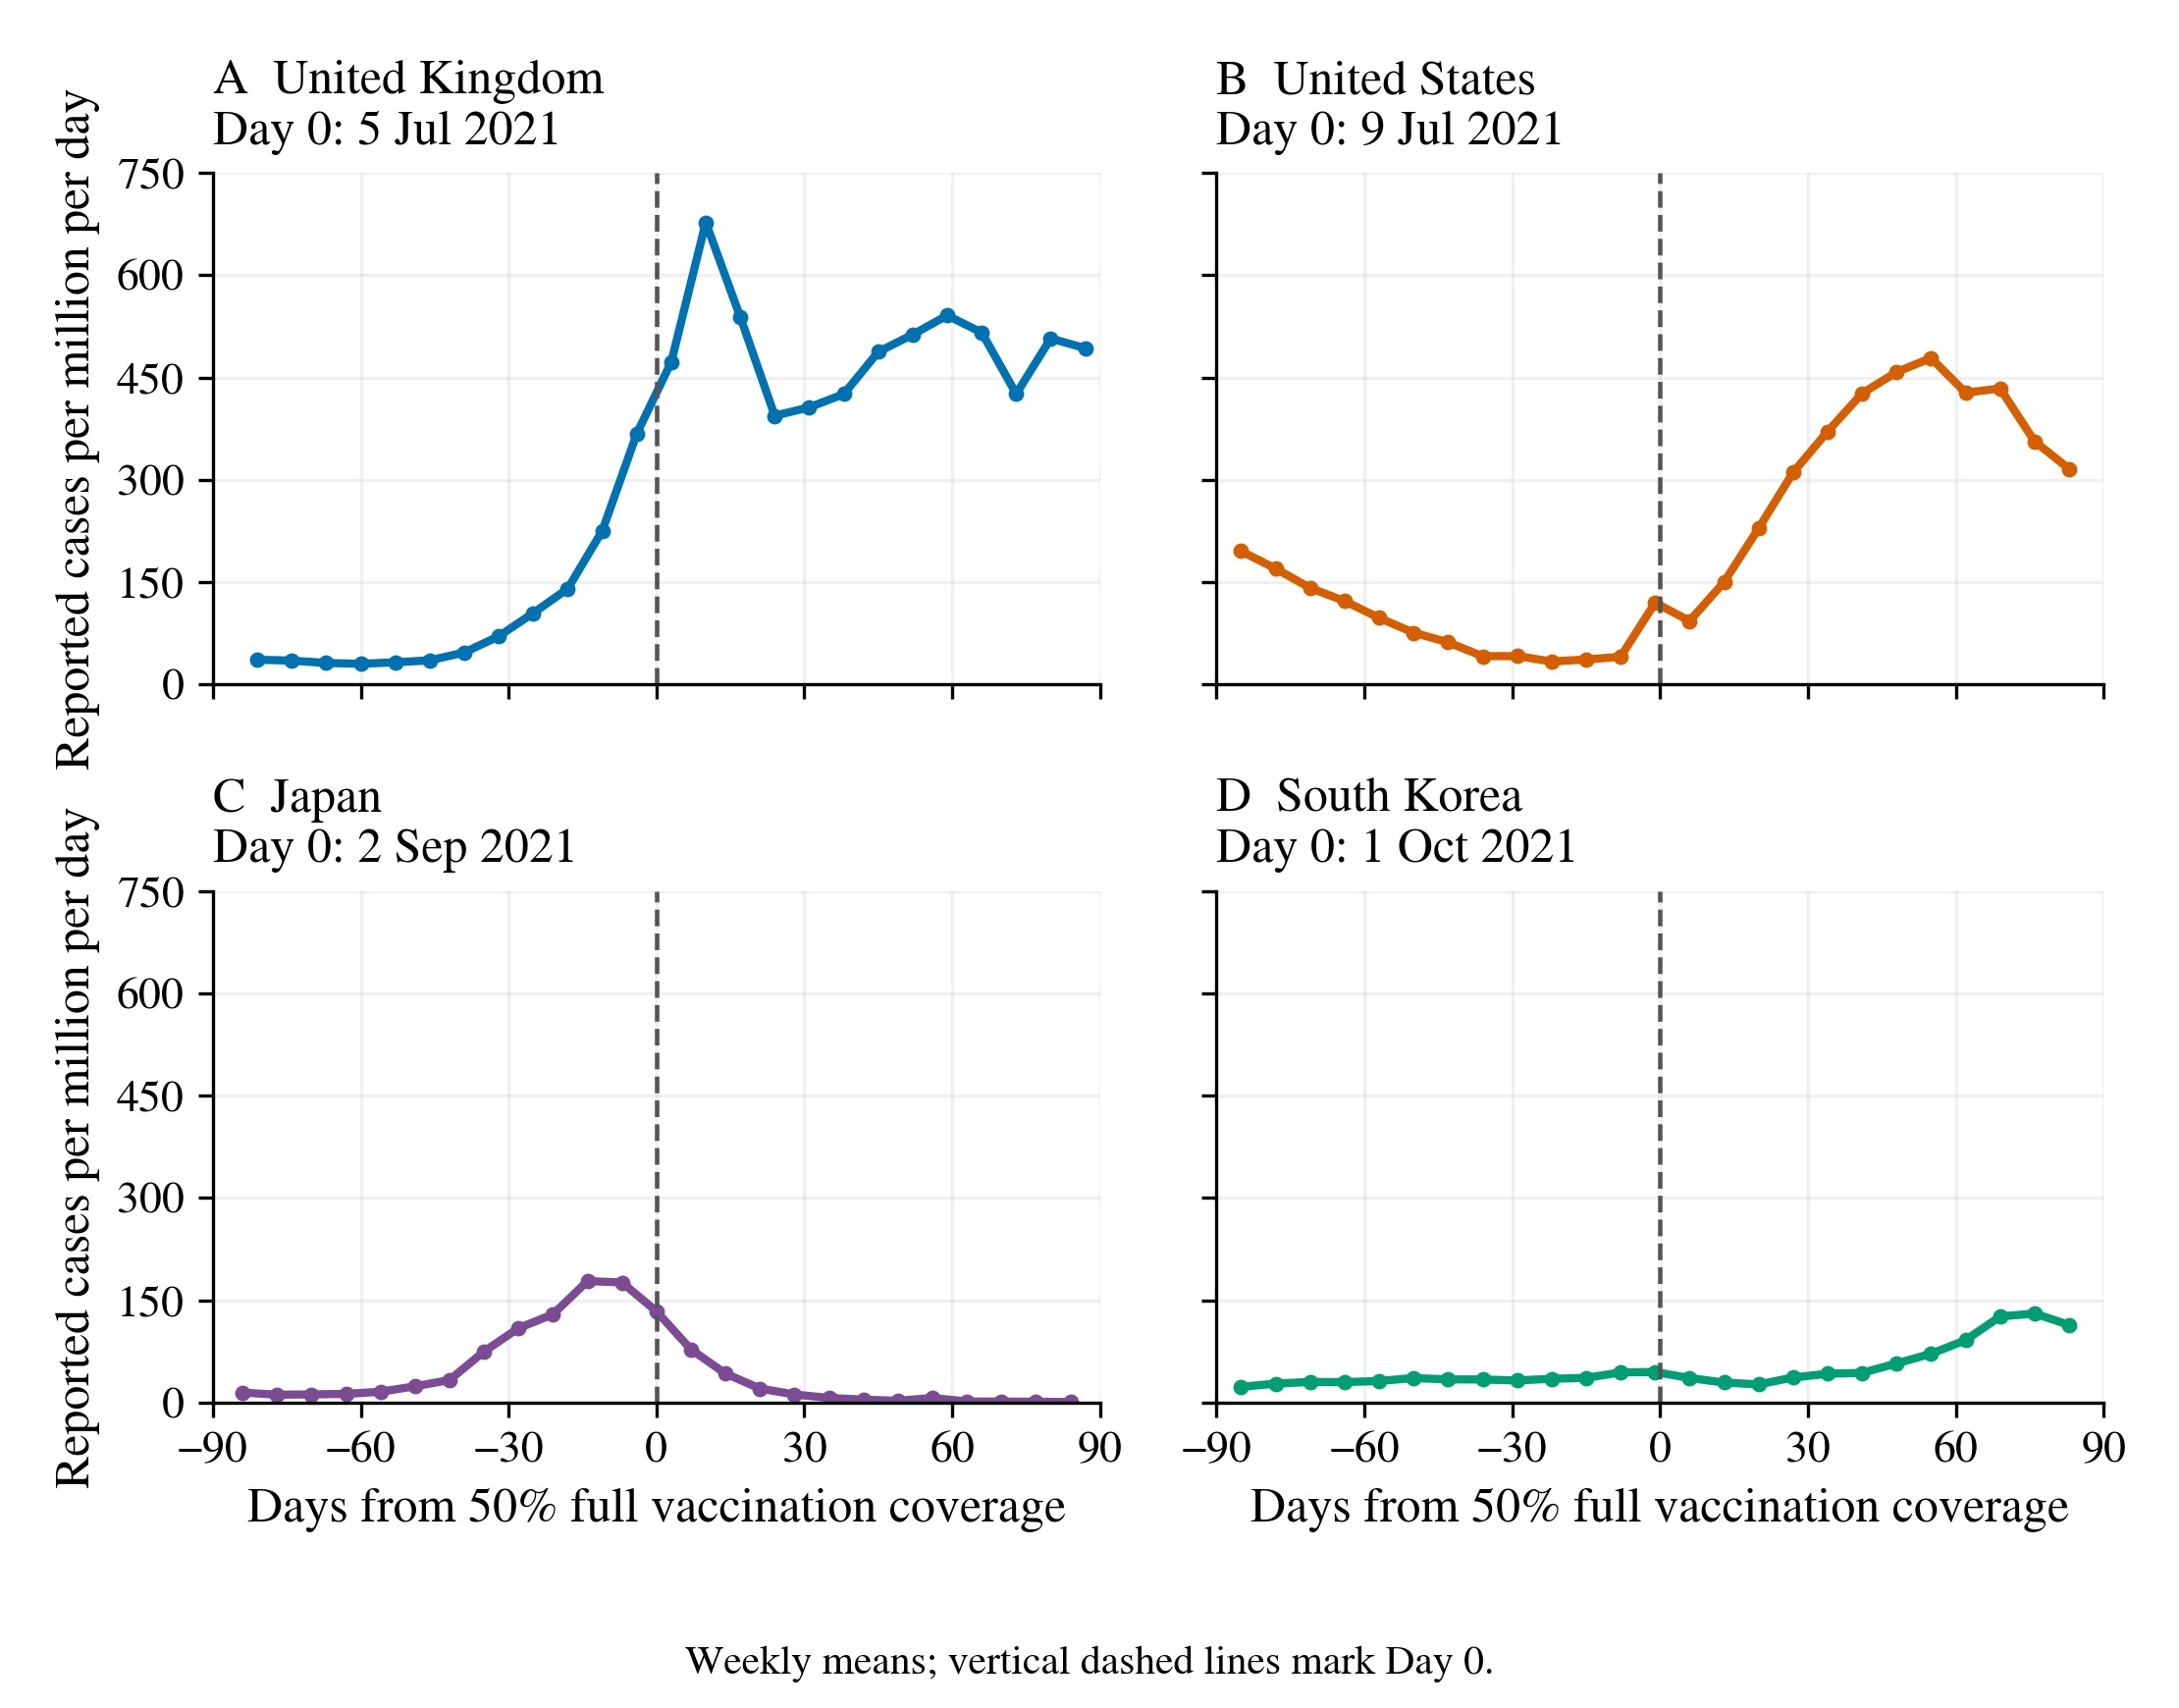
In Figure 3, unadjusted weekly mean reported cases around the first observed date of 50% full vaccination coverage was represented in each country. A pronounced increase around the threshold was observed in the United Kingdom, while there was an increase during the post-threshold period following an earlier decline in the United States. An increase in the cases was reported in Japan before the threshold, followed by subsequent decline. A later increase toward the end of its post-threshold window was shown in South Korea. These patterns indicate variation across countries and calendar periods.
Mean reported cases per million increased from 93.30 to 492.17 in the United Kingdom, from 97.17 to 320.85 in the United States, and from 31.75 to 65.39 in South Korea for the full daily comparison windows, comprising 90 days before and 91 days from the threshold onward. The mean decreased from 63.10 to 23.98 in Japan. These daily average are reported in Supplementary Table S3. They are distinct from the weekly means plotted in Figure 3. With these comparisons, changes coinciding with threshold attainment were described without establishing the causality of vaccination with observed increases or decreases.
| Country | Period | Mean daily reported cases per million | Mean estimated reproduction number |
| United Kingdom | Before | 93.30 | 1.148 |
| United Kingdom | After | 492.17 | 1.049 |
| United States | Before | 97.17 | 0.901 |
| United States | After | 320.85 | 1.173 |
| Japan | Before | 63.10 | 1.149 |
| Japan | After | 23.98 | 0.618 |
| South Korea | Before | 31.75 | 1.103 |
| South Korea | After | 65.39 | 1.068 |
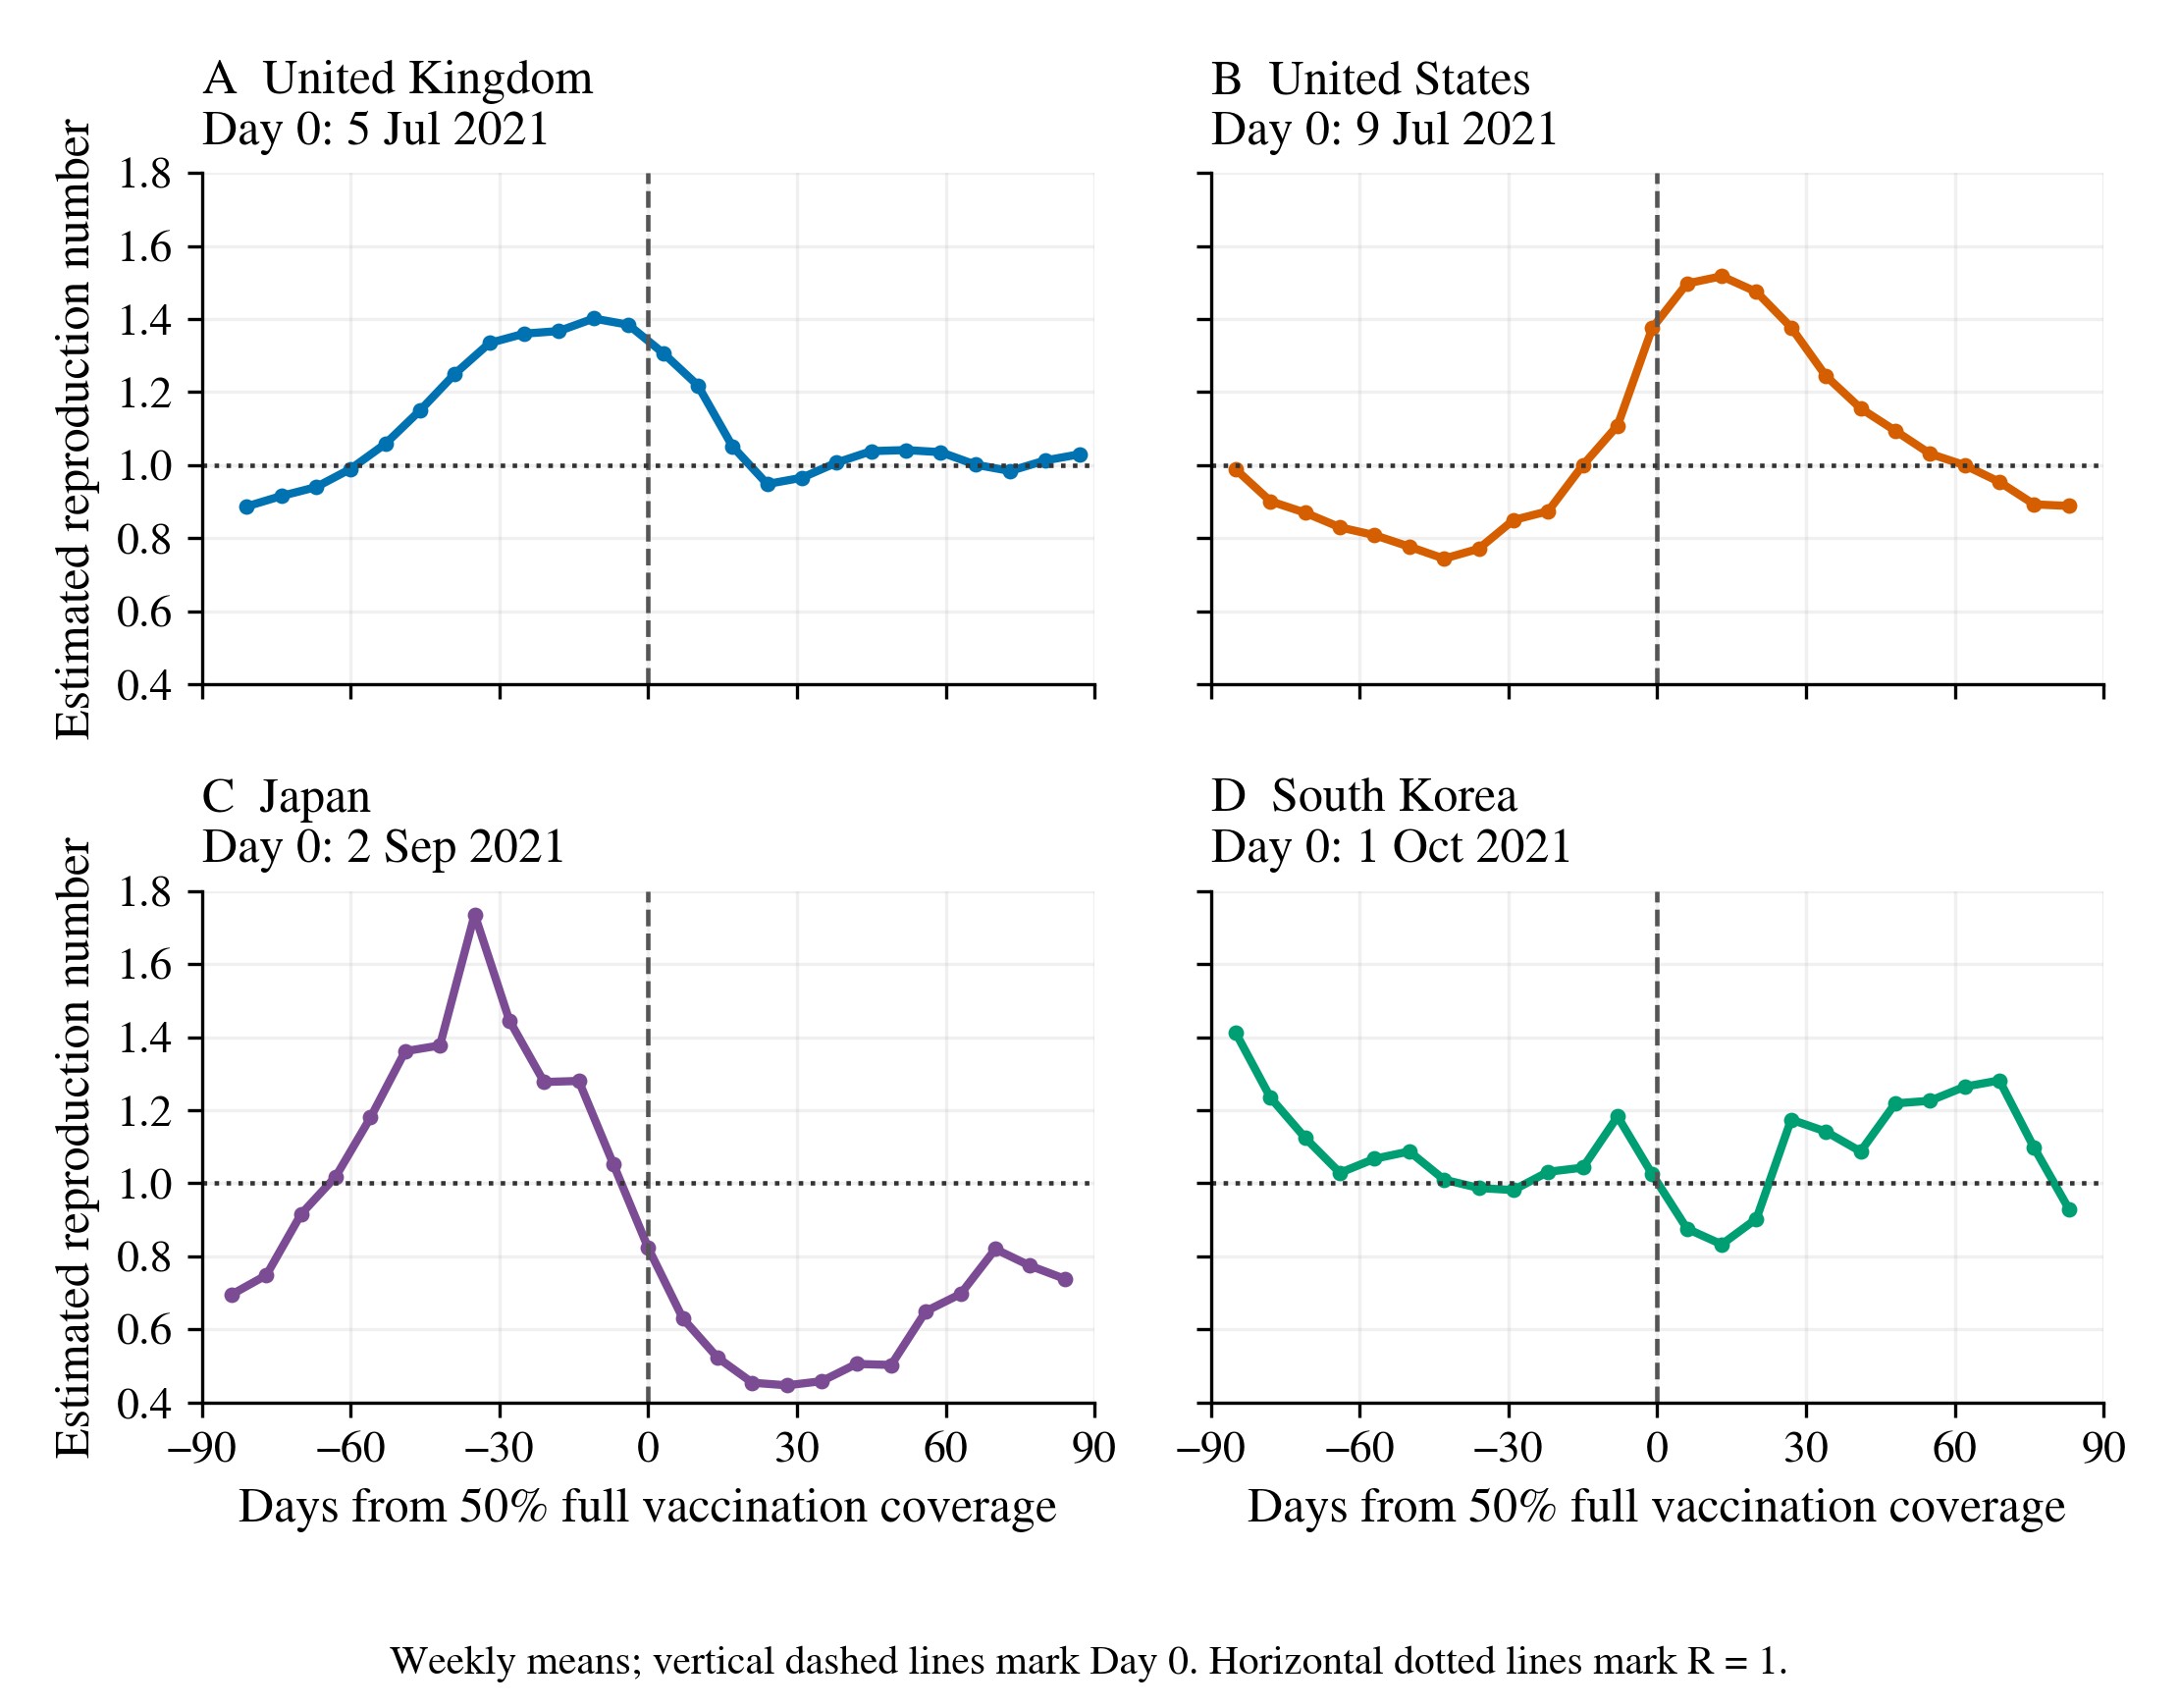
Figure 4 indicates the estimated reproduction number around each country’s 50% vaccination threshold. In the United Kingdom, the mean reproduction number decreased from 1.148 to 1.049. In Japan, it decreased from 1.149 to 0.618. In South Korea, it decreased from 1.103 to 1.068. In the United States, however; it increased from 0.901 to 1.173. Mean reported cases increased in the United Kingdom and South Korea despite their lower mean reproduction numbers. The corresponding daily reported cases in before-and-after comparisons and estimated reproduction numbers are summarized in Supplementary Table S3.
In the primary model, a ten-percentage-point increase in vaccination coverage two weeks earlier was associated with 170.95 additional mean daily reported cases per million people (95% CI, 28.84 to 313.06) (Table 4). The corresponding association with the reproduction number was 0.0046 (95% CI, -0.0367 to 0.0459) that no clear evidence of an association was provided (Table 5). Conditional relationships in the selected country panel were described by aforementioned coefficients, while individual vaccine effectiveness was not estimated.
| Predictor | Coefficient | Standard error | 95% confidence interval | p |
| Full vaccination coverage (per 10 percentage points, lagged 2 weeks) | 170.95 | 71.65 | 28.84 to 313.06 | 0.019 |
| Stringency Index (per 1 point) | 17.78 | 9.88 | −1.81 to 37.38 | 0.075 |
| Delta sequence share (0–1 scale) | −604.63 | 381.74 | −1361.81 to 152.56 | 0.116 |
| Omicron sequence share (0–1 scale) | 2740.95 | 573.84 | 1602.73 to 3879.16 | <0.001 |
| Predictor | Coefficient | Standard error | 95% confidence interval | p |
| Full vaccination coverage (per 10 percentage points, lagged 2 weeks) | 0.0046 | 0.0208 | −0.0367 to 0.0459 | 0.825 |
| Stringency Index (per 1 point) | −0.0048 | 0.0025 | −0.0098 to 0.0001 | 0.057 |
| Delta sequence share (0–1 scale) | 0.7104 | 0.1698 | 0.3735 to 1.0472 | <0.001 |
| Omicron sequence share (0–1 scale) | 1.5289 | 0.2503 | 1.0324 to 2.0254 | <0.001 |
The case association was sensitive to additional temporal adjustment. The coefficient decreased to 90.55 after including country-specific linear trends, with a confidence interval spanning zero (-193.19 to 374.28). An interval also spanned zero after excluding South Korea (-18.92 to 129.95). The reproduction-number association remained uncertain across these specifications.
Discussion
According to the simulation, the maximum infectious population was reduced by increasing vaccination intensity under the specified assumptions. A high-vaccination peak reduction of 25.90% in the baseline scenario was produced by allowing breakthrough infections and waning immunity. Based on the broader sensitivity analysis, substantial variation was shown in this reduction. This demonstrated that assumptions about transmission, infectiousness, and protection influenced numerical conclusions.
Corresponding evidence of a negative association between vaccination coverage and the reproduction number was not provided by the empirical findings. The primary coverage coefficient for the reproduction number was almost zero or uncertain. The positive association with reported cases was no longer statistically significant after country-specific trends were added. The reproduction-number association was already non-significant in the primary model. Therefore, the empirical hypothesis was not supported by the analysis.
In addition, a direct test of individual vaccine effectiveness was not provided by these results. Different outcomes, populations, and identification strategies, including protection against documented infection and severe disease were examined by clinical and population studies. This study instead describes aggregate associations across five countries during changing epidemic conditions. They were designed to contribute to distinguish model-dependent vaccination scenarios from the more limited conclusions supported by a small observational country panel.
The vaccination-threshold comparisons were made under different variant and policy conditions. In the reconstructed OWID dataset, the United Kingdom and the United States reached 50% full vaccination coverage first on July 5 and July 9, 2021, respectively. On October 3 and 7, 2021, their 90-day post-threshold windows ended. Across these windows, the mean daily assigned Delta sequence shares reported 99.80% and 97.64%, respectively. However, Omicron shares were almost negligible or zero. Therefore, the observed increases in reported cases in these countries to Omicron were not supported by the aforementioned results. The regression included variant sequence shares and calendar-week fixed effects. However, the associations may still be confounded by unmeasured changes in testing, behavior, and prior infection.
Different aspects of epidemic activity were described by reported cases and the estimated reproduction number. Reported cases measure the number of detected infections. However, the reproduction number estimates the average number of secondary infections generated by an infected individual under prevailing conditions25. Therefore, a decreasing reproduction number may occur with increasing cases, especially when it remains above one. In the United Kingdom and South Korea, there was a decrease in the mean reproduction numbers. However, it remained above one, while mean reported cases increased. This pattern was not universal. In Japan, both indicators decreased. However, they increased in the United States. Therefore, these descriptive comparisons should be distinguished from the adjusted weekly regressions as a statistically significant association between vaccination coverage and the reproduction number was not identified. A causal vaccination effect was not established by any analysis.
Several limitations restrict interpretation of the findings in this study. Five countries were included in the analysis, but global generalization is not supported by their selection. Calendar-week fixed effects explained common temporal changes. However, they could not remove country-specific changes in testing, reporting, behavior, mobility, prior infection, booster uptake, or the age distribution of infections. Recorded policies were measured by the Stringency Index, and variant proportions were derived from sequenced samples that may not represent all infections. Vaccine products or time since vaccination were not distinguished by vaccination coverage. Sample composition was also affected by missing vaccination observations and the restriction to complete analytical weeks. Because of these limitations, regression coefficients could not be interpreted as individual vaccination effectiveness or causal population effects.
Conclusion
In this study, an illustrative SEIRV simulation was combined with an exploratory analysis of vaccine coverage and COVID-19 indicators in five countries. In the model, breakthrough infection, waning protection, and reinfection were incorporated. Under its baseline assumptions, the peak infectious population was reduced by high vaccination by 25.90% in spite of the magnitude varied substantially across parameter combinations. In the empirical analysis, the estimated reproduction number was not clearly associated with vaccination coverage. A positive association with reported cases was sensitive to additional temporal adjustment. Therefore, different levels of inference were supported by the simulation and empirical components. Behavior under specified assumptions was demonstrated by the simulation, and the country analysis demonstrated associations that remained vulnerable to confounding. A universal vaccination threshold was not established by any component for epidemic control.
References
- O. J. Watson, G. Barnsley, J. Toor, A. B. Hogan, P. Winskill, A. C. Ghani. Global impact of the first year of COVID-19 vaccination: a mathematical modelling study. The Lancet Infectious Diseases 22, 1293–1302 (2022). DOI: 10.1016/S1473-3099(22)00320-6. [↩]
- N. Dagan, N. Barda, E. Kepten, O. Miron, S. Perchik, M. A. Katz, M. A. Hernán, M. Lipsitch, B. Reis, R. D. Balicer. BNT162b2 mRNA Covid-19 vaccine in a nationwide mass vaccination setting. New England Journal of Medicine 384, 1412–1423 (2021). DOI: 10.1056/NEJMoa2101765. [↩]
- E. J. Haas, F. J. Angulo, J. M. McLaughlin, E. Anis, S. R. Singer, F. Khan, N. Brooks, M. Smaja, G. Mircus, K. Pan, J. Southern, D. L. Swerdlow, L. Jodar, Y. Levy, S. Alroy-Preis. Impact and effectiveness of mRNA BNT162b2 vaccine against SARS-CoV-2 infections and COVID-19 cases, hospitalisations, and deaths following a nationwide vaccination campaign in Israel: an observational study using national surveillance data. The Lancet 397, 1819–1829 (2021). DOI: 10.1016/S0140-6736(21)00947-8. [↩]
- K. B. Pouwels, E. Pritchard, P. C. Matthews, N. Stoesser, D. W. Eyre, K.-D. Vihta, T. House, J. Hay, J. I. Bell, J. N. Newton, J. Farrar, D. Crook, D. Cook, E. Rourke, R. Studley, T. E. A. Peto, I. Diamond, A. S. Walker. Effect of Delta variant on viral burden and vaccine effectiveness against new SARS-CoV-2 infections in the UK. Nature Medicine 27, 2127–2135 (2021). DOI: 10.1038/s41591-021-01548-7. [↩]
- S. Y. Tartof, J. M. Slezak, H. Fischer, V. Hong, B. K. Ackerson, O. N. Ranasinghe, T. B. Frankland, O. A. Ogun, J. M. Zamparo, S. Gray, S. R. Valluri, K. Pan, F. J. Angulo, L. Jodar, J. M. McLaughlin. Effectiveness of mRNA BNT162b2 COVID-19 vaccine up to 6 months in a large integrated health system in the USA: a retrospective cohort study. The Lancet 398, 1407–1416 (2021). DOI: 10.1016/S0140-6736(21)02183-8. [↩]
- D. W. Eyre, D. Taylor, M. Purver, D. Chapman, T. Fowler, K. B. Pouwels, A. S. Walker, T. E. A. Peto. Effect of Covid-19 vaccination on transmission of Alpha and Delta variants. New England Journal of Medicine 386, 744–756 (2022). DOI: 10.1056/NEJMoa2116597. [↩]
- A. Singanayagam, S. Hakki, J. Dunning, K. J. Madon, M. A. Crone, A. Koycheva, N. Derqui-Fernandez, J. L. Barnett, M. G. Whitfield, R. Varro, A. Charlett, R. Kundu, J. Fenn, J. Cutajar, V. Quinn, E. Conibear, W. Barclay, P. S. Freemont, G. P. Taylor, S. Ahmad, M. Zambon, N. M. Ferguson, A. Lalvani, ATACCC Study Investigators. Community transmission and viral load kinetics of the SARS-CoV-2 delta (B.1.617.2) variant in vaccinated and unvaccinated individuals in the UK: a prospective, longitudinal, cohort study. The Lancet Infectious Diseases 22, 183–195 (2022). DOI: 10.1016/S1473-3099(21)00648-4. [↩]
- N. Andrews, J. Stowe, F. Kirsebom, S. Toffa, T. Rickeard, E. Gallagher, C. Gower, M. Kall, N. Groves, A.-M. O’Connell, D. Simons, P. B. Blomquist, A. Zaidi, S. Nash, N. Iwani Binti Abdul Aziz, S. Thelwall, G. Dabrera, R. Myers, G. Amirthalingam, S. Gharbia, J. C. Barrett, R. Elson, S. N. Ladhani, N. Ferguson, M. Zambon, C. N. J. Campbell, K. Brown, S. Hopkins, M. Chand, M. Ramsay, J. Lopez Bernal. Covid-19 vaccine effectiveness against the Omicron (B.1.1.529) variant. New England Journal of Medicine 386, 1532–1546 (2022). DOI: 10.1056/NEJMoa2119451. [↩]
- H. N. Altarawneh, H. Chemaitelly, H. H. Ayoub, P. Tang, M. R. Hasan, H. M. Yassine, H. A. Al-Khatib, M. K. Smatti, P. Coyle, Z. Al-Kanaani, E. Al-Kuwari, A. Jeremijenko, A. H. Kaleeckal, A. N. Latif, R. M. Shaik, H. F. Abdul-Rahim, G. K. Nasrallah, M. G. Al-Kuwari, A. A. Butt, H. E. Al-Romaihi, M. H. Al-Thani, A. Al-Khal, R. Bertollini, L. J. Abu-Raddad. Effects of previous infection and vaccination on symptomatic Omicron infections. New England Journal of Medicine 387, 21–34 (2022). DOI: 10.1056/NEJMoa2203965. [↩]
- H. Chemaitelly, H. H. Ayoub, P. Tang, P. Coyle, H. M. Yassine, A. A. Al Thani, H. A. Al-Khatib, M. R. Hasan, Z. Al-Kanaani, E. Al-Kuwari, A. Jeremijenko, A. H. Kaleeckal, A. N. Latif, R. M. Shaik, H. F. Abdul-Rahim, G. K. Nasrallah, M. G. Al-Kuwari, A. A. Butt, H. E. Al-Romaihi, M. H. Al-Thani, A. Al-Khal, R. Bertollini, J. S. Faust, L. J. Abu-Raddad. Long-term COVID-19 booster effectiveness by infection history and clinical vulnerability and immune imprinting: a retrospective population-based cohort study. The Lancet Infectious Diseases 23, 816–827 (2023). DOI: 10.1016/S1473-3099(23)00058-0. [↩]
- H. Chemaitelly, H. H. Ayoub, P. Coyle, P. Tang, M. R. Hasan, H. M. Yassine, A. A. Al Thani, Z. Al-Kanaani, E. Al-Kuwari, A. Jeremijenko, A. H. Kaleeckal, A. N. Latif, R. M. Shaik, H. F. Abdul-Rahim, G. K. Nasrallah, M. G. Al-Kuwari, A. A. Butt, H. E. Al-Romaihi, M. H. Al-Thani, A. Al-Khal, R. Bertollini, L. J. Abu-Raddad. Differential protection against SARS-CoV-2 reinfection pre- and post-Omicron. Nature 639, 1024–1031 (2025). DOI: 10.1038/s41586-024-08511-9. [↩]
- K. M. Bubar, K. Reinholt, S. M. Kissler, M. Lipsitch, S. Cobey, Y. H. Grad, D. B. Larremore. Model-informed COVID-19 vaccine prioritization strategies by age and serostatus. Science 371, 916–921 (2021). DOI: 10.1126/science.abe6959. [↩]
- S. Moore, E. M. Hill, M. J. Tildesley, L. Dyson, M. J. Keeling. Vaccination and non-pharmaceutical interventions for COVID-19: a mathematical modelling study. The Lancet Infectious Diseases 21, 793–802 (2021). DOI: 10.1016/S1473-3099(21)00143-2. [↩]
- R. Sonabend, L. K. Whittles, N. Imai, P. N. Perez-Guzman, E. S. Knock, T. Rawson, K. A. M. Gaythorpe, B. A. Djaafara, W. Hinsley, R. G. FitzJohn, J. A. Lees, D. T. Kanapram, E. M. Volz, A. C. Ghani, N. M. Ferguson, M. Baguelin, A. Cori. Non-pharmaceutical interventions, vaccination, and the SARS-CoV-2 delta variant in England: a mathematical modelling study. The Lancet 398, 1825–1835 (2021). DOI: 10.1016/S0140-6736(21)02276-5. [↩]
- R. C. Poonia, A. K. J. Saudagar, A. Altameem, M. Alkhathami, M. B. Khan, M. H. A. Hasanat. An enhanced SEIR model for prediction of COVID-19 with vaccination effect. Life 12, article 647 (2022). DOI: 10.3390/life12050647. [↩]
- E. P. Esteban, L. Almodovar-Abreu. Assessing the impact of vaccination in a COVID-19 compartmental model. Informatics in Medicine Unlocked 27, article 100795 (2021). DOI: 10.1016/j.imu.2021.100795. [↩]
- S. K. Ghosh, S. Ghosh. A mathematical model for COVID-19 considering waning immunity, vaccination and control measures. Scientific Reports 13, article 3610 (2023). DOI: 10.1038/s41598-023-30800-y. [↩] [↩]
- A. B. Gumel, E. A. Iboi, C. N. Ngonghala, G. A. Ngwa. Toward achieving a vaccine-derived herd immunity threshold for COVID-19 in the U.S. Frontiers in Public Health 9, article 709369 (2021). DOI: 10.3389/fpubh.2021.709369. [↩] [↩] [↩]
- A. Feng, U. Obolski, L. Stone, D. He. Modelling COVID-19 vaccine breakthrough infections in highly vaccinated Israel—the effects of waning immunity and third vaccination dose. PLOS Global Public Health 2, article e0001211 (2022). DOI: 10.1371/journal.pgph.0001211. [↩] [↩] [↩]
- S. Hakki, J. Zhou, J. Jonnerby, A. Singanayagam, J. L. Barnett, K. J. Madon, A. Koycheva, C. Kelly, H. Houston, S. Nevin, J. Fenn, R. Kundu, M. A. Crone, T. D. Pillay, S. Ahmad, N. Derqui-Fernandez, E. Conibear, P. S. Freemont, G. P. Taylor, N. Ferguson, M. Zambon, W. S. Barclay, J. Dunning, A. Lalvani, ATACCC study investigators. Onset and window of SARS-CoV-2 infectiousness and temporal correlation with symptom onset: a prospective, longitudinal, community cohort study. The Lancet Respiratory Medicine 10, 1061–1073 (2022). DOI: 10.1016/S2213-2600(22)00226-0. [↩] [↩] [↩]
- A. B. Suthar, J. Wang, V. Seffren, R. E. Wiegand, S. Griffing, E. Zell. Public health impact of covid-19 vaccines in the US: observational study. BMJ 377, article e069317 (2022). DOI: 10.1136/bmj-2021-069317. [↩]
- C. Bermingham, J. Morgan, D. Ayoubkhani, M. Glickman, N. Islam, A. Sheikh, J. Sterne, A. S. Walker, V. Nafilyan. Estimating the effectiveness of first dose of COVID-19 vaccine against mortality in England: a quasi-experimental study. American Journal of Epidemiology 192, 267–275 (2023). DOI: 10.1093/aje/kwac157. [↩]
- E. Mathieu, H. Ritchie, E. Ortiz-Ospina, M. Roser, J. Hasell, C. Appel, C. Giattino, L. Rodés-Guirao. A global database of COVID-19 vaccinations. Nature Human Behaviour 5, 947–953 (2021). DOI: 10.1038/s41562-021-01122-8. [↩]
- T. Hale, N. Angrist, R. Goldszmidt, B. Kira, A. Petherick, T. Phillips, S. Webster, E. Cameron-Blake, L. Hallas, S. Majumdar, H. Tatlow. A global panel database of pandemic policies (Oxford COVID-19 Government Response Tracker). Nature Human Behaviour 5, 529–538 (2021). DOI: 10.1038/s41562-021-01079-8. [↩]
- F. Arroyo-Marioli, F. Bullano, S. Kucinskas, C. Rondón-Moreno. Tracking R of COVID-19: a new real-time estimation using the Kalman filter. PLOS ONE 16, article e0244474 (2021). DOI: 10.1371/journal.pone.0244474. [↩]