

Abstract
Facial expression recognition (FER) systems are increasingly proposed for monitoring older adults (69 to 80 years in this study), yet their accuracy for this group is rarely measured. This study asked how large the age gap is for five released FER models, how it compares with human raters and a geometry-only classifier, and whether refitting each model’s final layer closes it. Five released checkpoints were evaluated without retraining: POSTER++ and Quadruplet Cross Similarity (QCS), each trained on RAF-DB and AffectNet-7, and Navigating Label Ambiguity (NLA) trained on RAF-DB. They were tested on FACES: 2,052 posed photographs of 171 young, middle-aged and older adults. Analyses used participant-level bootstrap intervals, permutation tests and Holm correction, with controls for architecture, training dataset, image quality, cropping and expression intensity. Every model was less accurate on older adults, by 11.7 to 15.2 percentage points; human raters lost 8.6 points and the geometry-only classifier 8.3. AffectNet-7 models misread most older adults’ neutral faces, mainly as sad or angry, while RAF-DB models lost fear, disgust and anger. The gap persisted under every control. Refitting only the final layer on older adults’ FACES photographs reduced the gap on held-out participants to about 4 points or less, partly through adaptation to FACES rather than to age. Released FER models read older adults’ posed expressions less accurately, and how they fail depends on training data. Systems for older users should be evaluated by age before deployment; whether final-layer refitting works beyond FACES is untested.
Keywords: Facial Expression Recognition, Machine Learning, Open-Source Models, Datasets, Aging, Algorithmic Bias
Introduction
About 1.1 billion people worldwide are aged 60 or older. This number is projected to reach 2.1 billion by 20501. Many of them face health conditions that require regular monitoring: around 15% of adults aged 70 and older live with a mental disorder, such as anxiety or depression1. Automated facial expression recognition (FER) is being studied as a way to detect early signs of low mood and cognitive decline in older adults2,3,4.
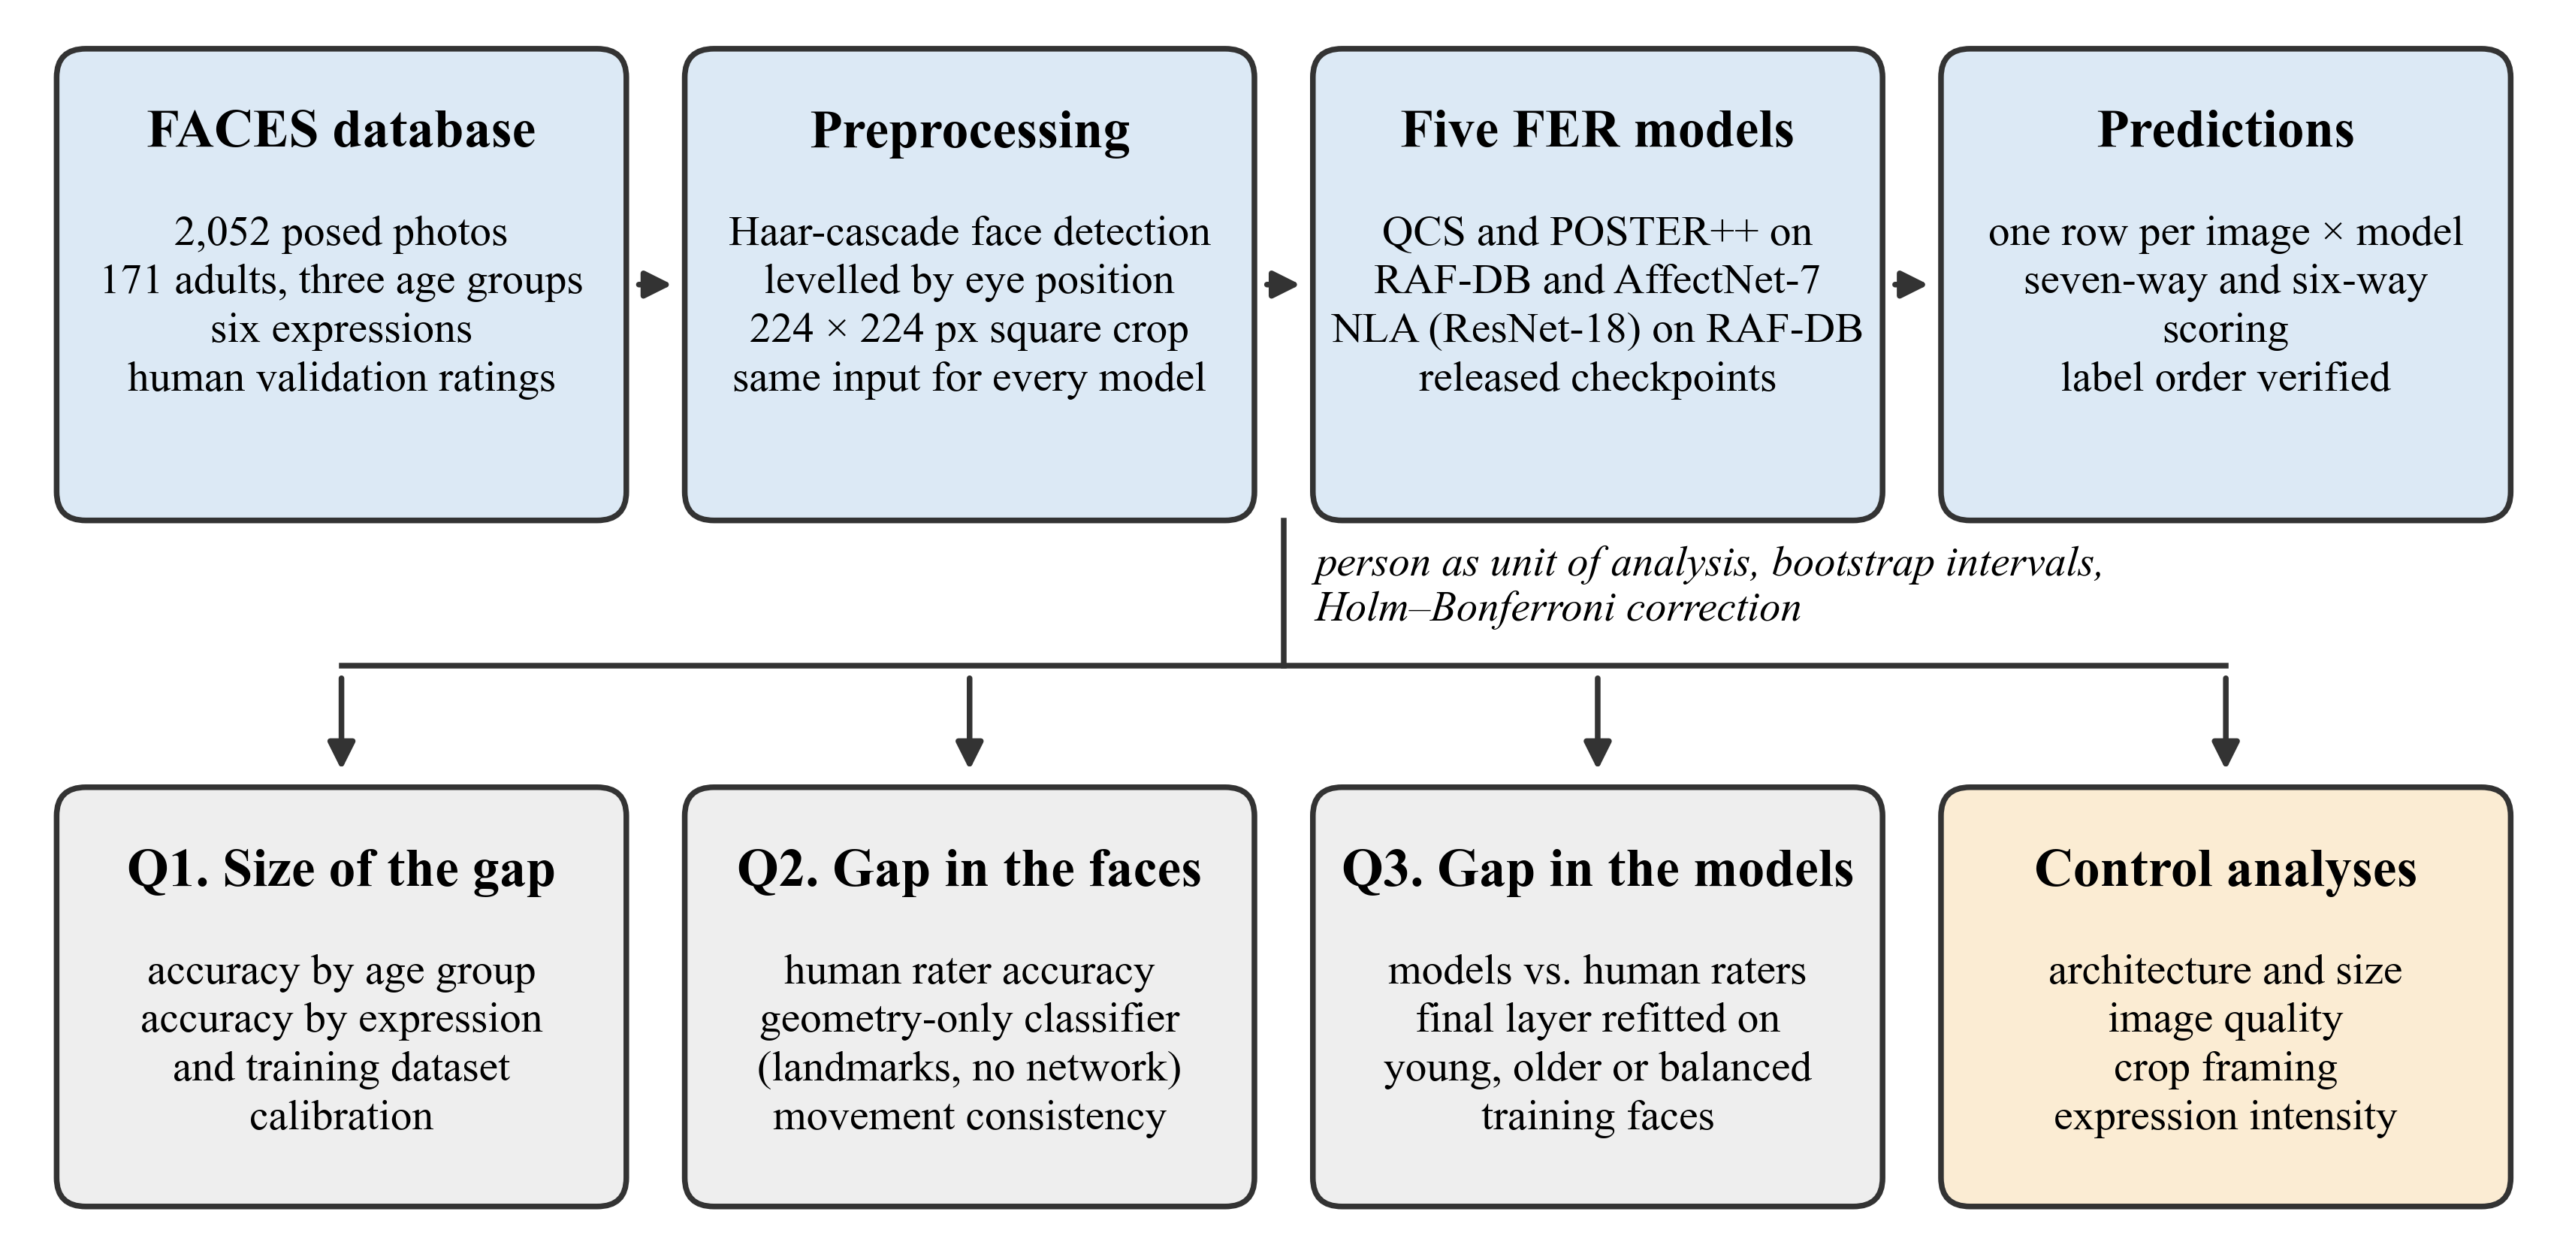
However, these systems are trained mainly on internet photographs, and in RAF-DB, the one widely used training corpus here with age labels, only 3% of training faces are aged 70 or older (see Discussion). Older faces differ: their skin is more lined and less taut, lighting and image quality can be different, and older adults may move the face differently to show the same feeling5. This study asks how accurately five publicly released FER models read the expressions of older adults. Three questions guide this, matching Figure 1: how big the age gap is (RQ1); how it compares for human raters and a geometry-only classifier, two methods that involve no FER model (RQ2); and how it compares across the five released models, including whether refitting each model’s final layer on older faces closes it (RQ3). A fourth question asks whether the gap depends on model architecture or training dataset (RQ4), and control analyses test the remaining proposed explanations: image quality, cropping and expression intensity. The scope is deliberately narrow: released checkpoints evaluated on posed photographs of adults aged 19 to 80 from a single database, without retraining except for a refit of the final layer in one experiment. The limitations this imposes are set out in the Discussion.
Significance of the Study
Automated expression analysis is being introduced in the settings which older adults are part of – from care homes to clinical monitoring6 and companion robots7. In each of these, an older adult is more likely to be the subject of the system than its operator. Thus, they are less able to notice a misreading, question it, or opt out.
This measurement gap can turn into a practical harm. The results reported here demonstrate that all five models read older faces less accurately than younger ones. For the AffectNet-7 models, the shortfall is largest on neutral faces, the expression a resting face shows most of the time. This finding agrees with Kim et al.8, who found that four commercial FER systems were least accurate on older adults. A system that reads a resting older face as sad or angry does not fail quietly. It reports distress that is not there, in settings where a flagged emotional state may inform a clinical judgment or a care decision8.
Furthermore, the shortfall is easy to miss in the published record. Widely used training corpora such as AffectNet carry no age labels, leaving the number of older adults they hold undocumented9, so a model can post strong overall accuracy while doing much worse on older faces without that ever surfacing. Corpora built under controlled conditions with deliberate age diversity, such as FACES, are the exception10. Evaluation by age is uncommon in any case: of 31 deep-learning FER studies on older adults published between 2015 and 2024, only six examined how age affected performance11.
Aims and Goals of the Study
This study evaluates how accurately open-source FER models classify the static facial expressions of older adults. This is defined here as the participants aged 69 and older who are labeled ‘old’ in the FACES database10. Five released models were chosen: QCS and POSTER++, each trained on RAF-DB and on AffectNet-7, and NLA trained on RAF-DB.
Existing Contribution and Gaps in the Literature
Facial expression recognition for older adults has drawn comparatively little work. The most recent systematic review of the area found only 31 deep-learning FER studies on elderly populations across a full decade, from 2015 to September 202411.
Kim et al.8 benchmarked four commercial FER systems on the same FACES corpus used here, across the same three age groups, and found that all four did best on younger and worst on older adults. That study established the disparity. However, it has not explained it. An earlier study using the Lifespan and FACES databases together reported the same pattern12, so the disparity recurs across different systems and corpora, not just this one.
Furthermore, where causes have been proposed, they have generally been asserted or tested one at a time rather than against each other. Three recur: age-related wrinkles and folds that alter how an expression reads13; a decline in facial-muscle function with age14, consistent with a smaller three-dimensional change between the resting and smiling face in older women15, and under-representation of older faces in training data, inferred from a 22% accuracy gain that Park et al.16 obtained by training separately on children’s and adults’ faces. The first two are already in tension, as Grondhuis et al.14 argued for muscle function over wrinkles. A related literature has begun addressing fairness in facial analysis more broadly: across age, gender and race in face recognition17, through evaluation protocols that control for these factors together18, through robustness checks under model compression19, and through training-time mitigations aimed specifically at age bias in FER20, building on earlier age-aware methods that used age directly as a training or classification signal21,22. This study differs in comparing the gap across recognition methods, rather than proposing a new training method or evaluation protocol. Three recent studies bear more directly on the present question: automated age-estimation systems lose more accuracy on older faces than human observers do23; an analysis of 20 FER datasets has documented demographic imbalance in their composition24; and a training-time method that suppresses age information in learned features has reduced age bias on RAF-DB and FACES25; another study learns separate expression features for different age group26. The Alternative Explanations for the Age Gap section compares these and other prior studies by dataset, what was tested and what they found.
Methods
Research design – Evaluation of Open-Source FER Models
This section describes the three architectures and the two training datasets used in the study, and the FACES database on which the models are tested.
QCS
Wang et al.27 designed Quadruplet Cross Similarity (QCS). It aims to stop the network from learning interfering features, cues that happen to correlate with an expression without being part of it.
QCS uses IR-50, a network pre-trained for face recognition on MS-Celeb-1M, as its backbone28. Its main innovation is Cross Similarity Attention, a spatial attention mechanism that decides where on the face to look. Unlike the dot-product attention of Vision Transformers, Cross Similarity Attention measures similarity with the Euclidean, or straight-line, distance between image features, which responds strongly where two images match.
QCS trains on groups of four images but, after a distillation step, classifies one image at a time. On the standard benchmarks, QCS reached 92.5% accuracy on RAF-DB and 67.94% on AffectNet-7, ahead of the other models in the authors’ comparison27.
POSTER++
POSTER++ is an open-source model built as a simpler, cheaper successor to POSTER29. Rather than relying on facial appearance alone, it combines two streams: appearance features from an IR-50 backbone and structural information from facial landmarks, processed with MobileFaceNet. The two streams are fused with cross-attention.
Mao et al.29 reported accuracies of 92.21% on RAF-DB and 67.49% on AffectNet-7. In this study, the constructed network measured 58.3 million parameters, larger than the 43.7 million that Mao et al. report.
NLA
Navigating Label Ambiguity (NLA) applies a new training scheme to a standard ResNet-1830. It targets label ambiguity and class imbalance, both common in FER datasets collected in the wild, with Noise-aware Adaptive Weighting, which raises the weight of clearly labeled training examples and lowers that of doubtful ones as training proceeds.
NLA reached 89.93% on RAF-DB and 67.06% on AffectNet-7, ahead of the previous best models on both30.
Training Datasets
QCS and POSTER++ were evaluated in versions trained on RAF-DB and on AffectNet-7, and NLA in its RAF-DB version only. RAF-DB holds about 30,000 facial images which were collected from the internet and labeled by around 40 annotators each, whose labels were then reconciled31. Its single-label subset of 15,339 images in the seven basic classes is the one most FER research uses. AffectNet-7 is a seven-class subset of AffectNet, which gathers more than a million internet images, about 450,000 of them hand-labeled9. AffectNet-7 uses roughly 284,000 training images and is markedly imbalanced, with far more happy and neutral faces than disgusted or fearful ones. Neither dataset was built for age balance.
The models are tested not on RAF-DB or AffectNet-7 but on FACES, a database built under controlled studio conditions across three age groups, described fully in the Data section10.
Methodology
Figure 1 summarizes the study design. The study is an observational, cross-sectional benchmark: released FER models were scored on an existing database of posed photographs, with no retraining except a refit of the final layer in one experiment (see Analyses), and accuracy was compared across age groups.
Data
The FACES database contains 2,052 posed color photographs of 171 adults in three age groups: young (19–31 years, n = 58), middle-aged (39–55, n = 56) and older (69–80, n = 57)10. Each person posed six expressions (anger, disgust, fear, happiness, neutrality and sadness) in two separate photo sets, giving 12 photographs per person. Lighting, pose and background are the same in every photograph, and each age-by-expression cell contains 112 to 116 images.
In addition, FACES provides validation ratings collected from 154 raters of three ages (52 young, 51 middle-aged, 51 older)10, each judging a subset of the photographs and choosing, for each one, the expression they judged it to show from the six expressions that the six-way model score also uses (see Models and Scoring). For each photograph, the ratings give the percentage of raters who chose the intended expression from the same six options. This study has used this percentage as human accuracy, aggregated at the photograph level; individual raters’ identities and responses are not in the published rating file, only this per-photograph percentage. Human accuracy is therefore the proportion of raters who chose the intended expression for each photograph, whereas model accuracy is a single prediction per photograph. The two are on the same percentage scale but are different kinds of measurement, made by different recognition systems, so differences between them are reported as a comparison of age gaps across methods, not as an estimate of how much difficulty the models add.
Preprocessing
Image preprocessing (face detection, alignment, cropping and resizing) was carried out with the agreement of the FACES Technical Agent. Each image was cropped once and cached, so every model received identical input. Faces were detected with an OpenCV Haar cascade, leveled using the positions of the eyes, cropped to a square and resized to 224 × 224 pixels. Detection succeeded on all 2,052 images. The detected boxes were about 9% larger on older faces (median 2,031 compared with 1,859 pixels). The crop margin was fixed at zero, a tight crop like RAF-DB’s training images, because the RAF-DB models lose accuracy quickly when the crop is looser (see Alternative Explanations for the Age Gap).
Models and Scoring
Five released checkpoints were evaluated without fine-tuning (Table 1). These three were chosen because each is open-source with publicly released pre-trained weights for at least one of RAF-DB and AffectNet-7, because label order and output format could therefore be verified empirically against FACES rather than taken on trust, and because two of the three, QCS and POSTER++, have released weights for both training datasets, which is what lets architecture and training data be varied independently for them. All three were also recent (published in 2025) and reported benchmark accuracies of 89.9% to 92.5% on RAF-DB (see QCS, POSTER++ and NLA), so they represent current open-source FER rather than older baselines. NLA, tested only with RAF-DB, is not part of that architecture-by-dataset comparison. All three architectures start from backbones pre-trained for face recognition on MS-Celeb-1M28, and POSTER++ and QCS load an identical backbone checkpoint, confirmed by comparing checkpoint file hashes. Each repository’s own test-time preprocessing was reproduced. The order of each model’s output labels was checked empirically, and happiness recall was at least 0.99 for every model under the verified order.
| Architecture (parameters) | RAF-DB | AffectNet-7 |
| QCS (82.9M) | Yes | Yes |
| POSTER++ (58.3M) | Yes | Yes |
| NLA / ResNet-18 (11.7M) | Yes | No |
FACES contains six expressions, whereas, the models output seven, including the facial expression for surprise. The primary score counts a surprise prediction as an error, as a deployed system would. Comparisons with human raters, who chose among six options, use a six-way score that ignores the surprise output. It is also used, so that every compared classifier chooses among the same six expressions, in the released-head comparison (see Supplementary Analyses, reported in the Age Gap in the Five Models section) and the architecture sensitivity check (Table 5).
Analyses
The analyses answer the four research questions: how big the gap is, how it compares for human raters and a geometry-only classifier, how it compares across the five released models, and whether it depends on architecture or training dataset, followed by control checks. The main variable is age group (young, middle-aged or older). The main outcome is whether each photograph’s expression was classified correctly, summarized as accuracy per person; the age gap is older-adult minus young-adult accuracy in percentage points. Secondary outcomes are per-expression recall, expected calibration error and agreement between models.
To measure the size of the gap, the study has compared accuracy on younger and older faces for each model and each expression. In terms of measuring calibration, the match between a model’s confidence and its accuracy, using expected calibration error (ECE)32, and the agreement between models with Fleiss’ κ was conducted.
To compare the gap with two methods that involve no FER model, two measures were used. The first is human accuracy on younger and older faces. The second is a linear discriminant classifier trained on facial geometry alone. Faces were landmarked with a face-alignment network that locates 68 points33. Each expressive photograph was aligned to the same person’s neutral photograph with a similarity transform fitted on rigid landmarks (nose bridge, nose base and eye corners). It was then coded as the displacement of the remaining points, in units of the distance between the eyes, which removes identity and head pose.
The classifier separated the five emotional expressions. It was trained and tested within each age group, and it was trained on young faces and tested on older ones. Each setting used 36 training people, different people for testing and 20 random splits. A third measure was how much people within each age group differed from one another in terms of how they moved the face for each expression. Each person’s movement was averaged over their two photo sets, and the difference between the two sets was used to remove landmark error and repeat-to-repeat variation (the detector’s placement error and genuine differences between a person’s two poses) from the spread between people. A person’s two neutral photographs gave a separate estimate of landmark noise.
The study first compared the models with human raters on the six-way score. Then, each network was frozen and trained a new linear classifier on its learned features, using FACES photographs of 36 young people, 36 older people, or 18 of each. The strength of regularization was chosen by cross-validation within each training set. Five candidate values (0.003 to 30, log-spaced) were each scored by four-fold cross-validation grouped by person within that 36-person training set alone, so a person’s own photographs never split across a fold’s training and validation portions; the value with the highest mean cross-validation accuracy was kept, ties going to the smaller value. The held-out people used for testing play no part in this step, since cross-validation only ever sees the 36 training people. All three versions were tested on the same held-out older people, and on the held-out young people (so that any difference between the three versions could only come from who was in their training data, not from an easier or harder test set), over 20 random splits that used the same partition for every version. Features and sample size are fixed. Therefore, the versions differ only in the age of the training faces. To check how much these choices mattered, the regularization grid, the number of training people per arm, the number of splits and the specific random partition into arms were each varied in turn and the gain recomputed; the results are reported in the Age Gap in the Five Models section.
Four control analyses tested other explanations. Architecture was tested by comparing the three models trained on RAF-DB, which range from 11.7M to 82.9M parameters, and by contrasting architecture and training dataset across the four QCS and POSTER++ models. To check image quality, the age effect was adjusted for lighting and exposure (mean luminance, contrast, entropy, colorfulness and face size) in a logistic regression that treats each person’s photographs as a cluster. Additionally, young and older faces were compared within thirds of each quality measure, to rule out image quality itself as a confound between the age groups. Crop framing was varied by re-cropping every face at margins of 0.0, 0.1, 0.2 and 0.3 of the detected box and scoring all five models again. Expression intensity was measured without a model. Measuring it without a model avoids picking up a model’s own biases. For six facial regions (brows, eyes, both cheeks, nasolabial region and mouth), the mean absolute pixel change was taken from the same person’s neutral photograph and divided by the change in forehead and jaw, so that skin texture cannot inflate it. Then, error rates were compared within six equal-sized intensity bins. This pixel-based measure is a proxy for intensity, not a full measure of it; it can be affected by alignment error, lighting, and age-related changes in facial appearance that are not expression intensity itself, such as static wrinkling, so it should be read as indicative rather than exact.
Statistical Analysis
Each person in the FACES dataset contributes 12 correlated photographs. Therefore, the person is the unit of analysis. Confidence intervals (CI) are 95% percentile bootstrap intervals from at least 2,000 resamples of whole people. Model comparisons are paired because every model scored the same images. Age gaps are reported in percentage points. Some analyses repeat over random splits of the same people, as in the refitting experiment and the geometry classifier. For these, each held-out person’s accuracy is averaged over the splits in which they were held out, and the intervals and permutation p-values come from those person-level values. Tests over the splits themselves were avoided because each person appears in many of the 20 splits, so the splits are not independent and tests over them overstate certainty. When several tests address one question, their p-values are adjusted with the Holm–Bonferroni method34. It keeps the chance of any false positive within the group at 5% and is less conservative than a plain Bonferroni correction. With 57 older adults, this still limits how small a true difference can be told apart from noise, particularly once the sample is split further by expression or subgroup; a result that is significant before correction but rests on a handful of points is reported here as suggestive, not solid.
Supplementary Analyses
To separate how much of the refitting improvement (see The Age Gap in the Five Models) comes from adapting to FACES in general rather than to older faces specifically, the released heads were also scored with the six-way restriction defined above (see Models and Scoring), without any refitting, on the same held-out people used in the refitting comparison.
The refitting experiment above was repeated with the training mix varied in steps of 25% older faces (0%, 25%, 50%, 75% and 100%), holding the total number of training people and the balance of labels fixed at each step.
As a check on whether the age gap depends on the Haar-cascade crop (see Preprocessing), every face was independently re-detected and re-aligned with the 68-point landmark network used for the geometry classifier above, fitting the eyes, nose and mouth to a fixed template rather than a bounding box, and every model was re-scored on these independently aligned crops.
To check whether the age gap also appears on the data the models were trained on, each RAF-DB-trained model was scored on RAF-DB’s own test set, grouped by the age labels RAF-DB distributes with its images31; this exploratory check is reported in the Alternative Explanations for the Age Gap section as point estimates, and the RAF-DB training-set age-composition figures in the Discussion come from the same source.
Ethical Considerations
No new data were collected from human participants. The FACES photographs and validation ratings were collected by the database’s developers10 and were used under the database’s license agreement, which restricts the images to scientific use and does not permit their redistribution. No FACES photograph is reproduced in this paper, and per-image model predictions are not released (see Data and Code Availability). RAF-DB images and age labels were obtained on request from its authors31 and used only to compute aggregate figures. Because the systems studied here are proposed for care settings, the results are reported to inform how such systems should be evaluated, not to endorse any of them for deployment.
Results
The Age Gap
Every model was less accurate on older faces, and accuracy fell steadily from young to middle-aged to older faces (Table 2, Figure 2).
| Model | Training data | Young | Middle-aged | Older | Gap (older − young) |
| QCS | AffectNet-7 | 92.0 [89.5, 94.4] | 84.8 [81.7, 87.9] | 78.2 [74.9, 81.6] | −13.7 [−18.1, −9.5] |
| POSTER++ | AffectNet-7 | 89.2 [86.6, 91.8] | 82.4 [79.3, 85.4] | 77.5 [74.1, 80.7] | −11.7 [−16.1, −7.4] |
| QCS | RAF-DB | 77.7 [74.3, 81.3] | 68.6 [65.2, 72.0] | 62.6 [59.5, 65.6] | −15.2 [−19.7, −10.6] |
| POSTER++ | RAF-DB | 74.3 [71.4, 77.3] | 67.3 [64.0, 70.5] | 60.7 [57.7, 63.6] | −13.6 [−17.7, −9.6] |
| NLA | RAF-DB | 61.5 [58.2, 64.9] | 55.8 [52.2, 59.7] | 46.8 [43.7, 50.3] | −14.7 [−19.4, −9.9] |
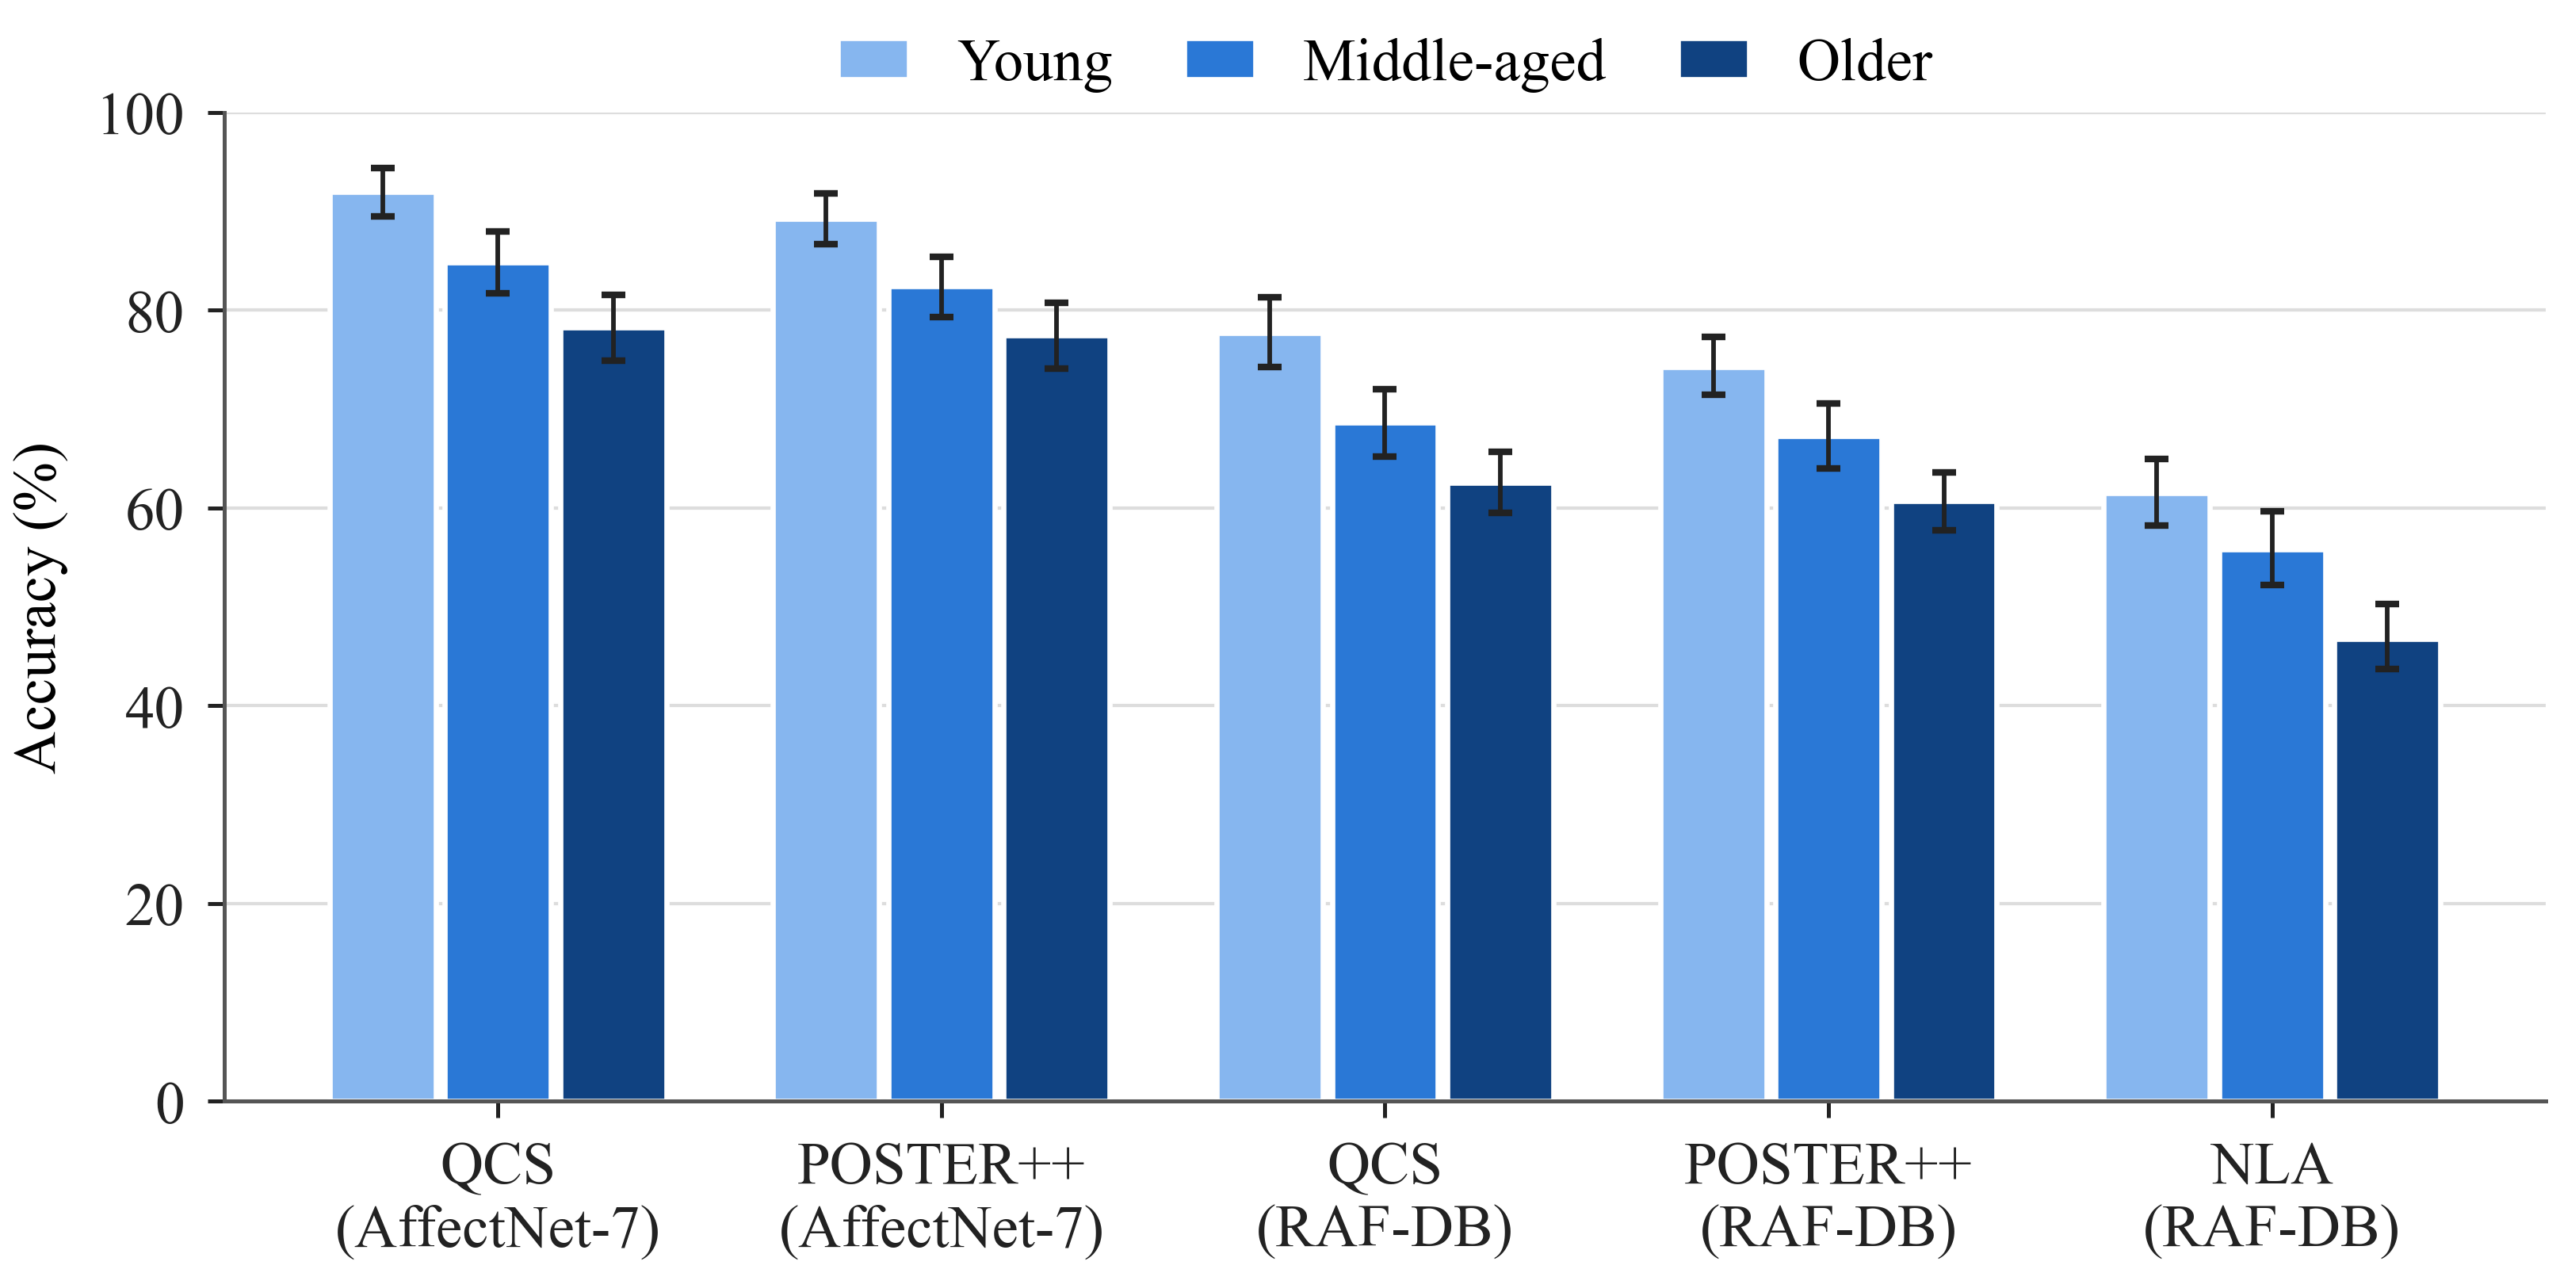
The age gap ranged from 11.7 to 15.2 percentage points, and every gap’s 95% interval excluded zero. The AffectNet-7 models were the most accurate on older adults (78.2% and 77.5%), although their gaps (13.7 and 11.7 points) were similar to the RAF-DB models’ (13.6 to 15.2). Relative to each model’s own young-face accuracy, the gaps range from 13.1% (POSTER++-AffectNet-7) to 23.9% (NLA-RAF-DB). The ranking changes slightly from the absolute figures: NLA-RAF-DB’s 14.7-point gap is proportionally the largest, even though QCS-RAF-DB’s 15.2-point gap is numerically larger, because NLA starts from a lower young-face accuracy (61.5% versus 77.7%).
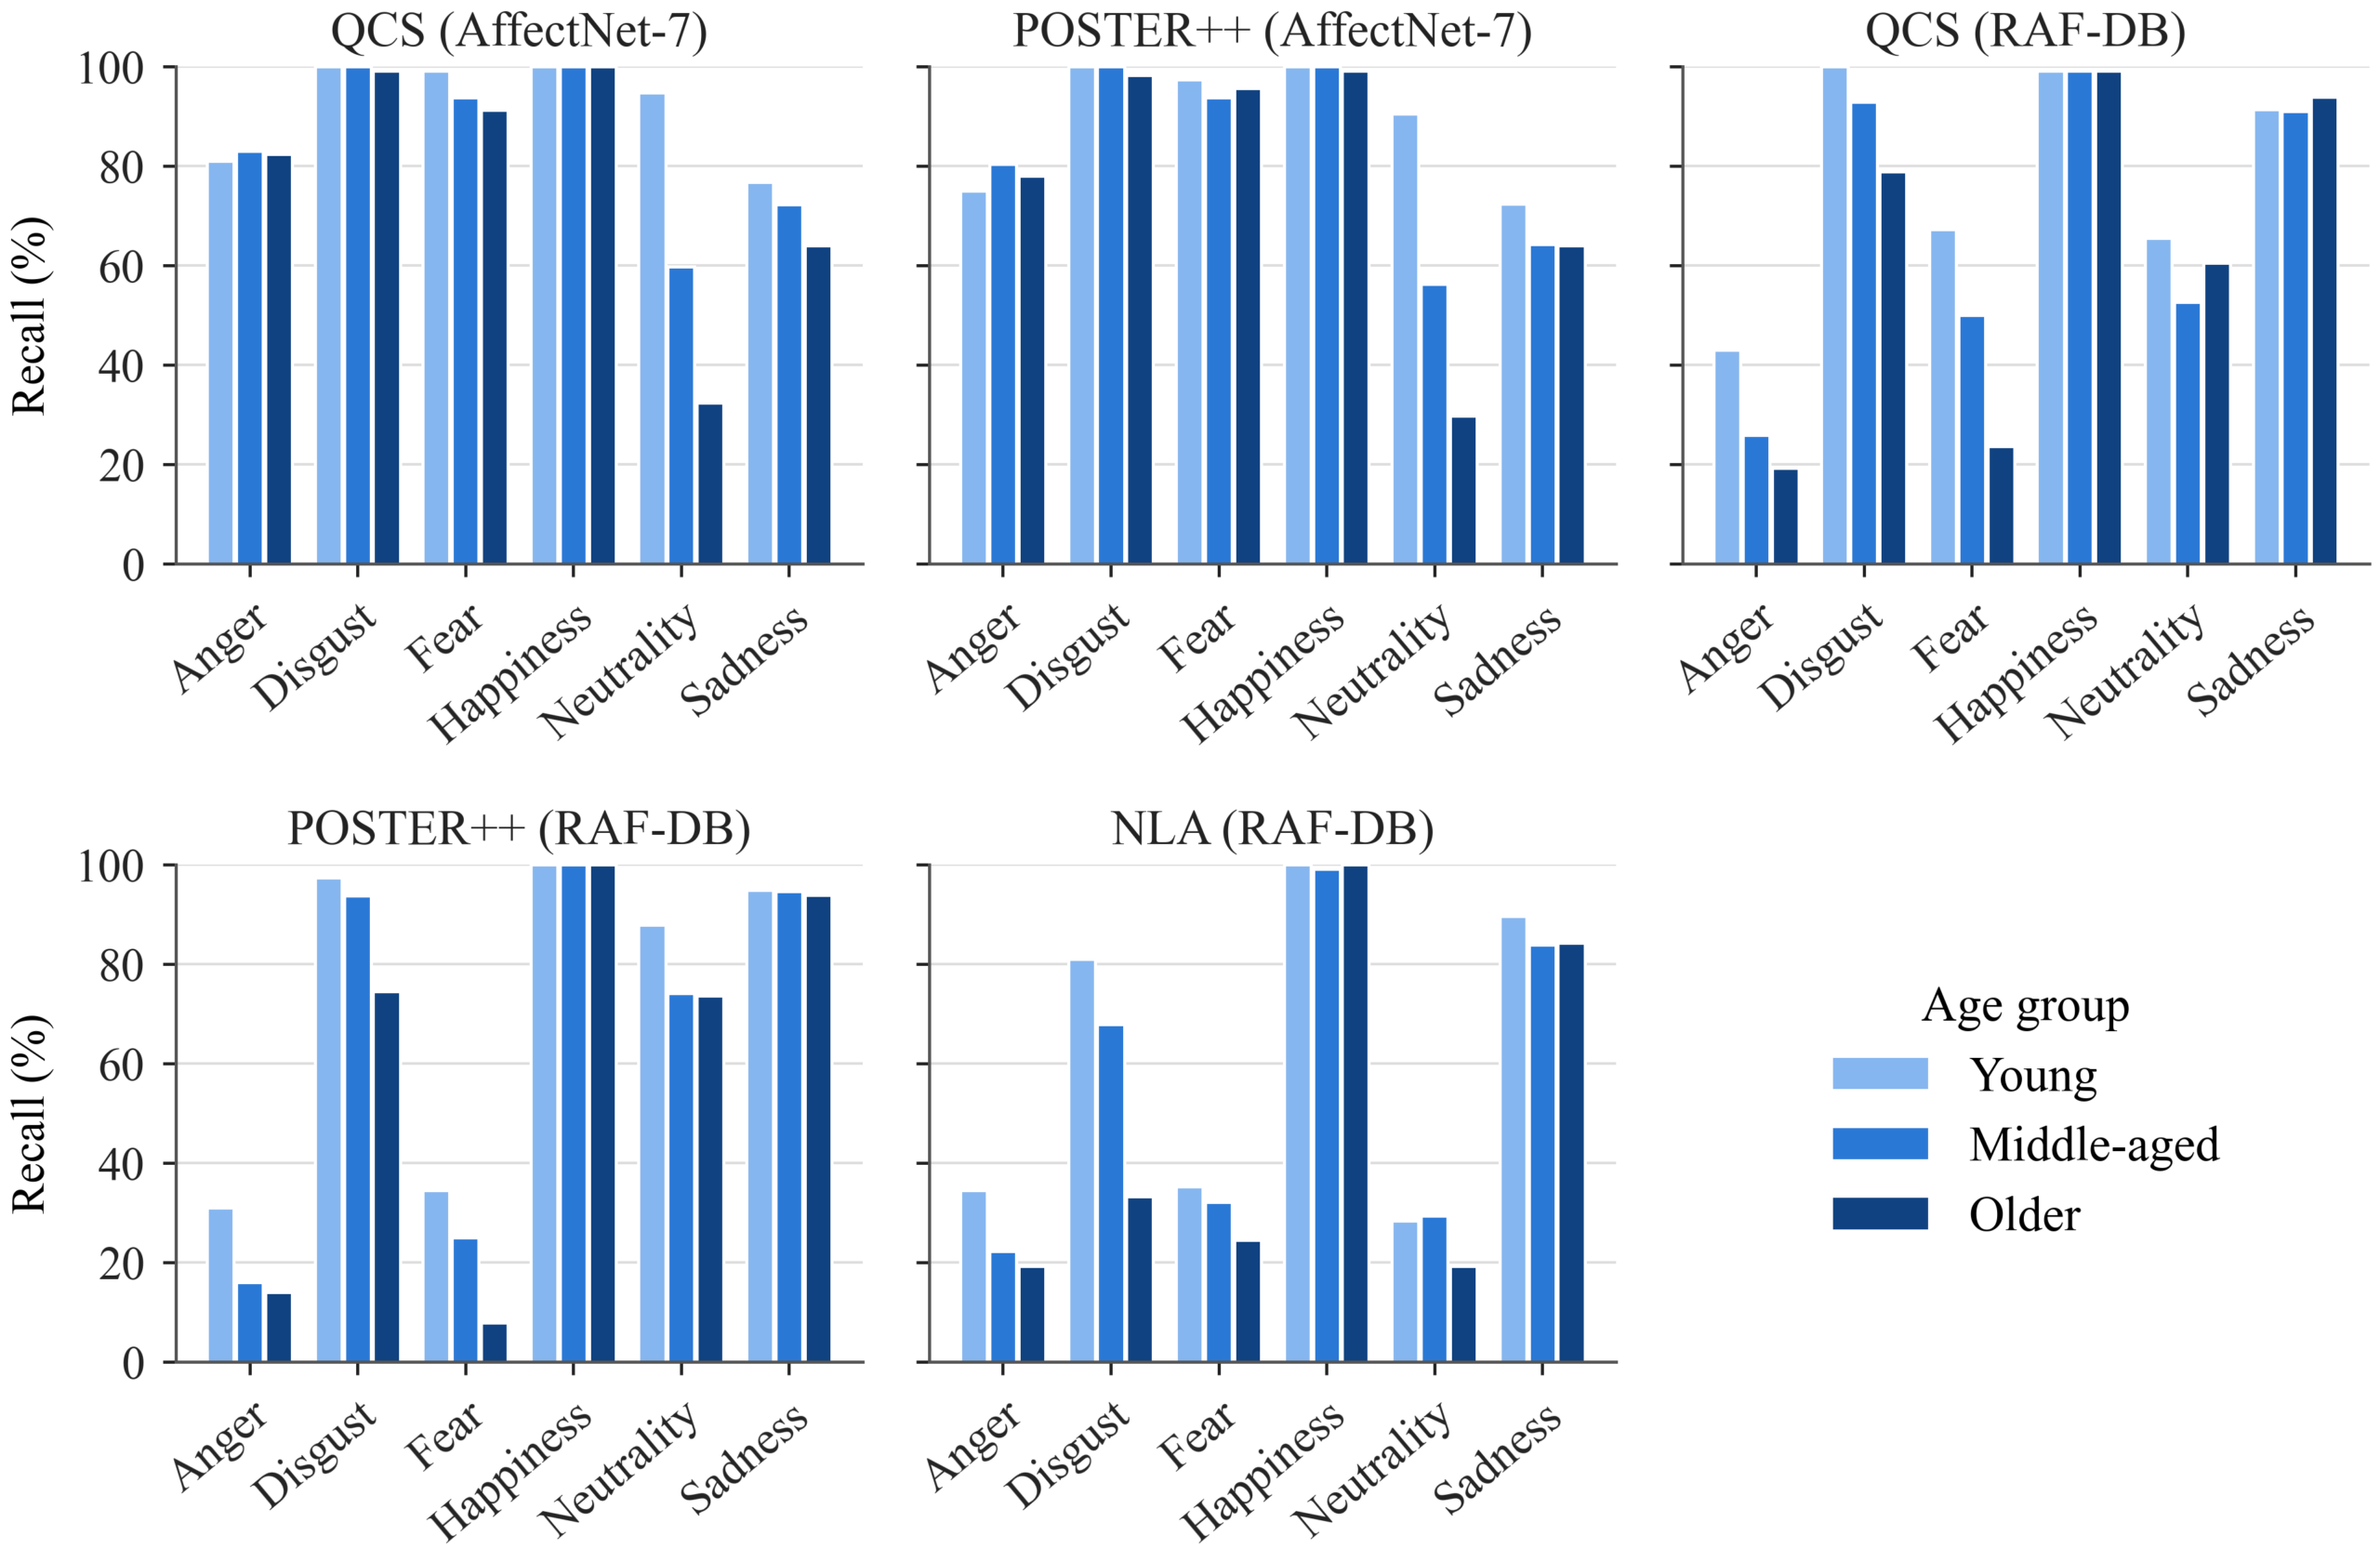
The failures differed by training dataset (Figure 3). For the AffectNet-7 models, recall on neutral faces fell from 90.5% (POSTER++) and 94.8% (QCS) for young adults to 29.8% and 32.5% for older adults. This collapse in one expression accounts for most of these two models’ overall age gap. Most of the missed faces were read as sad or angry, about equally often (POSTER++ 34% sad and 29% angry; QCS 30% sad and 31% angry). Their other expressions changed by 13 points or less. For the RAF-DB models, the largest losses were for disgust, fear and anger. Neutral recall fell by 5 points for QCS, 9 for NLA and 14 for POSTER++.
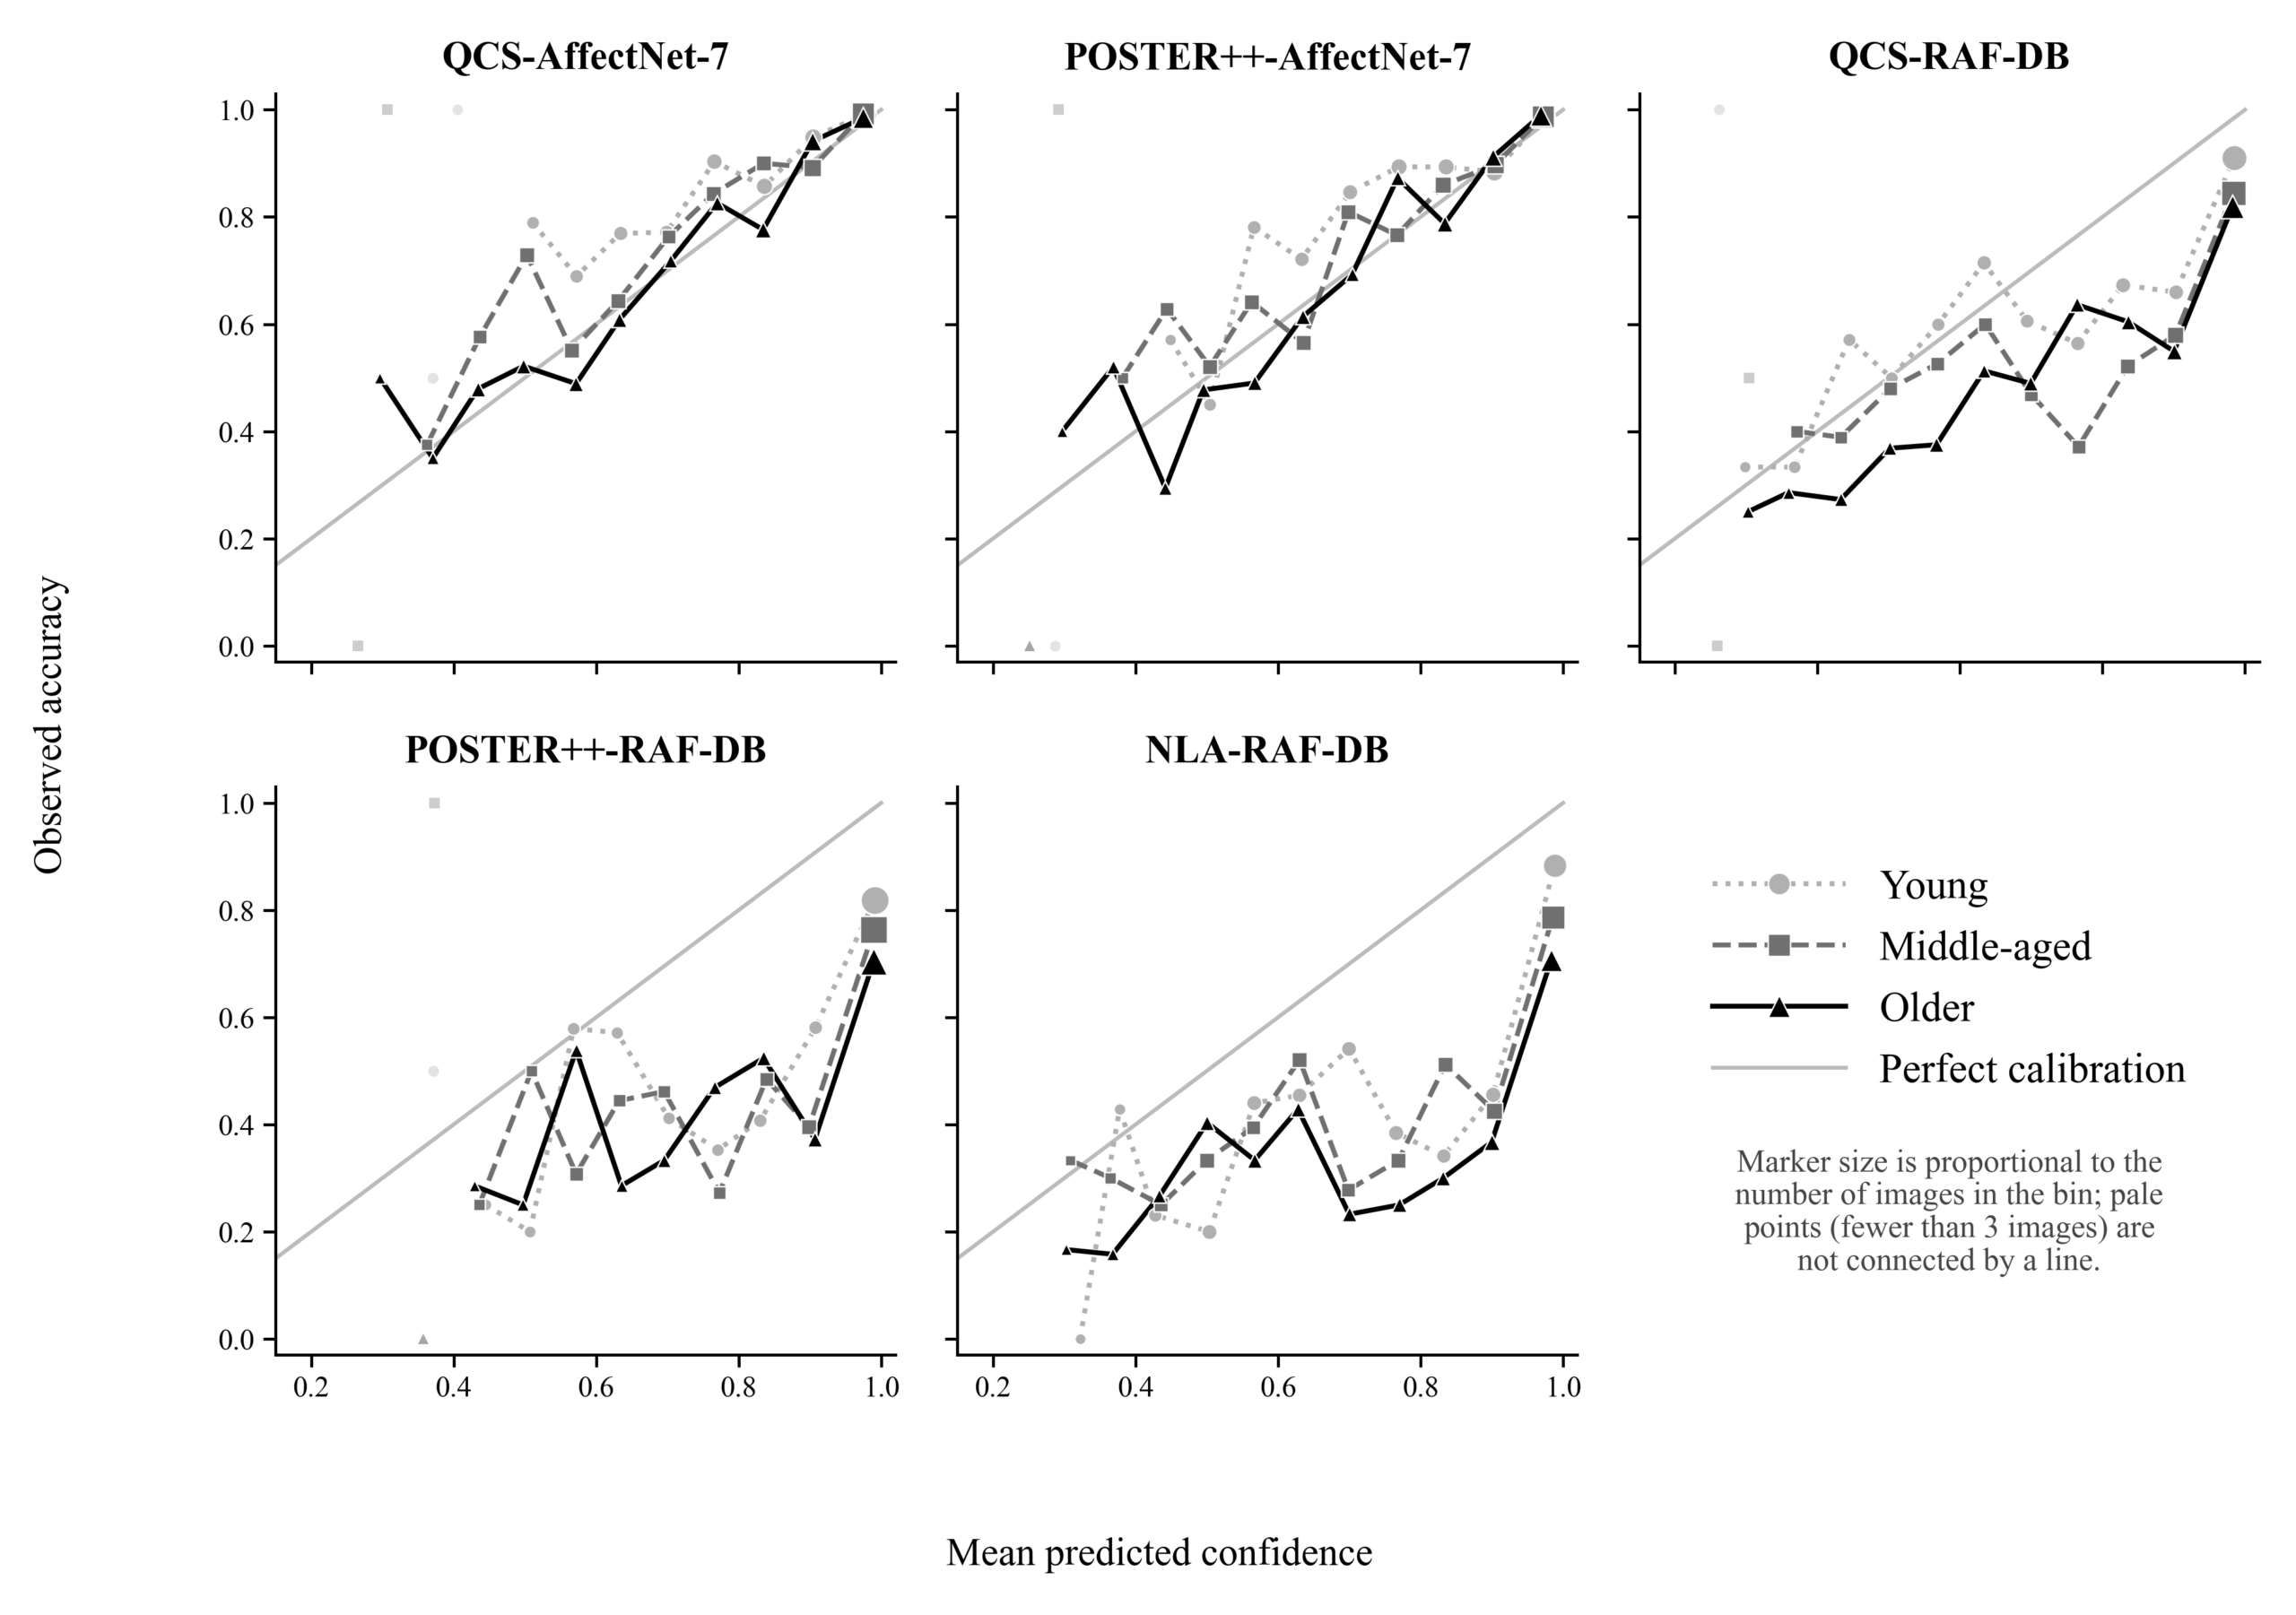
Calibration worsened with age for the three RAF-DB models (Figure 4), so their confidence scores became less trustworthy on older faces. Their expected calibration error rose from 0.19 (POSTER++), 0.20 (NLA) and 0.10 (QCS) on young faces to 0.30, 0.33 and 0.18 on older faces, whereas both AffectNet-7 models stayed between 0.03 and 0.06 at every age. Agreement between the models fell with age as well (Fleiss’ κ 0.69 for young, 0.61 for middle-aged and 0.54 for older faces). This pooled calibration gap is not spread evenly across expressions. For the RAF-DB models, it concentrates in anger, disgust, fear and neutrality, the same expressions where Table 3 already shows the largest accuracy losses on older faces; happiness and sadness, which these models read accurately regardless of age, show little to no calibration gap. Fear stands out further: for POSTER++-RAF-DB and QCS-RAF-DB it is poorly calibrated even on young faces (ECE 0.53 and 0.15), before a further rise on older faces (0.81 and 0.49), so age compounds an existing problem there rather than creating a new one. The AffectNet-7 models’ already-small pooled gap holds at the expression level too; no single expression hides a larger effect.
The Age Gap for Human Raters and a Geometry-Only Classifier
Human raters for the FACES dataset were less accurate on older faces (Table 3). Their accuracy fell from 85% on young faces to 76% on older faces, a gap of 8.6 points (95% CI 6.7 to 10.5). Raters of every age demonstrated a similar drop of 8 to 9 points. Thus, older raters had no advantage on older faces.
Trained and tested within each age group, the geometry-only classifier’s accuracy fell from 87.1% on young faces to 78.8% on older faces, a gap of 8.3 points (95% CI 4.5 to 12.0; permutation p = 0.0001), against a chance level of 20%. Trained on young faces and tested on older ones, it reached 75.9%, only 2.9 points below the classifier trained on older faces (95% CI 0.1 to 5.7; p = 0.05). A rule learned on young faces therefore transferred to older faces with a small further loss.
Landmark noise was similar at every age, since a person’s two neutral photographs differed by about the same amount in each group (p = 0.09). Once landmark noise and repeat-to-repeat variation were removed, older adults differed more from one another than young adults for anger, fear and happiness. Each 95% interval excluded zero, although the Holm-corrected test found none of the three statistically significant (all Holm-adjusted p ≥ 0.07). Disgust demonstrated no age difference, and for sadness it was the young adults who varied more (Holm-corrected p = 0.015). Because the three differences in the expected direction were not significant after Holm correction, and the one significant difference, for sadness, ran in the opposite direction, these data give no reliable evidence that older adults pose more variably than young adults.
| Expression | People | AffectNet-7 models | RAF-DB models |
| Neutrality | -11.3 [-15.1, -8.0]* | -60.7 [-72.1, -48.8]* | -9.7 [-21.1, +1.5] |
| Happiness | -1.1 [-2.0, -0.2]* | 0.0 [0.0, 0.0] | -0.3 [-0.9, 0.0] |
| Sadness | -12.8 [-18.6, -7.1]* | -10.5 [-25.3, +4.3] | -1.3 [-8.5, +6.0] |
| Anger | -11.4 [-15.8, -7.1]* | +2.2 [-9.9, +14.4] | -18.7 [-31.1, -6.4]* |
| Fear | -1.9 [-5.5, +1.6] | 0.0 [-1.8, +2.1] | -37.3 [-48.0, -26.4]* |
| Disgust | -13.1 [-18.7, -7.3]* | -1.3 [-3.5, 0.0] | -30.5 [-39.3, -22.1]* |
| All expressions | -8.6 [-10.4, -6.8] | -11.7 [-15.6, -7.9] | -16.3 [-20.0, -12.9] |
The Age Gap in the Five Models
The models’ gaps exceeded the human gap and were far larger for particular expressions (Table 3). On older neutral faces, the AffectNet-7 models lost about 61 points compared with 11 for people. On older fearful faces, the RAF-DB models lost 37 points and people lost 2. Both gaps are robust with participant-level intervals and Holm correction (see Statistical Analysis): AffectNet-7 neutrality (95% CI −72.1 to −48.8 points, Holm p < 0.001) and RAF-DB fear (95% CI −48.0 to −26.4 points, Holm p < 0.001). The RAF-DB models’ anger and disgust gaps are robust as well (−18.7 points, 95% CI −31.1 to −6.4, Holm p = 0.018; −30.5 points, 95% CI −39.3 to −22.1, Holm p < 0.001), while their neutrality gap of −9.7 points is not distinguishable from no difference once corrected (95% CI −21.1 to +1.5, Holm p = 0.29). None of the AffectNet-7 models’ other five expressions reach significance after correction; their anger point estimate even runs the other way (+2.2 points, 95% CI −9.9 to +14.4). People show a robust gap on every expression except fear (−1.9 points, 95% CI −5.5 to +1.6, Holm p = 0.32); their happiness gap, though statistically real after correction (Holm p = 0.043), is only 1.1 points, closer to a ceiling effect than a meaningful difficulty gap. The AffectNet-7 models misread 56% of the older neutral faces that at least 90% of raters identified correctly, and the RAF-DB models misread 52% to 74% of the older anger, disgust and fear faces that at least 90% of raters identified correctly.
Within FACES, refitting only the final layer largely removed the age gap (Table 4). With each network frozen, a classifier trained on older faces was 6.1 to 13.7 points more accurate on held-out older people than one trained on young faces. The interval across people excluded zero for every model (Holm-adjusted p = 0.0002). A classifier trained on half older and half young faces recovered 76% to 94% of that gain. The classifier trained on older faces was about as accurate on older faces as on young ones, with gaps from −4.1 to +1.2 points, while the one trained on young faces left gaps of 11 to 21 points. Within FACES, then, the frozen features carry enough information to read older faces, although this does not show why the released final layers fail; the Gain column captures only the age-specific part of the improvement. Scoring the released heads six-way on exactly the same held-out people separates the two: refitting on FACES at all, before any older face is added to training, already closes 43% to 74% of the total improvement over the released heads, largest for NLA; training on older faces specifically accounts for the remaining 26% to 57%. Varying the training mix in steps of 25% older faces shows the same split another way: the two AffectNet-7 models reach within 1 to 2 points of their full 100%-older result already at 25% older faces, while the three RAF-DB models continue to improve by a further 4 to 5 points from 25% to 100%. The size of the gain depended on how strongly the classifier was regularized, ranging from 5 to 15 points across the settings tried (least for NLA), but every model gained at every setting. Training-set size mattered more than any other setting tried: with 20 splits and cross-validated regularization, the gain for POSTER++-RAF-DB rose from 6.7 points at 12 training people per arm to 14.5 points at 42, and QCS-AffectNet-7 rose from 2.4 to 7.1 points; both were still rising at 42, the largest size the 57 older participants allow, so the 36-person gain reported above is not necessarily the ceiling. The number of splits (10 to 40) and the specific random partition into arms (three alternate seeds) moved the gain far less, by at most 1.8 points for any model, so the result does not hinge on the number of splits or on which people happened to land in which arm.
| Model | Trained on young | Trained on balanced | Trained on older | Gain | p (Holm) | |||
| Tested on older | Tested on young | Tested on older | Tested on young | Tested on older | Tested on young | Points [95% CI] | ||
| QCS (AffectNet-7) | 87.8 | 98.5 | 93.5 | 98.2 | 93.9 | 98.0 | +6.1 [+3.8, +8.3] | 0.0002 |
| POSTER++ (AffectNet-7) | 86.6 | 97.6 | 93.3 | 97.4 | 93.7 | 96.6 | +7.1 [+5.1, +9.8] | 0.0002 |
| QCS (RAF-DB) | 78.2 | 96.6 | 86.5 | 96.7 | 89.1 | 90.5 | +10.9 [+8.3, +13.6] | 0.0002 |
| POSTER++ (RAF-DB) | 73.7 | 94.7 | 84.7 | 94.6 | 87.4 | 86.2 | +13.7 [+11.4, +16.0] | 0.0002 |
| NLA (RAF-DB) | 74.5 | 94.2 | 81.3 | 93.0 | 83.2 | 86.6 | +8.8 [+5.8, +12.8] | 0.0002 |
Alternative Explanations for the Age Gap
This section addresses RQ4 and tests the other explanations listed in the Analyses section: architecture and model size, training dataset, the image quality of the FACES photographs, cropping and expression intensity.
Table 5 summarizes the control analyses. The age gap survived all four.
| Explanation | Test | Result |
| Architecture and size | Age gaps of the three RAF-DB models (11.7M to 82.9M parameters) | Seven-way score: gaps differ by at most about 1.5 points (Holm p = 1.00). Six-way score: by up to 4.6 points (Holm p = 0.07) |
| Image quality | Age effect adjusted for lighting and exposure; age gap within thirds of each quality measure | Odds ratio for an error on older faces 1.8–3.2 before and 1.5–3.4 after adjustment; gap of 9 to 20 points in every third |
| Face detection and cropping | Detection rate; age gap at crop margins 0.0 to 0.3 | Detection 100% (2,052 of 2,052); face boxes about 9% larger on older faces (median 2,031 vs 1,859 px); pooled gap of 12 to 14 points at every margin, each interval excluding zero. Independent landmark-based alignment: pooled gap 9.1 points (95% CI 5.6 to 12.6) |
| Expression intensity | Error rate in six intensity bins matched across age groups | Older faces misread 1.3 to 2.4 times as often in every bin; adjusting for intensity did not reduce the age odds ratio (1.9 before, 2.5 after) |
Crop framing mattered more than age for the RAF-DB models. Widening the margin from 0.0 to 0.3 lowered their accuracy on young faces by 26 to 44 points, and their happiness recall to as low as 0%, against about 5 points for the AffectNet-7 models. The age gap itself stayed between 12.0 and 14.2 points, pooled over the five models, at every margin. The Haar cascade’s boxes were also about 9% larger on older faces (see Preprocessing). This by itself is a margin difference in effect, and the sweep above already covers it: widening the crop changes box size in the same direction, yet the age gap did not move. The sweep cannot rule out misalignment within a correctly sized box, so every face was also re-detected and aligned to a fixed template with the 68-point landmark network (see Supplementary Analyses). It found a face in all 2,052 photographs and reproduced the size pattern: the median distance between the eyes was about 7% larger for older than young faces (377 versus 351 pixels). Scored on these independently aligned crops, every model remained less accurate on older faces, with point-estimate gaps from 8.1 points (QCS-RAF-DB) to 10.2 (QCS-AffectNet-7), pooled at 9.1 points across the five models (95% CI 5.6 to 12.6, excluding zero). These gaps are smaller than the 11.7 to 15.2 points reported in Table 2 under the Haar crop; every model was also less accurate overall under this alignment, since none of the five was trained or benchmarked on this particular template, so the drop in gap size cannot be separated cleanly from the drop in overall accuracy. The gap therefore survives an alignment independent of the Haar cascade, although how much of its size reflects alignment quality remains open.
The training dataset did not change the size of the gap either. In the 2 × 2 design (QCS and POSTER++, each trained on RAF-DB and on AffectNet-7), none of the three effects on the seven-way score was significant. The training dataset shifted the gap by −1.6 points (95% CI −7.0 to +3.3), architecture by −1.8 (−4.3 to +0.8) and their interaction by +0.5 (−4.0 to +4.9). The six-way score gave the same picture for the training dataset (−4.0, −8.8 to +0.8) and for architecture (+1.6, −0.8 to +4.0), but the interaction was significant (+6.1 points, 1.4 to 10.7; Holm p = 0.03). Within the RAF-DB models, QCS’s gap was nominally 4.6 points smaller than POSTER++’s (0.6 to 8.8), which the Holm-corrected test did not find statistically significant (p = 0.07); on AffectNet-7 the difference ran 1.4 points the other way, reported here only as a point estimate. With 57 older adults, neither should be read as a reliable architecture effect.
The standard blur measure, variance of the Laplacian, behaved unexpectedly. It was 90% higher on older faces (median 245 compared with 129). Wrinkles are fine detail, so on older faces the measure tracks skin texture rather than focus, and it was left out of the image-quality adjustment.
An exploratory check on RAF-DB’s own test set, grouped by the age labels RAF-DB distributes (see Supplementary Analyses), found almost no age gap for the three RAF-DB models: the 40-to-69 group scored at least as well as the 20-to-39 group, and the 70-plus group (n = 89) was only 1 to 3 points lower, far smaller than the 11.7-to-15.2-point gap on FACES. These are point estimates without intervals, and the 70-plus group is small, so the result is reported as exploratory.
Table 6 places this study alongside the prior work discussed in the Existing Contribution and Gaps in the Literature section.
| Study | Dataset / Sample | What Was Tested | Key Finding |
| Kim et al.8 | FACES, 3 age groups, 4 commercial FER systems | Accuracy by age group | All four systems least accurate on older adults; disparity not explained |
| Guo, Guo & Li12 | Lifespan, FACES, automated FER | Age-group-constrained vs. age-removing recognition | Aging significantly affects computational expression recognition |
| Wang et al.21 | Lifespan, FACES, Bayesian network | Age used as privileged information during training | Age-aware training improves recognition accuracy across age groups |
| Fölster et al.13 | Human raters, posed photographs | Facial age / wrinkles (perception) | Raters decode older faces’ expressions less accurately |
| Grondhuis et al.14 | Human raters, landmark data | Facial-muscle function vs. wrinkles | Muscle function, not wrinkles, better explains the perception gap |
| Tanikawa et al.15 | 130 Japanese women, 3D face scans | Facial-geometry change, rest vs. smile | Older women show less 3D change between resting and smiling faces |
| Park et al.16 | Custom FER model, split by age | Training-set age composition | Training separately on children’s and adults’ faces raised accuracy by 22 points |
| Xu et al.35 | RAF-DB, CelebA | Demographic bias and fairness, several factors | FER systems show accuracy gaps across demographic subgroups |
| Asgarian et al.6 | Older adults with dementia | Facial-landmark-detector bias | Landmark accuracy lower for people with dementia; bias persists after retraining |
| Gaya-Morey et al.11 | Systematic review, 31 studies | Which studies examine age at all | Only 6 of 31 FER studies on older adults test for an age effect directly |
| This study | FACES, 5 released models, human raters, geometry classifier | Architecture, training dataset, image quality, cropping, expression intensity, final-layer refit | Gap survives every control tested; within FACES, refitting the final layer on older faces nearly closes it |
Discussion
All five models were less accurate on older adults. For QCS and POSTER++, architecture and training dataset were varied independently, so for these two the gap is unlikely to reflect a single model family or dataset; NLA, tested only on RAF-DB, is a further data point rather than part of that controlled comparison.
The size of the age gap differs by recognition method. The five released models lost 11.7–15.2 points, against 8.6 for human raters and 8.3 for a geometry-only classifier. On neutral faces, the AffectNet-7 models lost 61 points, against 11 for people. Each training dataset has its own failure pattern. AffectNet-7 models misread neutral faces as sad or angry, while RAF-DB models lost fear, disgust and anger. This dataset-specific pattern is consistent with, but does not show, the hypothesis that each training set teaches cues that transfer poorly to older faces.
Whether training-set age composition is associated with the gap can be checked directly for RAF-DB, whose images carry age-group labels31: only 15.6% of its training faces are aged 40 to 69 and 3.0% are 70 or older, against 53% aged 20 to 39, and some expressions are thinner still: fear has just 54 training faces aged 40 or older, and 6 aged 70 or older. Yet on RAF-DB’s own test set the released models show almost no age gap (see Alternative Explanations for the Age Gap). This suggests that under-representation alone may not explain the gap on FACES, though it does not rule it out: a classifier can still fail on how an age group’s expressions look while succeeding on the easier task of its own familiar images. Age composition is also not the only difference between the training sets and FACES; annotation procedures, source imagery and per-expression class sizes differ too, and the comparison here speaks only to age. For AffectNet-7, whose images carry no age labels, estimated demographic profiles of the kind used in a recent analysis of demographic bias across 20 FER datasets24 can approximate its age composition: one audit of ten FER benchmarks estimated that about 13% of AffectNet faces are over age 6036. The posed studio photographs in FACES also differ from the internet photographs in both training datasets9,10,31, and either explanation, or both together, could leave the final layer poorly matched to older faces; telling them apart needs tests on the training datasets themselves. In principle this is possible: refitting the final layer separately on each source’s own images, with controlled age mixes, would show whether the deficit lies in the released weights or in what the training data contains. The controlled refitting experiment is left for future work.
For anyone deploying FER with older adults, the training dataset was associated with a bigger difference in accuracy on older adults than architecture or model size (in accuracy level, not in the size of the age gap; see Alternative Explanations for the Age Gap). For the two architectures tested on both datasets, switching the training data changed accuracy on older adults by 15 to 17 points, while switching architecture within the same training data changed it by under 2 points. Refitting the final layer on faces like those of the intended users is a cheap remedy worth testing; training-time methods that suppress age information in the learned features have also reduced age bias on RAF-DB and FACES25, and confidence scores from the RAF-DB models should be treated as unreliable for older users. Researchers running age comparisons should calibrate crop framing, which moved the RAF-DB models’ accuracy more than age did, and avoid blur measures that respond to wrinkles. At a minimum, any evaluation of an FER system for use with older adults should report accuracy separately by age group, recall by expression rather than only an overall figure, a calibration measure such as expected calibration error, participant-level uncertainty rather than a single pooled number, and performance on images that resemble the system’s intended application rather than only a benchmark’s own test set.
Several limitations apply. All five models share face-recognition pre-training on MS-Celeb-1M, a property of the released checkpoints that this study could not vary. Comparisons between QCS and POSTER++, which load an identical backbone checkpoint, cannot be confounded by pre-training; comparisons involving NLA, whose ResNet-18 backbone shares the pre-training data but not the checkpoint, are less tightly controlled; what shared pre-training could still do is shape every model’s age gap in the same direction, a pattern the five-way comparison cannot detect, which limits how far these results generalize to FER systems built on a different backbone. FACES contains posed studio photographs, and spontaneous expressions may behave differently; recent work has begun testing recognition on naturalistic recordings of older adults, such as video of children’s and older adults’ emotional reactions37 and conversations with a virtual coach38 (the Conclusion sets out what further testing would be needed before clinical or care use). The human ratings record only whether raters chose the intended expression, so human and model confusions cannot be compared directly. Landmark noise was large for everyone, about a third of the size of the expression movements, which limits how finely differences in movement can be measured even though the noise was similar across ages. The geometry classifier’s loss when transferring from young to older faces was small, so the geometric evidence rests mainly on its within-age gap. The ‘older’ group here is specifically 69 to 80 years old, the range FACES provides; adults over 80, and populations outside this sample’s demographic and cultural makeup, were not tested, and the gap reported here should not be assumed to generalize beyond them without separate evaluation. Finally, every result here comes from a single test database; the refitting result in particular has not been tested on a second, independent age-diverse dataset, such as the Lifespan Database12, and should be read as holding within FACES until it is.
Conclusion
Architecture, image quality, cropping and expression intensity leave the gap in place, although it was smaller (9.1 points, pooled) under an independent landmark-based alignment. In terms of the four research questions, the gap is 11.7 to 15.2 points for every model (RQ1); it is larger for every model than for human raters or a geometry-only classifier (RQ2); within FACES, refitting each model’s final layer on older faces largely closes it (RQ3); and the size of the gap did not depend on architecture or training dataset, although training dataset changed accuracy levels (RQ4).
Within FACES, the refitting result shows that the frozen features carry enough information to read older faces: scored against the released heads on the same held-out people, training on older faces specifically accounts for 26% to 57% of the improvement, and refitting on FACES in general for the rest. Why the released layer fails on older faces to begin with remains an open question. Until the reason for the failure is known, FER systems used with older adults should be evaluated by age before deployment, and their confidence scores checked on older users.
This study measured accuracy on posed, studio photographs of six deliberately performed expressions, not on spontaneous expressions captured during daily life or care, and it tested no clinical outcome. Its results also rest on 57 older adults aged 69 to 80 from a single database (see Statistical Analysis and Discussion). These results should not be read as evidence that a deployed system reads real-world emotional states or predicts care-relevant events accurately, for older adults or for anyone else. Before such use, a system would need validation on spontaneous or naturalistic expressions from older adults, a demonstrated link between its output and the clinical or care outcome it is meant to support, and the same age-stratified evaluation recommended here, repeated under those conditions.
As these systems move into the homes and care settings of older adults, the people least able to question a misreading should not be the people a system reads least accurately.
Data and Code Availability
Data and code for this study will be available at https://github.com/jscwang/fer-age-gap. FACES images and data derived from individual images cannot be shared by the author. Researchers may request access to the FACES database from the Max Planck Institute for Human Development (facesdatabase@mpib-berlin.mpg.de).10
Acknowledgments
This study used the FACES database10, developed at the Max Planck Institute for Human Development, Berlin, Germany. Access was granted under the FACES Platform Release Agreement. In accordance with this agreement, no FACES images are reproduced in this paper.
The completion of this research paper would not have been possible without the guidance of Dr. Md Masudur Rahman at Purdue University.
Declaration of Artificial Intelligence Use
The author used Claude to debug code and help locate relevant peer-reviewed articles. No generative AI tools were used to draft, expand, or alter any narrative text within this manuscript. The author assumes full accountability for the accuracy and integrity of the final code and analysis.
References
- World Health Organization. Mental health of older adults [Fact sheet]. 2026, https://www.who.int/news-room/fact-sheets/detail/mental-health-of-older-adults. [↩] [↩]
- Z. Fei, E. Yang, L. Yu, X. Li, H. Zhou, W. Zhou. A novel deep neural network-based emotion analysis system for automatic detection of mild cognitive impairment in the elderly. Neurocomputing. Vol. 468, pg. 306–316, 2022, https://doi.org/10.1016/j.neucom.2021.10.038. [↩]
- Z. Jiang, S. Seyedi, R. U. Haque, A. L. Pongos, K. L. Vickers, C. M. Manzanares, J. J. Lah, A. I. Levey, G. D. Clifford. Automated analysis of facial emotions in subjects with cognitive impairment. PLOS ONE. Vol. 17, pg. e0262527, 2022, https://doi.org/10.1371/journal.pone.0262527. [↩]
- L. Bergamasco, A. Coletta, G. Olmo, A. Cermelli, E. Rubino, I. Rainero. AI-based facial emotion analysis for early and differential diagnosis of dementia. Bioengineering. Vol. 12, pg. 1082, 2025, https://doi.org/10.3390/bioengineering12101082. [↩]
- H. Ko, K. Kim, M. Bae, M.-G. Seo, G. Nam, S. Park, S. Park, J. Ihm, J.-Y. Lee. Changes in computer-analyzed facial expressions with age. Sensors. Vol. 21, pg. 4858, 2021, https://doi.org/10.3390/s21144858. [↩]
- A. Asgarian, S. Zhao, A. B. Ashraf, M. E. Browne, K. M. Prkachin, A. Mihailidis, T. Hadjistavropoulos, B. Taati. Limitations and biases in facial landmark detection: an empirical study on older adults with dementia. Proceedings of the IEEE/CVF Conference on Computer Vision and Pattern Recognition Workshops. pg. 28–36, 2019, https://arxiv.org/abs/1905.07446. [↩] [↩]
- H. Abdollahi, M. H. Mahoor, R. Zandie, J. Siewierski, S. H. Qualls. Artificial emotional intelligence in socially assistive robots for older adults: a pilot study. IEEE Transactions on Affective Computing. Vol. 14, pg. 2020–2032, 2023, https://doi.org/10.1109/TAFFC.2022.3143803. [↩]
- E. Kim, D. Bryant, D. Srikanth, A. Howard. Age bias in emotion detection: an analysis of facial emotion recognition performance on young, middle-aged, and older adults. Proceedings of the 2021 AAAI/ACM Conference on AI, Ethics, and Society. pg. 638–644, 2021, https://doi.org/10.1145/3461702.3462609. [↩] [↩] [↩] [↩]
- A. Mollahosseini, B. Hasani, M. H. Mahoor. AffectNet: a database for facial expression, valence, and arousal computing in the wild. IEEE Transactions on Affective Computing. Vol. 10, pg. 18–31, 2019, https://doi.org/10.1109/TAFFC.2017.2740923. [↩] [↩] [↩]
- N. C. Ebner, M. Riediger, U. Lindenberger. FACES—a database of facial expressions in young, middle-aged, and older women and men: development and validation. Behavior Research Methods. Vol. 42, pg. 351–362, 2010, https://doi.org/10.3758/BRM.42.1.351. [↩] [↩] [↩] [↩] [↩] [↩] [↩] [↩] [↩]
- F. X. Gaya-Morey, J. M. Buades-Rubio, P. Palanque, R. Lacuesta, C. Manresa-Yee. Deep learning-based facial expression recognition for the elderly: a systematic review. Expert Systems with Applications. Vol. 326, pg. 132709, 2026, https://doi.org/10.1016/j.eswa.2026.132709. [↩] [↩] [↩]
- G. Guo, R. Guo, X. Li. Facial expression recognition influenced by human aging. IEEE Transactions on Affective Computing. Vol. 4, pg. 291–298, 2013, https://doi.org/10.1109/T-AFFC.2013.13. [↩] [↩] [↩]
- M. Fölster, U. Hess, K. Werheid. Facial age affects emotional expression decoding. Frontiers in Psychology. Vol. 5, pg. 30, 2014, https://doi.org/10.3389/fpsyg.2014.00030. [↩] [↩]
- S. N. Grondhuis, A. Jimmy, C. Teague, N. M. Brunet. Having difficulties reading the facial expression of older individuals? blame it on the facial muscles, not the wrinkles. Frontiers in Psychology. Vol. 12, pg. 620768, 2021, https://doi.org/10.3389/fpsyg.2021.620768. [↩] [↩] [↩]
- C. Tanikawa, S. Takata, R. Takano, H. Yamanami, Z. Edlira, K. Takada. Functional decline in facial expression generation in older women: a cross-sectional study using three-dimensional morphometry. PLOS ONE. Vol. 14, pg. e0219451, 2019, https://doi.org/10.1371/journal.pone.0219451. [↩] [↩]
- H. Park, Y. Shin, K. Song, C. Yun, D. Jang. Facial emotion recognition analysis based on age-biased data. Applied Sciences. Vol. 12, pg. 7992, 2022, https://doi.org/10.3390/app12167992. [↩] [↩]
- K. Kotwal, S. Marcel. Review of demographic fairness in face recognition. IEEE Transactions on Biometrics, Behavior, and Identity Science (Early Access). 2025, https://doi.org/10.1109/TBIOM.2025.3601217. [↩]
- G. Hu, E. Papadopoulou, D. Kollias, P. Tzouveli, J. Wei, X. Yang. Bridging the gap: protocol towards fair and consistent affect analysis. arXiv preprint arXiv:2405.06841, 2024, https://doi.org/10.48550/arXiv.2405.06841. [↩]
- S. Stoychev, H. Gunes. The effect of model compression on fairness in facial expression recognition. arXiv preprint arXiv:2201.01709, 2022, https://doi.org/10.48550/arXiv.2201.01709. [↩]
- F. X. Gaya-Morey, J. Sanchez-Perez, C. Manresa-Yee, J. M. Buades-Rubio. Bridging the gap in FER: addressing age bias in deep learning. arXiv preprint arXiv:2507.07638, 2025, https://doi.org/10.48550/arXiv.2507.07638. [↩]
- S. Wang, S. Wu, Z. Gao, Q. Ji. Facial expression recognition through modeling age-related spatial patterns. Multimedia Tools and Applications. Vol. 75, pg. 3937–3954, 2016, https://doi.org/10.1007/s11042-015-3107-2. [↩] [↩]
- N. Al-Garaawi, T. Morris, T. F. Cootes. Fully automated age-weighted expression classification using real and apparent age. Pattern Analysis and Applications. Vol. 25, pg. 451–466, 2022, https://doi.org/10.1007/s10044-021-01044-1. [↩]
- T. Ganel, C. Sofer, M. A. Goodale. Biases in human perception of facial age are present and more exaggerated in current AI technology. Scientific Reports. Vol. 12, pg. 22519, 2022, https://doi.org/10.1038/s41598-022-27009-w. [↩]
- I. Dominguez-Catena, D. Paternain, M. Galar. Metrics for dataset demographic bias: a case study on facial expression recognition. IEEE Transactions on Pattern Analysis and Machine Intelligence. Vol. 46, pg. 5209–5226, 2024, https://doi.org/10.1109/TPAMI.2024.3361979. [↩] [↩]
- J. Park, S.-B. Cho. Age-unbiased facial emotion recognition with regularizing self-attention value vector. Intelligent Data Engineering and Automated Learning – IDEAL 2024, Lecture Notes in Computer Science. Vol. 15346, pg. 472–480, 2025, https://doi.org/10.1007/978-3-031-77731-8_42. [↩] [↩]
- Y. Huang, J. Peng, Z. Cai, J. Guo, G. Chen, S. Tan. Facial expression recognition with age-group expression feature learning. 2024 International Joint Conference on Neural Networks (IJCNN). pg. 1–8, 2024, https://doi.org/10.1109/IJCNN60899.2024.10649944. [↩]
- C. Wang, L. Chen, L. Wang, Z. Li, X. Lv. QCS: feature refining from quadruplet cross similarity for facial expression recognition. Proceedings of the AAAI Conference on Artificial Intelligence. Vol. 39, pg. 7563–7572, 2025, https://doi.org/10.1609/aaai.v39i7.32814. [↩] [↩]
- Y. Guo, L. Zhang, Y. Hu, X. He, J. Gao. MS-Celeb-1M: a dataset and benchmark for large-scale face recognition. Computer Vision – ECCV 2016. pg. 87–102, 2016, https://doi.org/10.1007/978-3-319-46487-9_6. [↩] [↩]
- J. Mao, R. Xu, X. Yin, Y. Chang, B. Nie, A. Huang, Y. Wang. POSTER++: a simpler and stronger facial expression recognition network. Pattern Recognition. Vol. 157, pg. 110951, 2025, https://doi.org/10.1016/j.patcog.2024.110951. [↩] [↩]
- J. Lee, Y. Choi, H. Kim, I.-J. Kim, G. P. Nam. Navigating label ambiguity for facial expression recognition in the wild. Proceedings of the AAAI Conference on Artificial Intelligence. Vol. 39, pg. 4517–4525, 2025, https://doi.org/10.1609/aaai.v39i4.32476. [↩] [↩]
- S. Li, W. Deng, J. Du. Reliable crowdsourcing and deep locality-preserving learning for expression recognition in the wild. Proceedings of the IEEE Conference on Computer Vision and Pattern Recognition. pg. 2852–2861, 2017, https://doi.org/10.1109/CVPR.2017.277. [↩] [↩] [↩] [↩] [↩]
- C. Guo, G. Pleiss, Y. Sun, K. Q. Weinberger. On calibration of modern neural networks. Proceedings of the 34th International Conference on Machine Learning. pg. 1321–1330, 2017, https://proceedings.mlr.press/v70/guo17a.html. [↩]
- A. Bulat, G. Tzimiropoulos. How far are we from solving the 2D & 3D face alignment problem? (and a dataset of 230,000 3D facial landmarks). Proceedings of the IEEE International Conference on Computer Vision. pg. 1021–1030, 2017, https://doi.org/10.1109/ICCV.2017.116. [↩]
- S. Holm. A simple sequentially rejective multiple test procedure. Scandinavian Journal of Statistics. Vol. 6, pg. 65–70, 1979, https://www.jstor.org/stable/4615733. [↩]
- T. Xu, J. White, S. Kalkan, H. Gunes. Investigating bias and fairness in facial expression recognition. Computer Vision – ECCV 2020 Workshops. pg. 506–523, 2020, https://doi.org/10.1007/978-3-030-65414-6_35. [↩]
- A. Dutta, P. Singh, R. Naskar, R. S. Chakraborty. Bias quantification across demographic, visual-condition, and generalization axes in facial emotion recognition datasets. Scientific Reports. Article in press, 2026, https://doi.org/10.1038/s41598-026-69732-8. [↩]
- S. R. Jannat, S. Canavan. Expression recognition across age. 2021 16th IEEE International Conference on Automatic Face and Gesture Recognition (FG 2021). pg. 1–5, 2021, https://doi.org/10.1109/FG52635.2021.9667062. [↩]
- C. Palmero, M. de Velasco, M. A. Hmani, A. Mtibaa, L. B. Letaifa, P. Buch-Cardona, R. Justo, T. Amorese, E. González-Fraile, B. Fernández-Ruanova, J. Tenorio-Laranga, A. T. Johansen, M. R. da Silva, L. J. Martinussen, M. S. Korsnes, G. Cordasco, A. Esposito, M. A. El-Yacoubi, D. Petrovska-Delacrétaz, M. I. Torres, S. Escalera. Exploring emotion expression recognition in older adults interacting with a virtual coach. IEEE Transactions on Affective Computing. Vol. 16, pg. 2303–2320, 2025, https://doi.org/10.1109/TAFFC.2025.3558141. [↩]