Abstract
Urinary tract infections are among the most common bacterial infections. A urine culture, the standard diagnostic test, takes 2 to 3 days, which delays treatment and increases the risk of complications. This proof-of-concept study combined digital microscopy with a computer vision model to count microcolonies, distinguish bacterial isolates and detect antibiotic growth inhibition within 6 to 12 hours. Three bacteria isolates, Escherichia coli, Bacillus flexus and Staphylococcus haemolyticus, were spiked into sterile urine, serially diluted, then spotted onto agar. A YOLOv8s model was trained on 4,505 microcolonies annotated across 127 digital microscope images. Using three-fold leave-one-plate-out cross-validation, the mean average precision (mAP@0.5) on held-out plates was 85.1%. Predicted microcolony counts were overcounted compared to manual counts by 8.7% for B. flexus and 6.3% for E. coli and undercounted by 1.7% for S. haemolyticus. Recall was calculated to be 94.1% for B. flexus, 92.3% for S. haemolyticus and 71.7% for E. coli, with respective precisions of 60.9%, 93.1% and 86.8%. In a preliminary growth inhibition assay, microcolony counts in spots 9 mm from a 30 µg cefalotin disc were near zero for B. flexus and S. haemolyticus but much higher for E. coli. These findings show that a computer vision model can count microcolonies, discriminate between three isolates, and detect antibiotic growth inhibition within hours using inexpensive equipment. Further studies are required before clinical implementation, including validation against plate counts and reference susceptibility methods, and testing multiple clinical isolates per species as well as patient specimens.
Keywords: urinary tract infections, machine learning, artificial intelligence, antibiotics, bacteria, microcolonies, object detection
Introduction
Urinary tract infections (UTI) are one of the most common bacterial infections. UTIs affect the urinary tract system, including the bladder, urethra, ureters, and kidneys1. Diagnosis of UTIs typically requires a urine culture, where a urine sample is collected, transported to a microbiology laboratory, and then inoculated onto nutrient agar plates. The plates are then incubated for 24-48 hours2, allowing bacterial colonies to grow to a size visible to the naked eye. Following incubation, the number of bacterial colonies on the plate is counted. In the DUTY study, Hay et al. used ≥10⁵ CFU/mL as the reference standard for UTI in young children3. However, it was noted that other thresholds may be more appropriate depending on the method of urine collection and the predominant organism3.
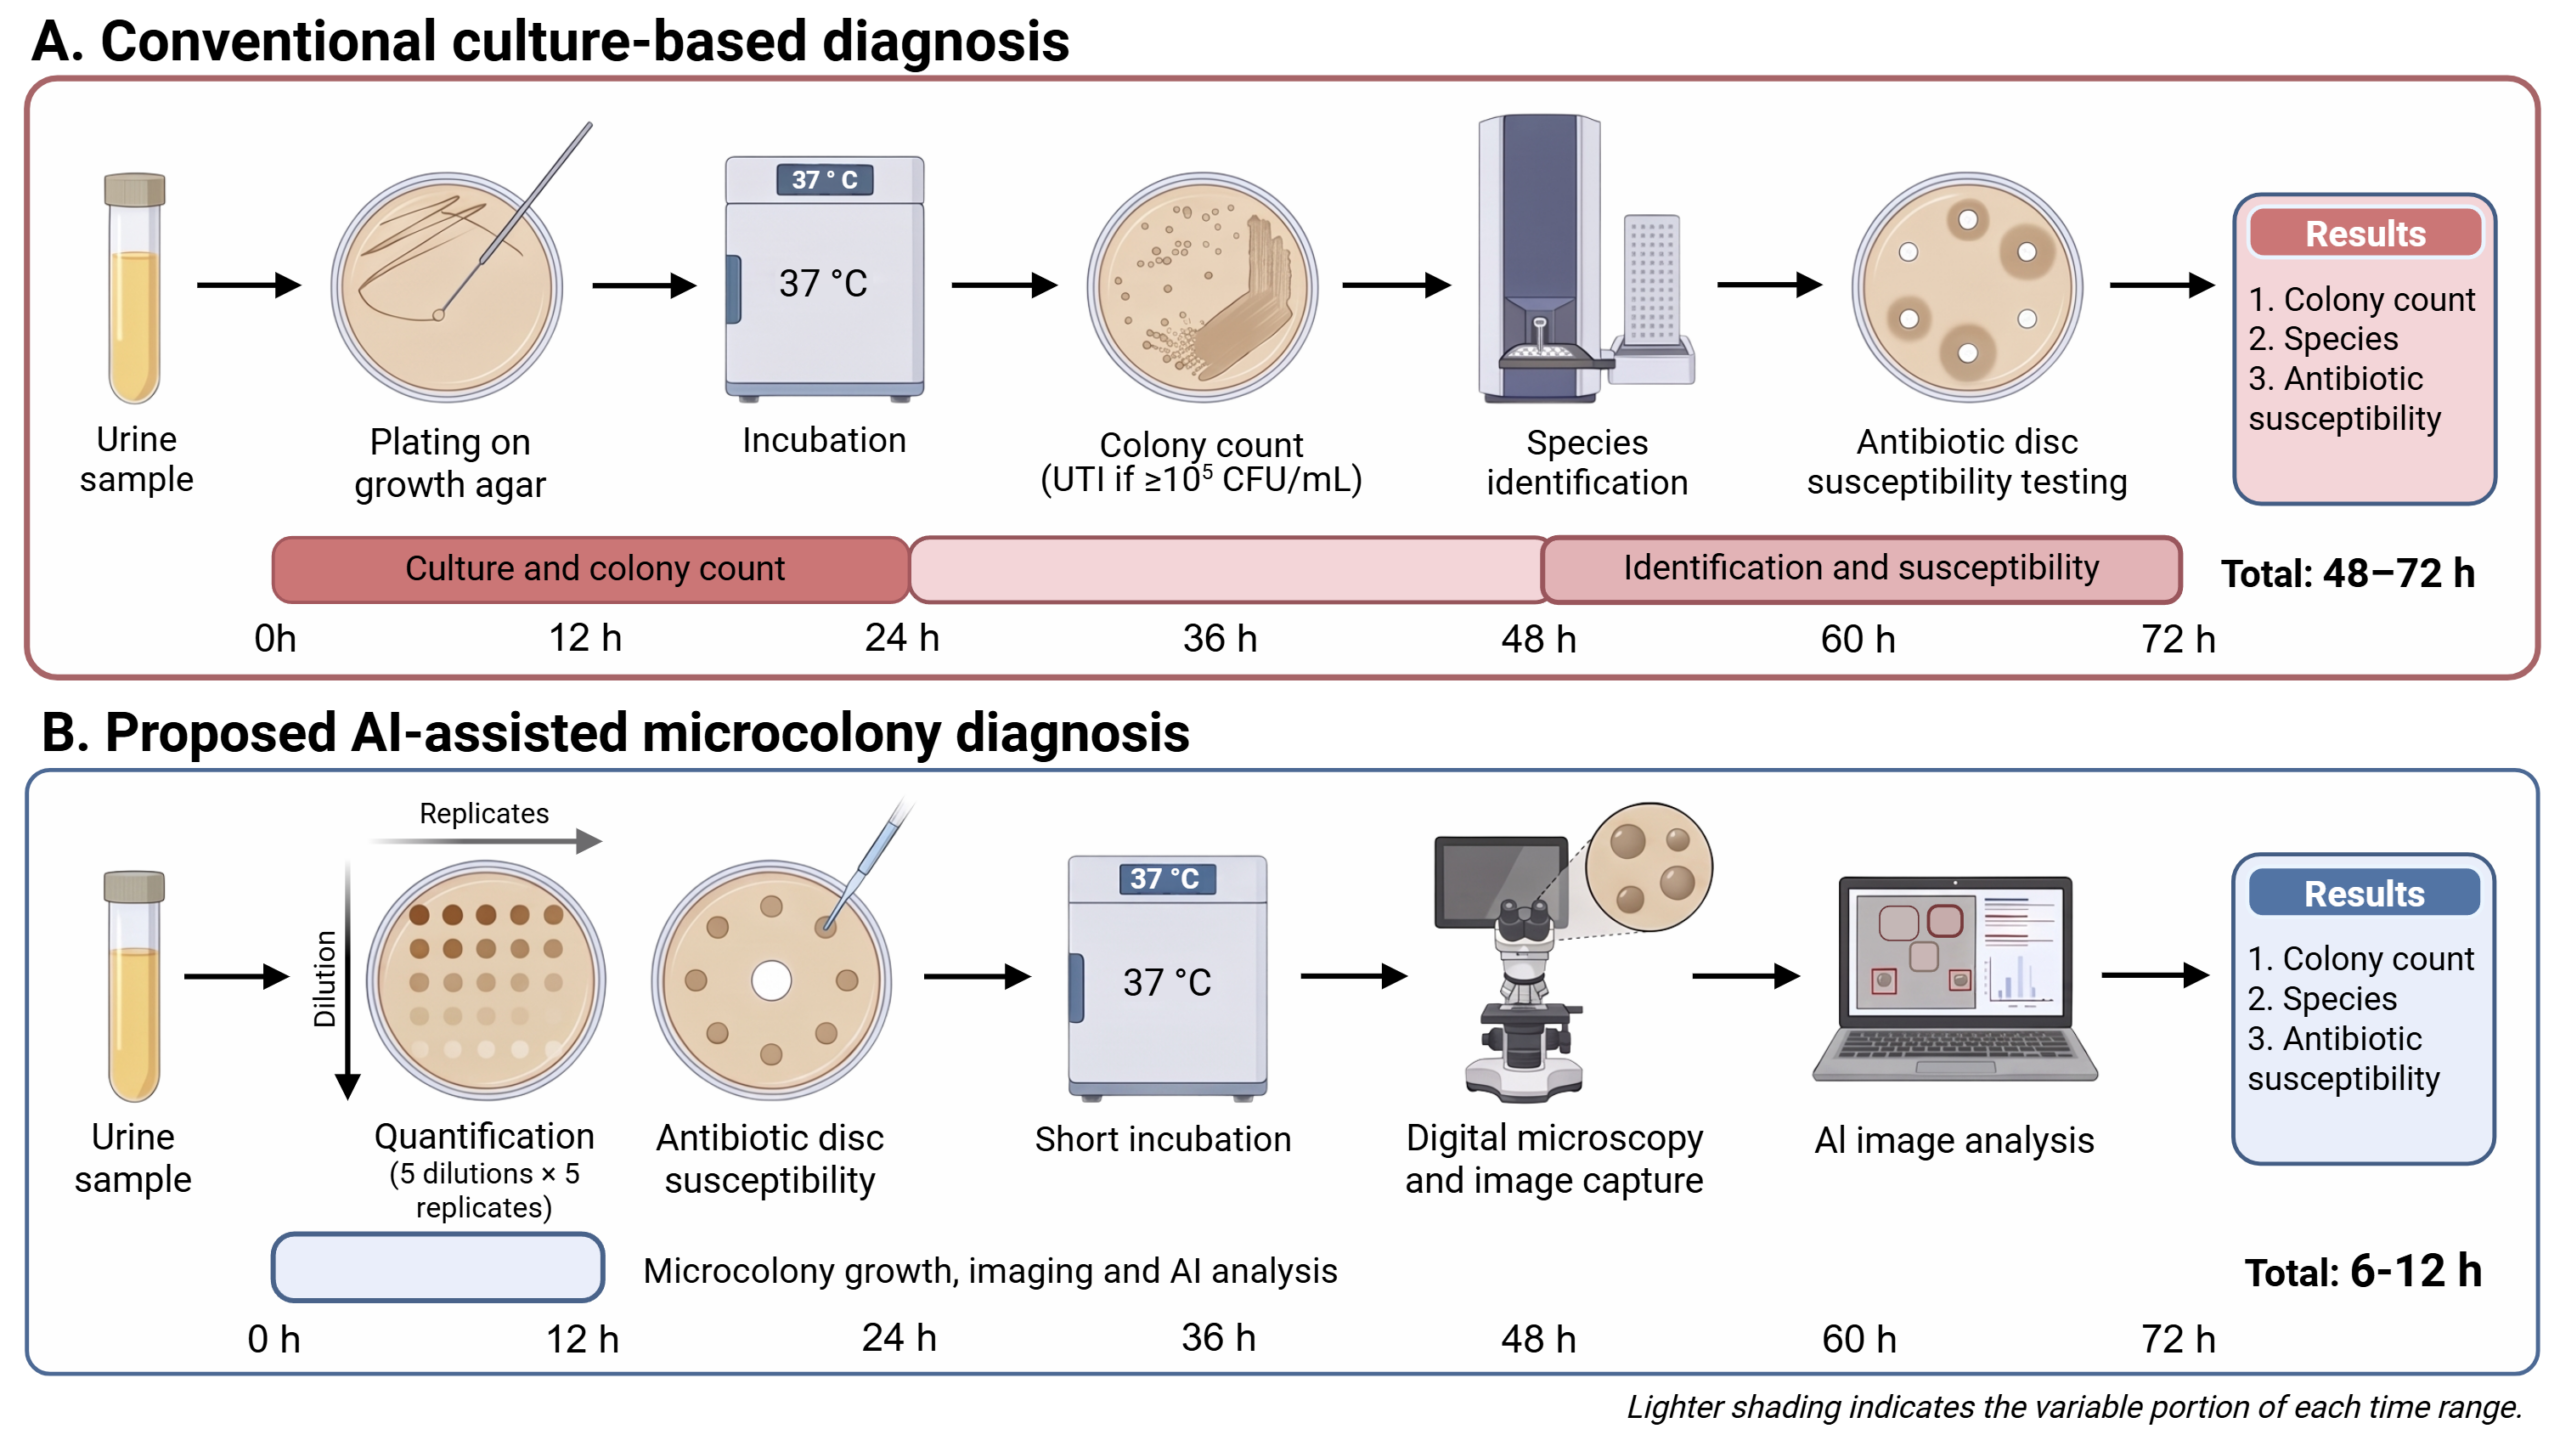
Following confirmation of a UTI, specialized laboratory equipment, such as mass spectrometry or biochemical testing, is required to determine the bacterial species and its antibiotic sensitivity, which are needed to guide antibiotic treatment4. As a result, the complete diagnostic process from urine collection to treatment guidance can require 2-3 days (Figure 1A). This delay may postpone the initiation of appropriate antibiotic treatment and increase the risk of complications, particularly in immunocompromised patients5. Furthermore, access to microbiology laboratories and expensive equipment may be limited in resource-constrained communities, resulting in additional delays in diagnosis and treatment6.
Automated analysis of UTI culture plates has a substantial prior literature7. Image processing has been used to count colonies from photographs of plates8, and convolutional neural networks have been developed to improve colony counting on denser plates7. Deep learning neural networks have been trained to classify organisms from whole urine culture plates across 32 organisms causing infections9. These functions have been built into automated commercial laboratory equipment, such as the Copan WASPLab and APAS Independence10,11. These tools read colonies after at least 16 to 18 hours of incubation and require complex equipment12,13. Earlier analysis has been achieved using elastic light scattering14, deep learning analysis on time-lapse holographic images after 6 hours of incubation15, and deep learning analysis on lens-free microscopy in 8 hours16. However, all three methods require specialized optics. Image analysis has also been used to accelerate antibiotic susceptibility testing using single-cell morphology17, single-cell growth in microfluidic traps18, real-time optical monitoring19, and Gram stain classification20. No prior study has combined microcolony counting, discrimination between organisms and detection of antibiotic growth inhibition using a one agar plate workflow, a consumer digital microscope and a computer vision model.
In this study, a computer vision model was developed to count microcolonies, distinguish bacterial isolates and detect antibiotic growth inhibition in spiked sterile urine within 6 to 12 hours. By using microscopy, the time required for bacteria to grow to detectable levels can be reduced. Furthermore, computer vision image analysis provides an automated approach for bacterial colony detection and classification without requiring access to specialized laboratory equipment.
Here, urine samples are inoculated onto nutrient agar plates and incubated at 37°C. Following 6 to 12 hours of incubation, bacterial microcolonies are visualized using a digital microscope. Images of these microcolonies are captured and analyzed using an artificial intelligence (AI) image recognition model. The number of microcolonies is counted, and colonies are predicted as one of three bacterial isolates based on microcolony morphology. In addition, growth inhibition can be assessed by culturing bacteria adjacent to antibiotic discs.
Through the integration of microscopy and AI, this approach can reduce the time and resources required for preliminary microbiological assessment. By enabling earlier detection of bacterial growth and assessment of antibiotic response, the delay to initiation of appropriate treatment can be decreased, lowering the risk of complications. Additionally, since this approach only requires a digital microscope, computer, and basic laboratory equipment, it could be implemented in remote and resource-limited regions where access to microbiology laboratories and expensive laboratory equipment is restricted.
Methods
Bacterial Isolates
Three bacterial isolates were recovered from a single human fecal sample and designated F-EC1, F-BF1, and F-SH1, identified by MALDI-TOF mass spectrometry as Escherichia coli, a Gram-negative rod and the most common cause of UTIs1; Bacillus flexus, a Gram-positive rod; and Staphylococcus haemolyticus, a Gram-positive coccus. Although B. flexus and S. haemolyticus are uncommon causes of UTI1,21, theywere used because they were available for testing and, together with E. coli, represent distinct Gram-stain and cell-shape categories.
MALDI-TOF mass spectrometry was performed in a hospital clinical microbiology laboratory. One isolate per organism was used throughout, so each class in the model is represented by a single genetic background. Isolates are referred to by their designations (F-EC1, F-BF1, and F-SH1) where the distinction between a specific isolate and the species matters.
Growth and Imaging of Bacterial Microcolonies
Overnight cultures of each isolate were serially diluted 10-fold (10⁻¹ to 10⁻⁵) in autoclaved urine, and five replicate 5 µL drops of each dilution were spotted onto LB agar plates. Plates were incubated at 37 °C and imaged at 6, 8, 10 and 12 h with a digital microscope (Andonstar AD246S-M) at 50× magnification, which captured the entire area of each 5 µL spot. Microcolonies were counted in each image to select working conditions for each isolate. The target was a dilution giving a countable field in which individual colonies did not touch, and the earliest timepoint at which colony morphology was discernible. These criteria were met at 6 h for E. coli and 8 h for B. flexus and S. haemolyticus, at dilutions of 10⁻² and 10⁻³ for all three isolates. Under these conditions, 127 spot images were captured for model development. Microcolony counts were not converted to CFU/mL, since this method would assume that each viable cell forms one detectable microcolony within 6 to 8 h, which was not verified against plate counts.
Development of the AI Image Recognition Model
A computer vision model was developed using YOLOv8s, a single-stage anchor-free object detector implemented in the Ultralytics framework (version 8.4.166) with PyTorch 2.11.0 and CUDA 12.8 on an NVIDIA Tesla T4 GPU. The architecture comprises a CSPDarknet backbone with C2f blocks, a spatial pyramid pooling layer, a path-aggregation feature pyramid neck, and a decoupled detection head. This totaled 11,136,761 parameters at 28.6 GFLOPs. Training was initialized from COCO-pretrained weights22, with the detection head reinitialized for three classes.
The dataset consisted of 127 microscopy images, each capturing the 5 µL spot area and containing multiple microcolonies. Across these images, 4,505 individual microcolonies were manually annotated with bounding boxes: 902 for B. flexus, 1,707 for E. coli and 1,896 for S. haemolyticus. The annotation count reflects the number of distinct colonies counted in the images. Images were captured from three plates per organism. All three plates were streaked from the same overnight culture, meaning that there is one culture per organism.
Data were partitioned by plate using three-fold leave-one-plate-out cross-validation15. In each fold, two plates per organism were used for training and one was held out, giving 86, 85 and 83 training images and 41, 42 and 44 held-out images for folds 1, 2 and 3 respectively (Table 1). No separate validation partition was used. The framework’s per-epoch validation was run on the training images and was only used to monitor preliminary performance. Because the number of epochs was fixed in advance, early stopping was disabled and final-epoch weights were used for evaluation, no model selection was performed, and therefore the held-out images played no part in training or in any hyperparameter or checkpoint decision.
| Organism | Fold | Training | Testing | ||
| Images | Colonies | Images | Colonies | ||
| Bacillus flexus | Fold 1 | 15 | 744 | 6 | 158 |
| Fold 2 | 14 | 537 | 7 | 365 | |
| Fold 3 | 13 | 523 | 8 | 379 | |
| Dataset Total | 21 | 902 | |||
| Escherichia coli | Fold 1 | 42 | 834 | 21 | 873 |
| Fold 2 | 42 | 1,255 | 21 | 452 | |
| Fold 3 | 42 | 1,325 | 21 | 382 | |
| Dataset Total | 63 | 1,707 | |||
| Staphylococcus haemolyticus | Fold 1 | 29 | 861 | 14 | 1,035 |
| Fold 2 | 29 | 1,301 | 14 | 595 | |
| Fold 3 | 28 | 1,630 | 15 | 266 | |
| Dataset Total | 43 | 1,896 | |||
| All | 127 | 4,505 | |||
Models were trained at an input resolution of 640 × 640 pixels for a fixed 100 epochs with a batch size of 16, with no early stopping. The final-epoch weights were used for evaluation. The optimizer was AdamW, with a learning rate of 0.001429, momentum of 0.9, random seed 0 and weight decay of 0.0005, following a three-epoch warm-up. Augmentation was applied on the fly and used the Ultralytics defaults: mosaic at probability 1.0, disabled for the final 10 epochs, horizontal flip at 0.5, scaling at 0.5, translation at 0.1, HSV jitter of 0.015, 0.7 and 0.4, random erasing at 0.4, and blur, median blur, grayscale conversion and CLAHE each at probability 0.01.
Inference used a confidence threshold of 0.25 and a non-maximum suppression intersection-over-union threshold of 0.6 for colony counts and confusion matrices. Average precision and mAP were computed at a confidence threshold of 0.001 so that the full precision-recall curve was sampled. The trained weights for each fold are identified by the SHA-256 checksums in Table 2 and are available from the author on request.
| Fold | SHA-256 Checksums |
| Fold 1 | ebd6ef85edafb0216eec6d9f23524f5380e8a4ca00dcdf32405a385e7325caa8 |
| Fold 2 | 511c4ca6c1fcd6844e60cd52bf4f38b3ce87be30b088cee4f328814a9b01dc76 |
| Fold 3 | f6093efe9a485f9f90c6ed9e4e4498c18267eb2009c16123b943af01d50441d0 |
A Python program was created to interface with the trained model, enabling image acquisition from the digital microscope, automated microcolony counting, and assignment of each detected microcolony to one of the three isolates.
Antibiotic Growth Inhibition Testing
Antibiotic growth inhibition was assessed using commercial cefalotin (cephalothin) discs with a disc content of 30 µg (BD BBL Sensi-Disc). The test medium was LB agar, poured at 20-25 mL per 10 cm Petri dish to give an estimated depth of 3 mm. First, a single disc was placed on each plate. Then, 8 replicate 5 µL spots of the same dilution used for microcolony imaging for each isolate, prepared in autoclaved urine, were placed on the plate. Each spot was placed so that the nearest edge of the spot was 9 mm from the center of the disc, using a 3D printed template beneath the plate. With this placement, absence of growth within a spot indicates a zone of inhibition at least 18 mm in diameter. This distance was chosen to correspond to the Clinical and Laboratory Standards Institute (CLSI) susceptible breakpoint for the 30 µg cephalothin disc against Enterobacterales (zone diameter ≥18 mm). Control spots of the same dilution were placed on a separate LB agar plate without a disc. Inoculum density was not standardized by McFarland turbidity. Spots were prepared from the same dilution used for microcolony imaging, selected per isolate to give a sparse, countable field, and control spots on a disc-free plate confirmed comparable growth in the absence of antibiotic. Because microcolony counts at 6 to 8 hours have not been calibrated against colony-forming units, inoculum density is not reported in CFU/mL. Plates were incubated at 37 °C and imaged at 6 hours for E. coli and 8 hours for B. flexus and S. haemolyticus as described above, and microcolonies in disc-adjacent and control spots were counted using the AI model. No quality control strain was tested, so disc potency and test performance were not verified.
Ethics Statement
This study was conducted as an independent project without formal institutional affiliation. The fecal sample used to obtain the three bacterial isolates was provided voluntarily by a healthy adult household volunteer who was informed of the purpose of the study. No donor-identifying information and no health information were collected or recorded, and the sample was used solely to recover bacterial isolates. Because no institution had jurisdiction over this work, institutional research ethics approval was neither sought nor required, and no approval number exists. Apart from identification of the isolates, which was performed in a hospital clinical microbiology laboratory, all work was performed at a home laboratory, in a dedicated area separate from living and food preparation areas, under the direct supervision of an adult with laboratory safety training.
Results
Overall Accuracy of the AI Model
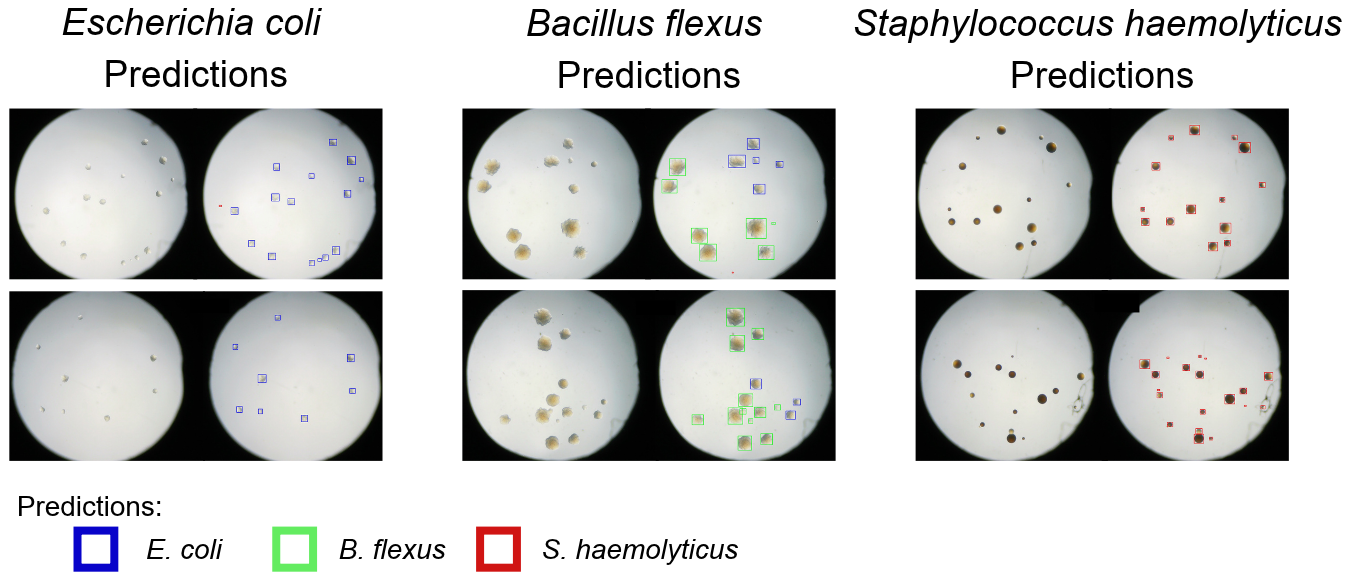
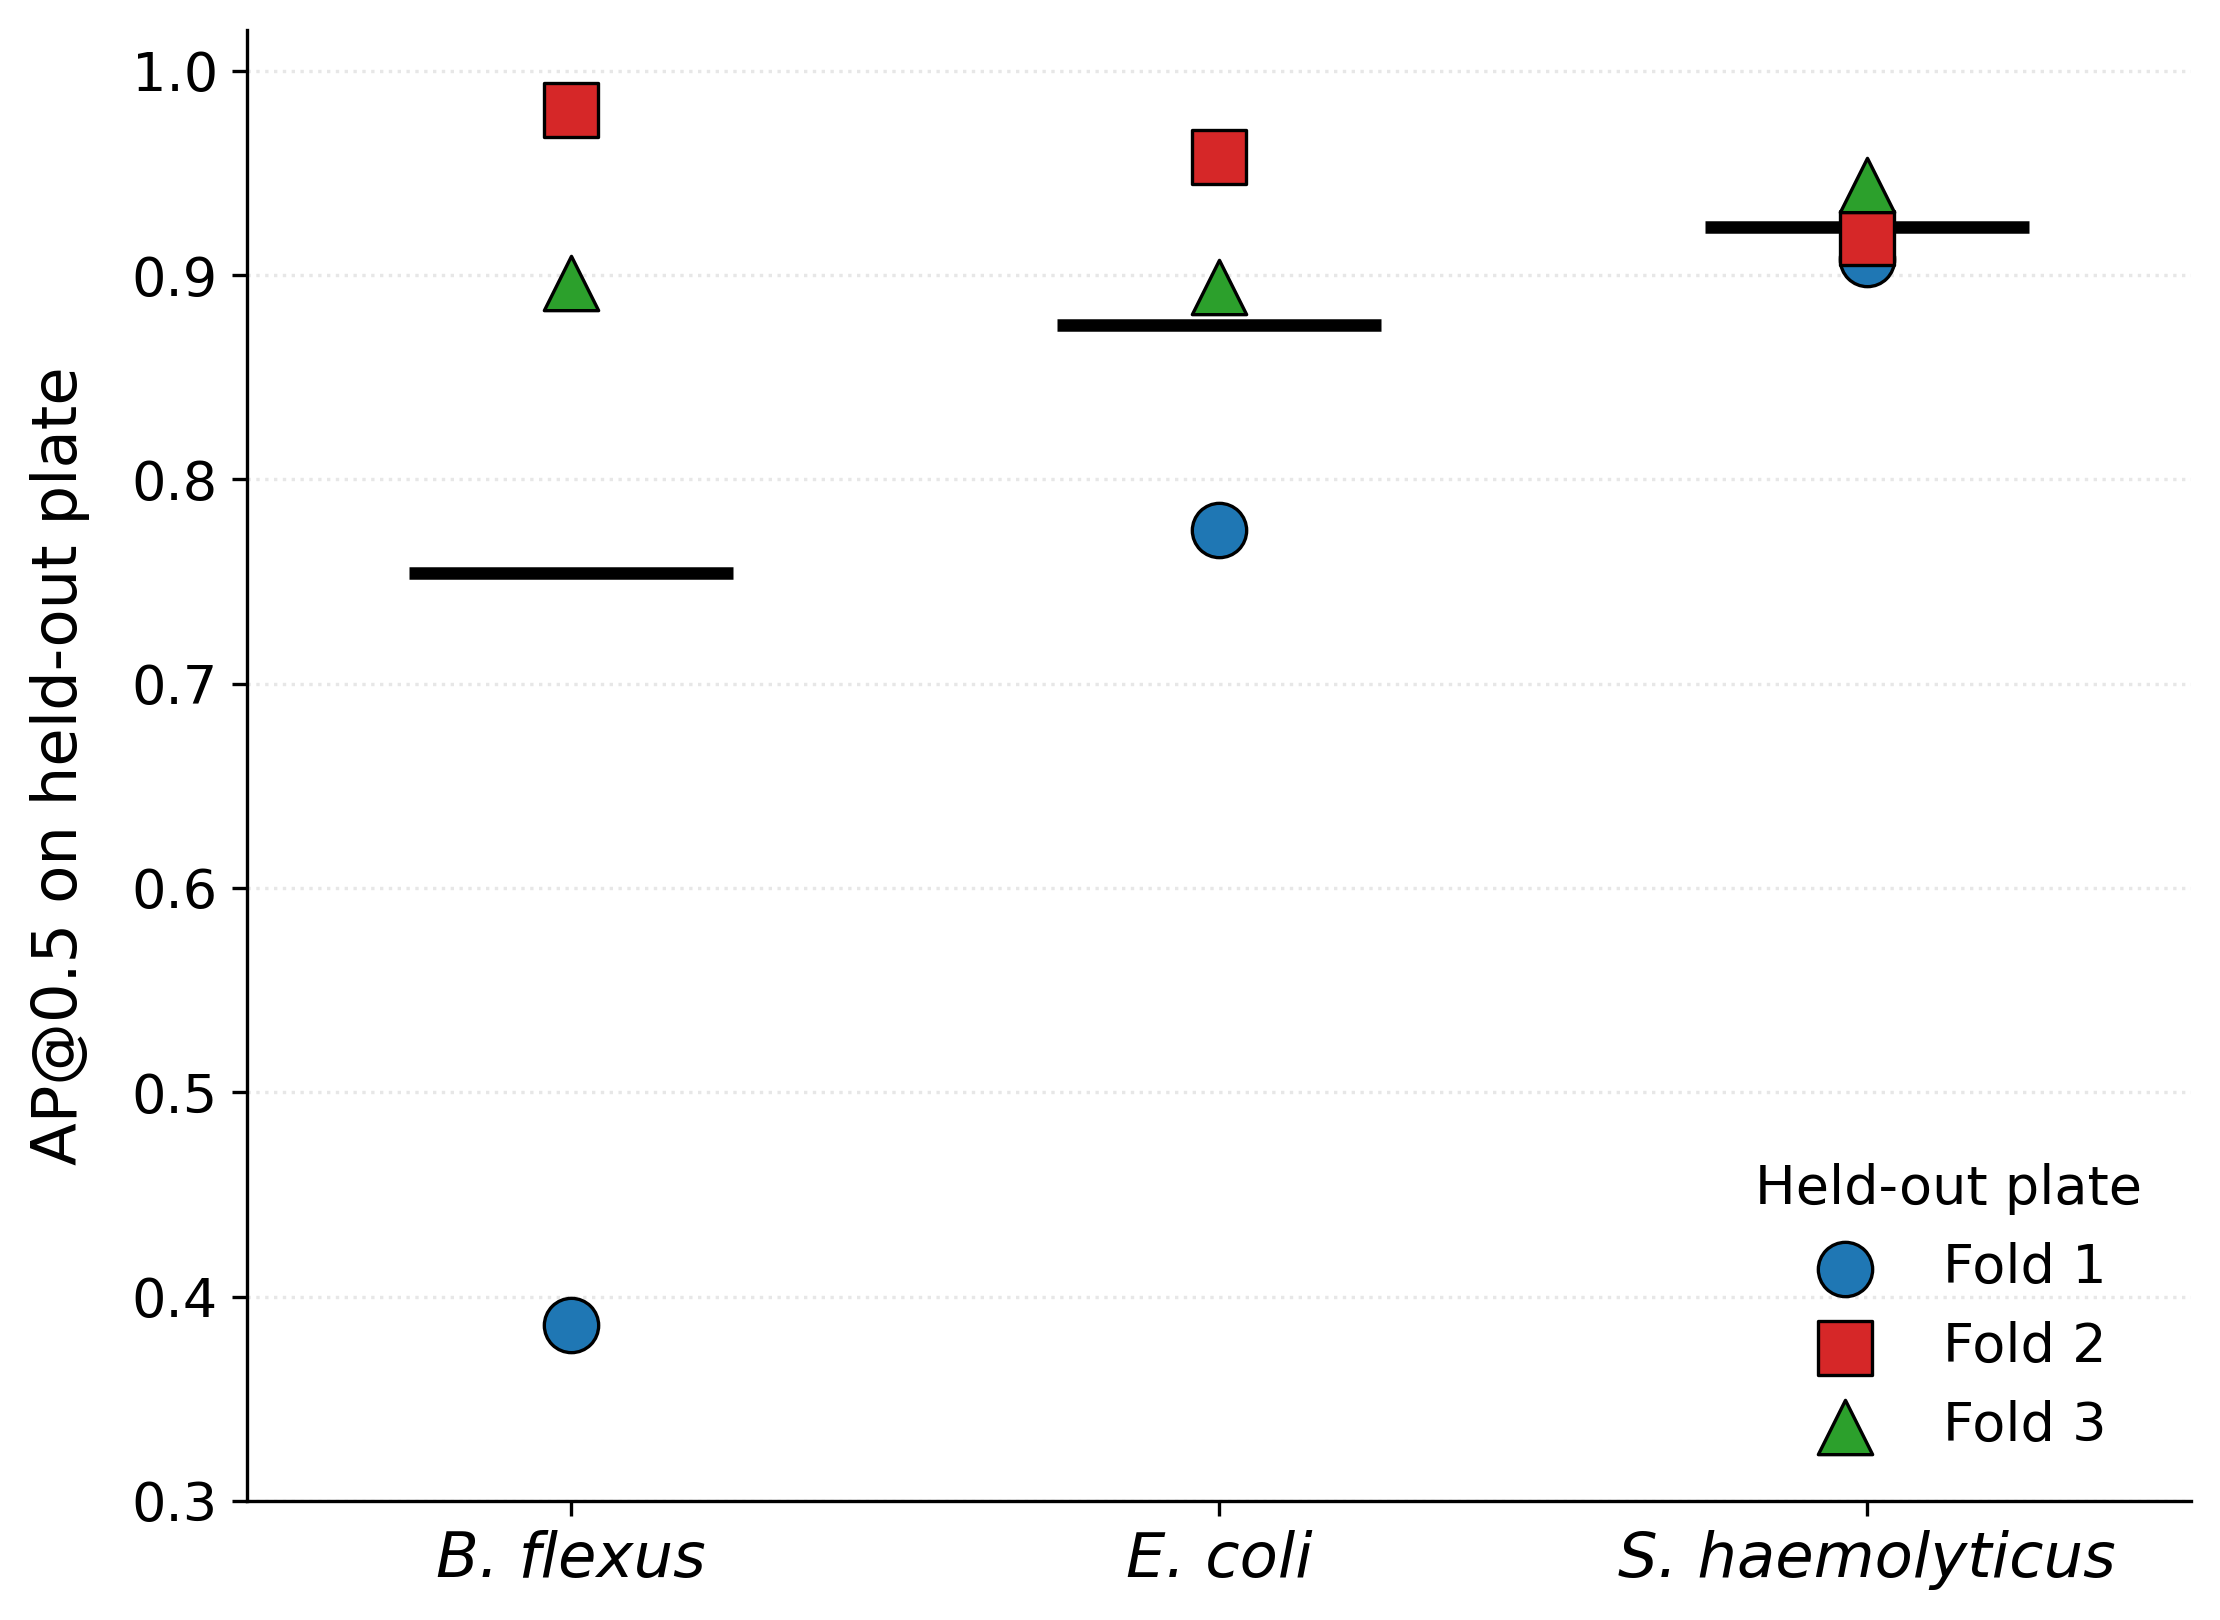
The performance of the AI image recognition model was evaluated on held-out plates using three-fold leave-one-plate-out cross-validation, in which each fold was tested on one plate per isolate that contributed no images to training (Figure 2). The mean average precision at an intersection-over-union threshold of 0.5 (mAP@0.5) was 85.1% averaged across the three folds, with individual folds ranging from 69.0% to 95.2% (Figure 3). The mAP represents the area under the precision-recall curve averaged across classes, with higher values indicating better detection and classification. Performance varied by isolate, with mean AP@0.5 of 92.3% for S. haemolyticus, 87.6% for E. coli and 75.5% for B. flexus. The spread across folds reflects variation between plates and imaging sessions, since the folds differed only in which plate was held out.
Accuracy of Microcolony Counting by the AI Model
The accuracy of microcolony counting was evaluated by comparing the number of colonies detected by the AI model with manually annotated ground truth counts. All images were scored by the model from the fold in which their plate was held out, so no image was counted by a model that had seen its plate, covering all 127 images in the dataset.
Ground truth counts are the manual bounding-box annotations used to train the model. The same person performed annotation and counting, so the comparison measures consistency between the model and a single annotator rather than agreement with an independent observer.
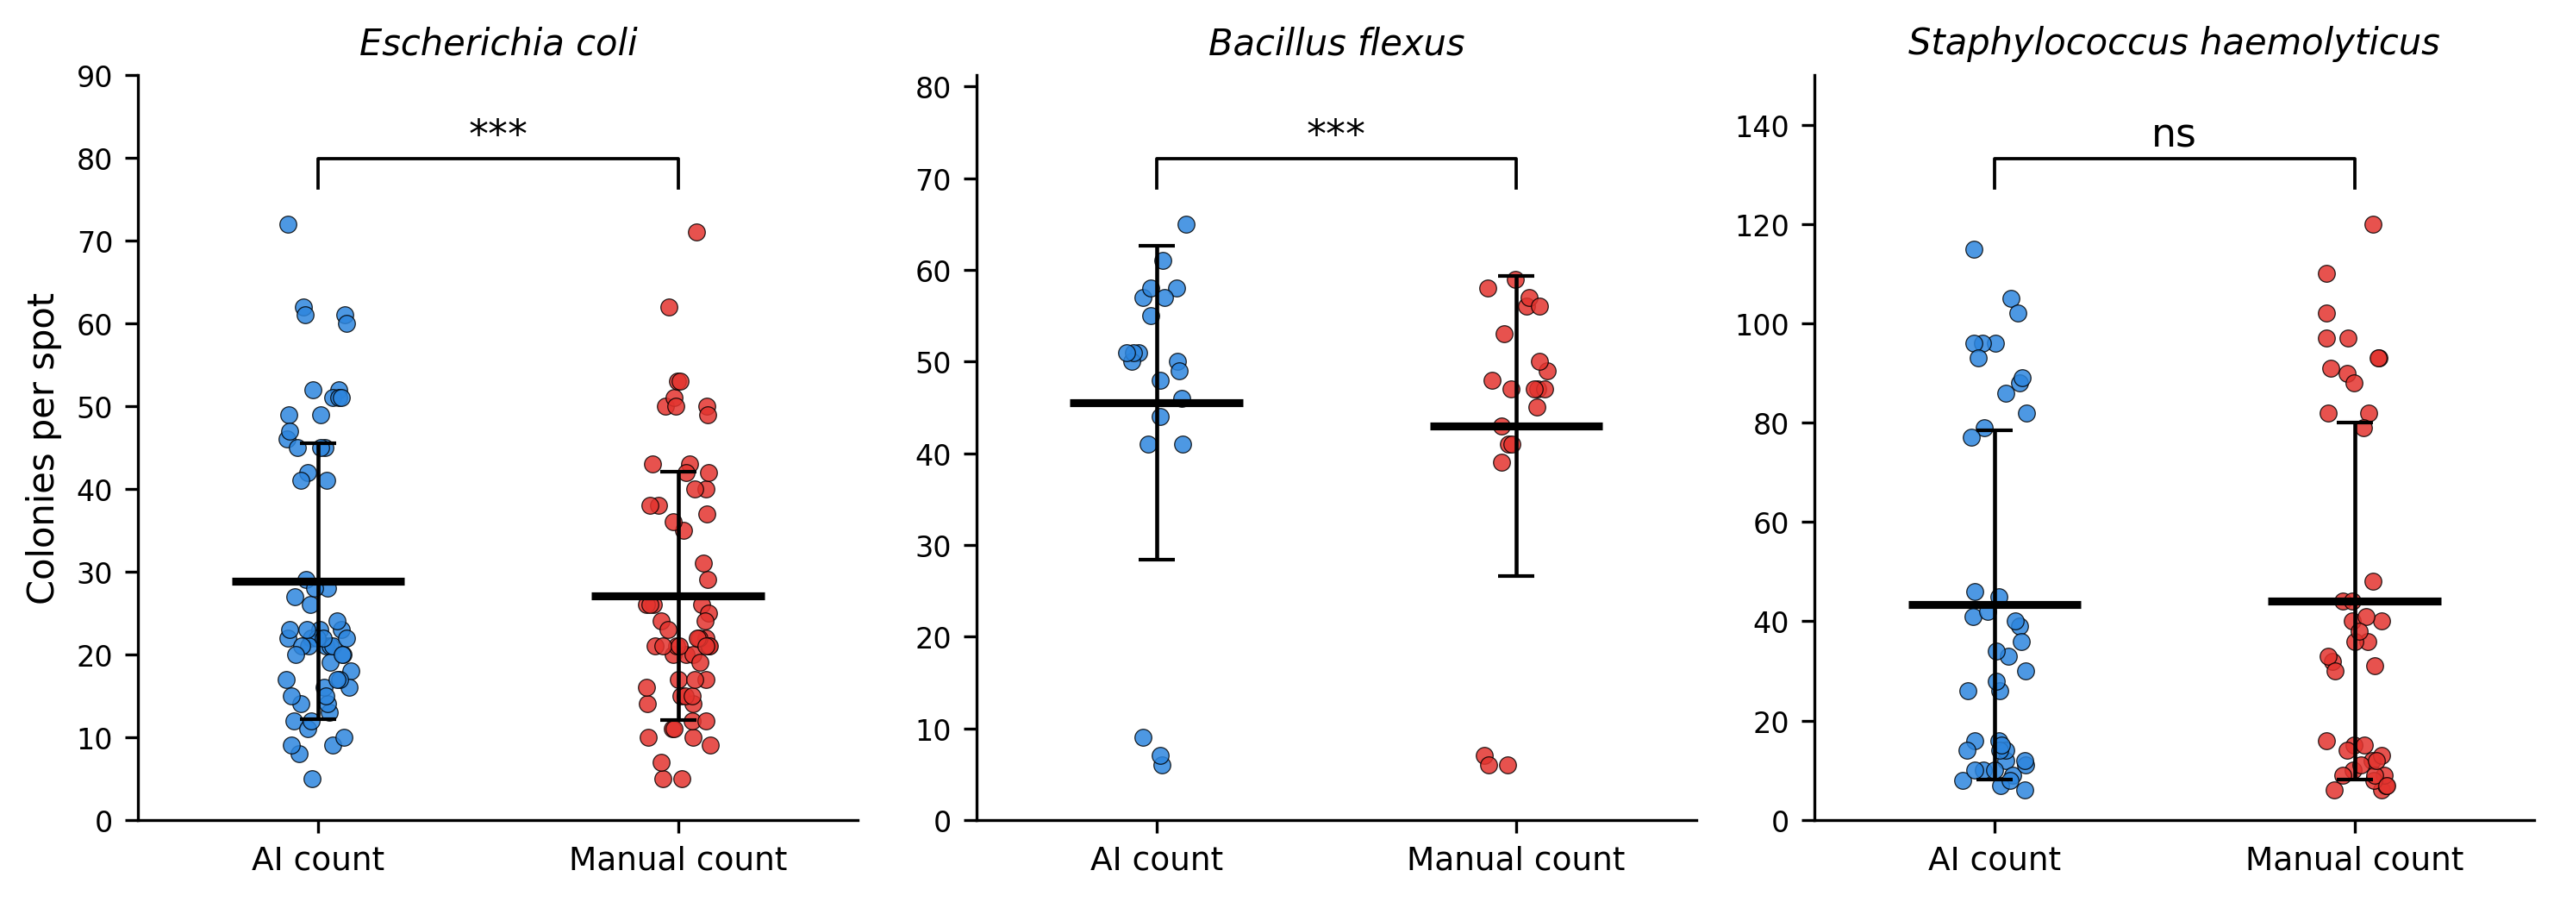
The AI model overcounted compared to manual annotation for two of the three organisms (Figure 4). For B. flexus the mean difference was 3.71 colonies per spot, 8.7% above the manual mean of 42.95, and for E. coli it was 1.70 colonies, 6.3% above the manual mean of 27.10. Both differences were significant by Wilcoxon signed-rank test. For S. haemolyticus the model undercounted slightly, by 0.74 colonies or 1.7% below the manual mean of 44.09, which was not significant by Wilcoxon signed-rank test. S. haemolyticus therefore showed the closest agreement.
Accuracy of Isolate Discrimination by the AI Model
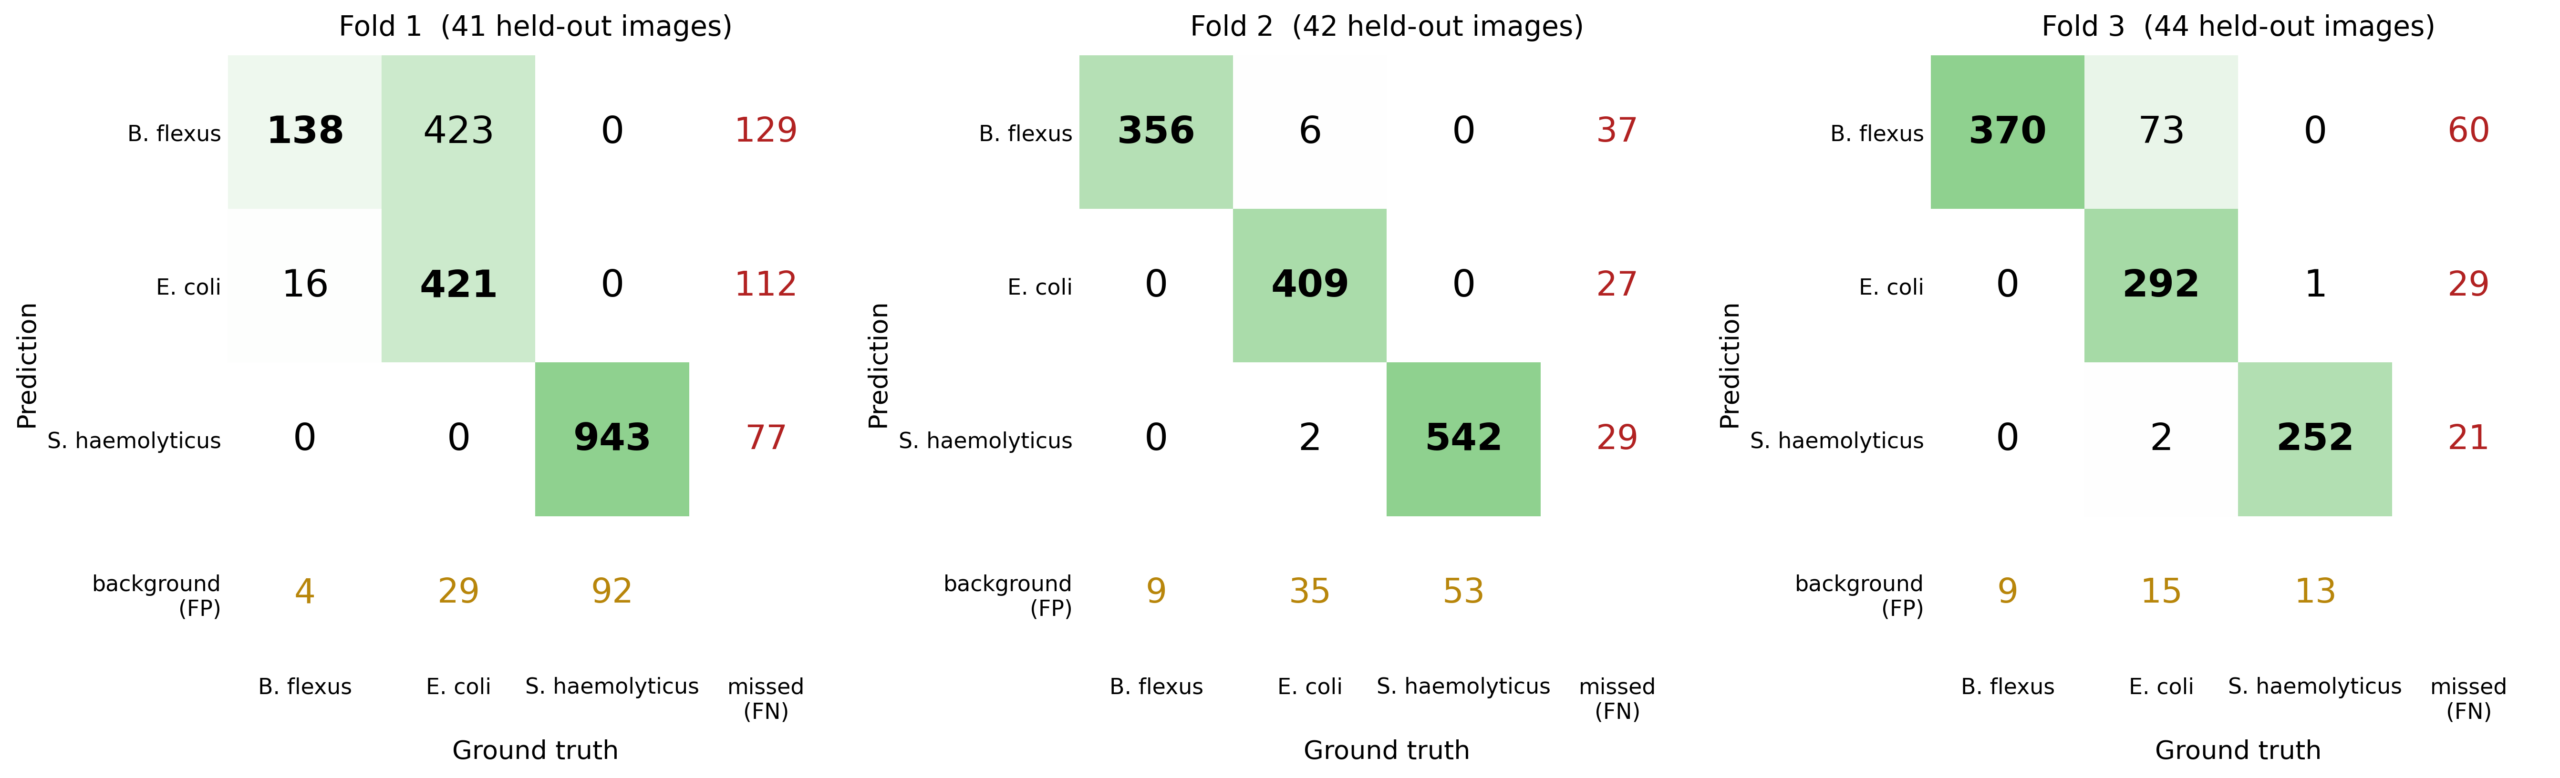
The ability of the AI model to distinguish between isolates was evaluated by categorizing detected microcolonies as true positives, misclassifications, missed colonies, or background, represented in a confusion matrix (Figure 5).
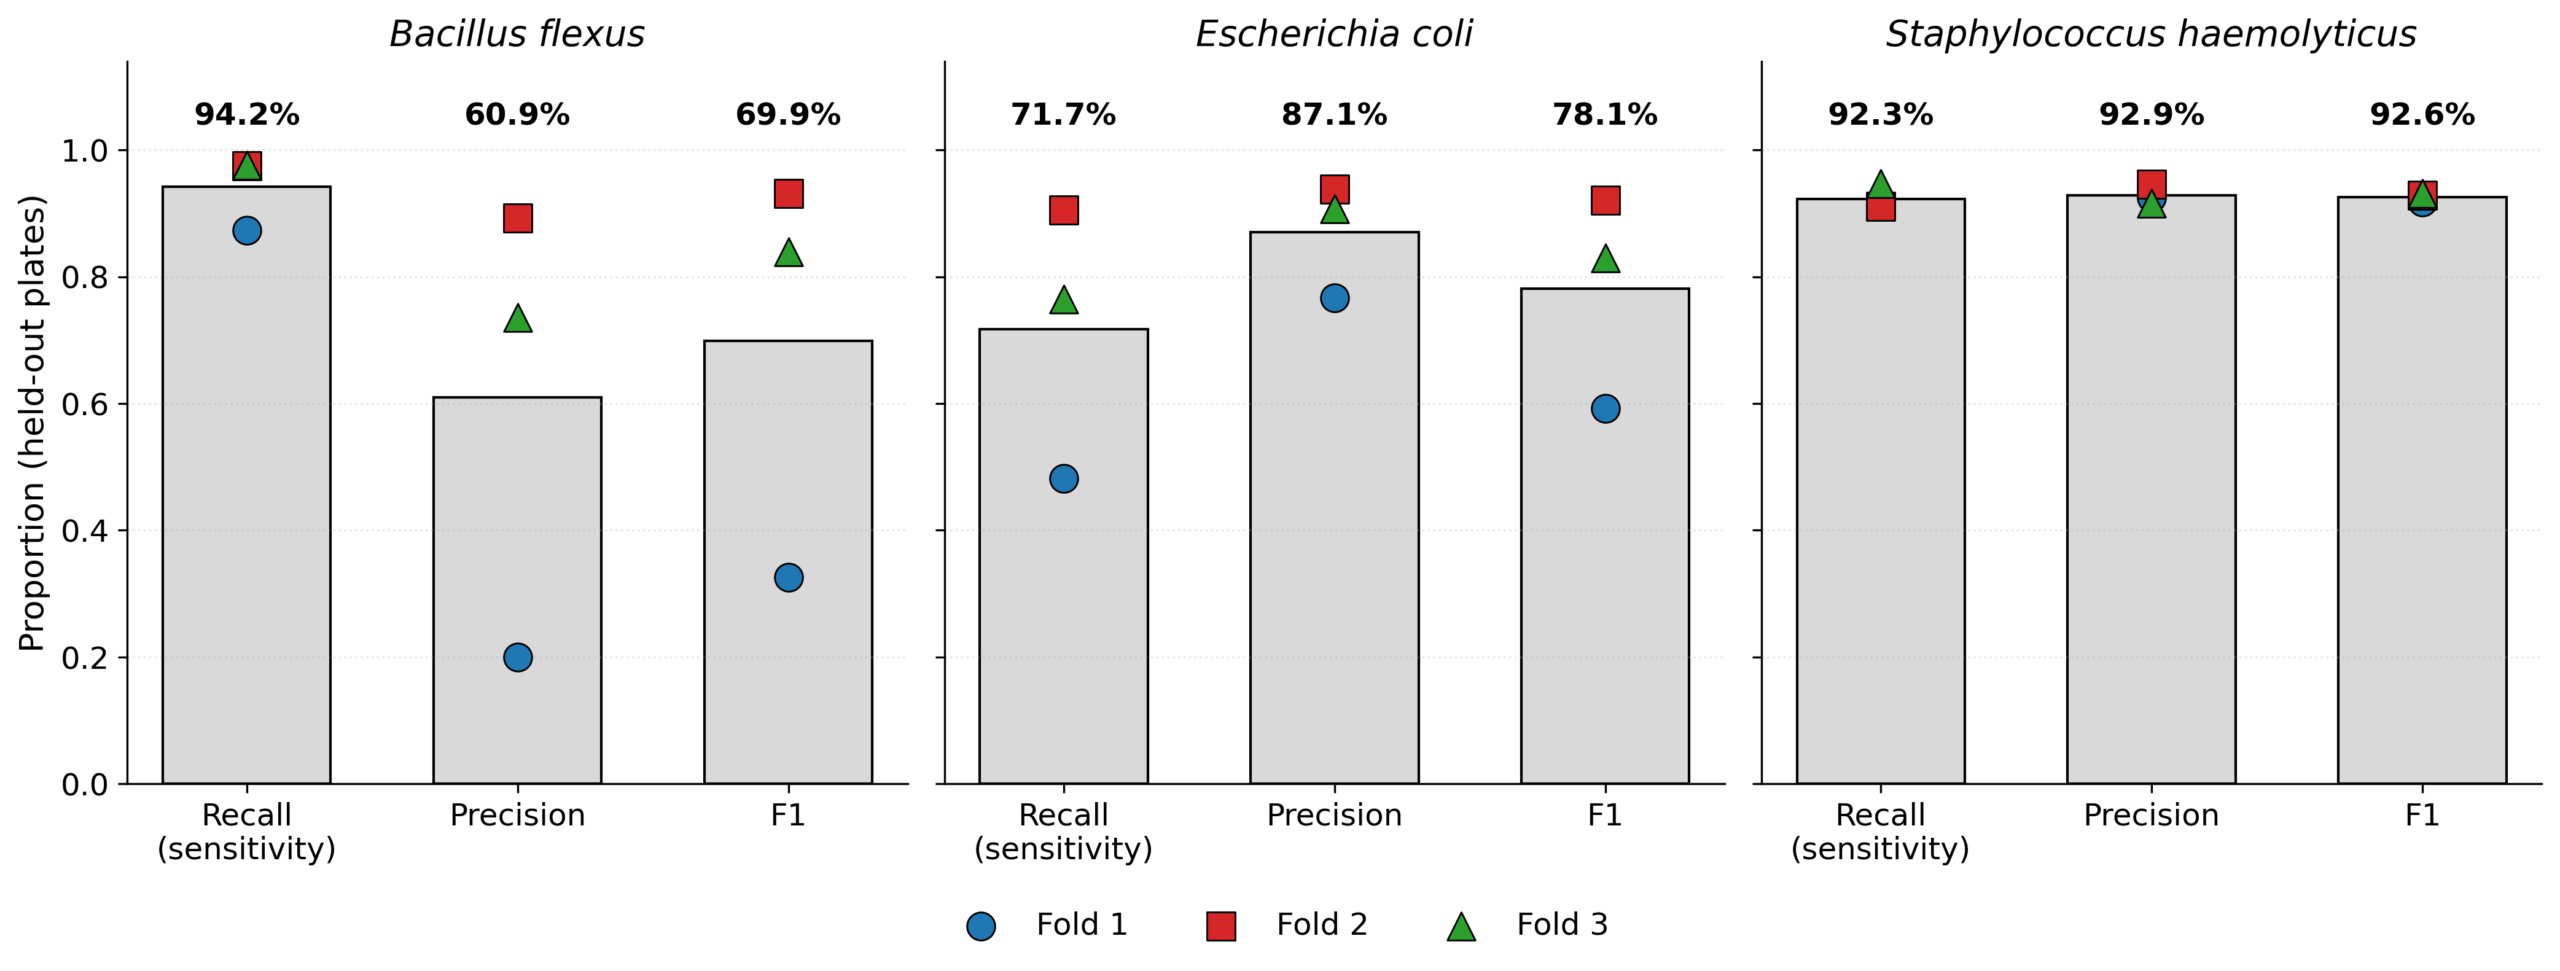
Classification performance was evaluated on held-out plates and computed from the confusion matrix counts at a confidence threshold of 0.25 and a non-maximum suppression intersection-over-union threshold of 0.6. Recall, also called sensitivity, is TP / (TP + FN) summed down the ground-truth column. Precision is TP / (TP + FP) summed across the prediction row and including background false positives.
Mean recall across the three folds was 94.1% for B. flexus, 92.3% for S. haemolyticus and 71.7% for E. coli. Mean precision was 93.1% for S. haemolyticus, 86.8% for E. coli and 60.9% for B. flexus (Figure 6). The spread across folds is substantial: B. flexus precision ranged from 20.0% in fold 1 to 89.2% in fold 2, and E. coli recall range from 48.2% to 90.5%, even though the folds differed only in which plate was held out.
Errors occurred almost entirely as E. coli being misclassified as B. flexus. This error was concentrated in fold 1, where 423 of 873 E. coli colonies were assigned to B. flexus, compared with 73 of 382 in fold 3 and 6 of 452 in fold 2. Misclassification in the opposite direction was more rare, affecting 16 colonies in fold 1 and none in the other two folds. S. haemolyticus separated cleanly from both other organisms in all folds.
Separating detection from classification clarifies where the error lies. Evaluated without considering isolate labels, the model detected colonies with precision of 0.926, 0.928 and 0.954 and recall of 0.916, 0.924 and 0.935 across the three folds. Detection was therefore accurate and consistent, and essentially all of the variability lies in assigning an isolate to a correctly detected colony. Background false positives averaged 4.2 per image (7.8, 2.2 and 2.5 by fold).
Antibiotic Growth Inhibition Testing
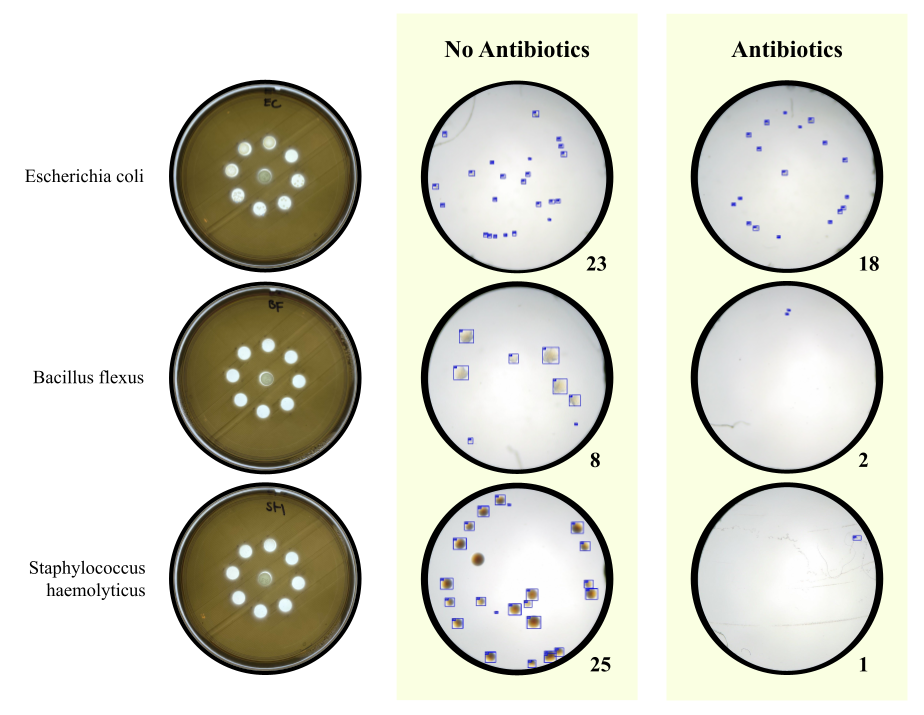
Antibiotic growth inhibition was assessed using cefalotin by comparing microcolony counts in disc-adjacent spots with counts in unexposed control spots, both measured by the AI model. For the E. coli isolate (F-EC1), microcolony counts in disc-adjacent spots were similar to those in control spots after 6 h of incubation (Figure 7), indicating that growth was not inhibited at a distance of 9 mm from the disc center. This corresponds to a zone of inhibition smaller than 18 mm in diameter, which would fall below the historical CLSI susceptible breakpoint (≥18 mm) for the 30 µg cefalotin disc against Enterobacterales. Because the test conditions were not standardized, this comparison is indicative only and does not represent a formal susceptibility categorization. In contrast, counts for the B. flexus (F-BF1) and S. haemolyticus (F-SH1) isolates fell to near zero, consistent with a zone of inhibition of at least 18 mm. Cefalotin zone diameter breakpoints are not defined for Bacillus or Staphylococcus species, so these results are reported as growth inhibition only and do not establish clinical susceptibility.
Discussion
This study shows that a computer vision model can detect bacterial microcolonies and distinguish between three isolates at 6 to 12 hours of growth, before colonies are visible to the naked eye. Conventional culture needs 24 to 48 hours to reach a countable colony size2. On held-out plates, the model detected colonies with a mean precision of 0.936 and recall of 0.925, and reached a mean average precision at 0.5 of 85.1%.
These results can be compared to prior studies of microcolony and plate reading systems, noting that organisms, media, sample sizes and evaluation protocols differ, so the figures are not directly comparable. Colony detection on held-out plates had a precision of 0.936 and recall of 0.925 at 6 to 8 hours, which is in the same range as the 90% colony detection after 6 hours of incubation for time-lapse holographic imaging15, and the 96% detection at 8 hours for lens-free microscopy16. The two prior study methods required custom optical equipment for imaging, while this study uses a consumer digital microscope. Classification varies between isolates, with wide variation between plates. Lens-free microcolony imaging reached a classification precision near 93%16, a gap that likely reflects the time-lapse information available to that system, since colony growth rate is a feature a single snapshot cannot provide. For antibiotic response, single-cell microfluidic imaging could classify clinical isolates as susceptible or resistant in under 30 minutes18, whereas this study’s disc assay required 6 to 8 hours of growth. Overall, the distinguishing feature of this study is accessibility. A consumer digital microscope, standard agar and open-source software achieved detection comparable to specialized systems and classification that is usable but not yet reliable, which establishes a baseline from which the gaps in classification and susceptibility testing can be addressed.
Detection was accurate and consistent across folds. However, there were some misclassifications in isolate type. The most common error was the classification of E. coli microcolonies as B. flexus, affecting 423 of 873 E. coli colonies in fold 1 but only 6 of 452 in fold 2. Both organisms are rod-shaped, and at 6 to 12 hours their microcolonies are small, so the features that separate mature colonies, such as edge shape and surface texture, may not have developed. On non-selective agar and at an early timepoint, both form lumpy circular shaped and slightly bumpy textured colonies of similar color, likely causing the misclassifications. Two features of the data may explain why E. coli was misclassified as B. flexus and not the other way around. B. flexus microcolonies were larger and more variable than those of E. coli, so the appearance patterns learned for B. flexus overlapped the part of the E. coli range while few B. flexus colonies fell within the E. coli range. Colony density also differed between classes: B. flexus training images averaged about 50 colonies per spot against about 20 for E. coli. The E. coli plate held out in fold 1 was unusually dense at about 42 per spot, close to the B. flexus training images. Crowded colonies lose their regular outlines as neighbors touch, so the model may have used density and crowding as cues for B. flexus. On the other hand, S. haemolyticus was distinguished with high accuracy, with only a few microcolonies misclassified each fold, likely due to its distinct circular shape and smooth texture.
Several approaches could reduce the classification errors. Chromogenic or differential media, such as chromogenic UTI agar or MacConkey agar, would give E. coli a distinct color or suppress Gram-positive growth23. Higher magnification would let the model better use cell size and arrangement. Imaging at several time points would add growth rate and change in colony shape as features. Expanding the B. flexus dataset would also help, since it is the smallest class at 21 images and 902 colonies against 63 images and 1,707 colonies for E. coli.
Cefalotin was used because it was the only antibiotic disc available. It is an older first-generation cephalosporin and is not used to treat UTI24, so it served only to show that reduced microcolony growth near an antibiotic source can be detected by imaging. The assay is a preliminary growth inhibition test rather than susceptibility testing. Microcolony counts in spots 9 mm from the center of the disc were compared with counts in unexposed control spots, so absence of growth indicates a zone of inhibition of at least 18 mm, the CLSI susceptible breakpoint for Enterobacterales. The assay cannot measure zone diameter or separate intermediate from resistant results. Conditions used in this study’s antibiotic testing also did not match the specific conditions from CLSI M02 and EUCAST25. LB agar replaced Mueller-Hinton agar, incubation was shorter than the specified 16 to 18 hours, and no quality control strain verified disc potency. The inoculum was much lighter than a standard 0.5 McFarland suspension. Light inocula and short incubation both tend to enlarge apparent zones, so the assay is biased toward apparent susceptibility. CLSI has not defined cefalotin breakpoints for Bacillus species or staphylococci, so these results carry no clinical interpretation.
This study is proof of concept and does not demonstrate diagnostic performance. All experiments used sterile urine spiked with laboratory isolates, so the model has not encountered the cellular material, urogenital flora and variable pH of clinical samples. Microcolony counts were never calibrated against colony-forming units, so bacterial concentration cannot be reported or compared with the 10⁵ CFU/mL threshold. Each spot samples only 5 µL, which leaves counts vulnerable to pipetting error and sampling variation.
The three isolates (F-EC1, F-BF1 and F-SH1) came from one fecal specimen and were identified by MALDI-TOF mass spectrometry without sequence confirmation, giving one isolate per species. Clinical isolates of a given species differ in colony morphology, size and growth rate, and none of that variation is represented here. The model therefore distinguishes these three isolates rather than identifying species.
All three plates were streaked from the same overnight culture, so the plates are technical rather than biological replicates, and cross-validation by plate measures generalization across plates and imaging sessions only. Performance still varied widely within that limit. mAP@0.5 ranged from 69.0% to 95.2% and B. flexus precision from 20.0% to 89.2% across folds that differed only in which plate was held out. The reported values are an upper bound.
Establishing diagnostic performance would require spiking urine with inocula confirmed by plate count at concentrations above and below 10⁵ CFU/mL. This would calibrate microcolony counts against CFU/mL and give the limit of detection and limit of quantification. A blinded evaluation would then test negative urine, positive urine across that range, mixed cultures and common contaminants. Only after that does threshold-based classification become possible.
Species identification would require multiple independent clinical isolates per species from different patients, confirmed by whole-genome sequencing and held out of training. Adding organisms such as Klebsiella pneumoniae, Enterococcus faecalis, Proteus mirabilis and Staphylococcus saprophyticus would move the method toward clinical relevance. More plates and cultures per organism would also let the variability seen here be estimated rather than merely observed.
The antibiotic assay would need testing with antibiotics more commonly used in practice, including nitrofurantoin, trimethoprim-sulfamethoxazole and ciprofloxacin, and cefazolin, which has replaced cefalotin as the CLSI surrogate for oral cephalosporins in uncomplicated UTI. Each antibiotic would need validation against broth microdilution or standardized disc diffusion, with every discordant result reported. Extending the method to a panel, by placing several discs or antibiotic-containing spots on one plate, would be needed before it could inform treatment. Validation on patient specimens would be necessary before any clinical claim.
Microcolony imaging with automated analysis offers a possible route to shortening the delay between sample collection and preliminary microbiological information. This study establishes feasibility under controlled conditions and sets out what would need to be shown before the approach could be evaluated clinically.
Acknowledgements
Thank you to my dad for being my adult and scientific supervisor and teaching me the laboratory skills that I needed for this project. Thank you to Dr. Susan Poutanen for identifying the bacterial species for my project at Mount Sinai and consulting my ideas with me. Thank you to Dr. Cora Burt for making suggestions for my writing. And finally thank you to my family for supporting me throughout the process of making my project!
References
- A. L. Flores-Mireles, J. N. Walker, M. Caparon, S. J. Hultgren. Urinary tract infections: epidemiology, mechanisms of infection and treatment options. Nature Reviews Microbiology. Vol. 13, pg. 269-284, 2015, https://doi.org/10.1038/nrmicro3432. [↩] [↩] [↩]
- M. L. Wilson, L. Gaido. Laboratory diagnosis of urinary tract infections in adult patients. Clinical Infectious Diseases. Vol. 38, pg. 1150-1158, 2004, https://doi.org/10.1086/383029. [↩] [↩]
- A. D. Hay, K. Birnie, J. Busby, B. Delaney, H. Downing, J. Dudley, S. Durbaba, M. Fletcher, K. Harman, W. Hollingworth, K. Hood, R. Howe, M. Lawton, C. Lisles, P. Little, A. MacGowan, K. O’Brien, T. Pickles, K. Rumsby, J. A. C. Sterne, E. Thomas-Jones, J. van der Voort, C. A. Waldron, P. Whiting, M. Wootton, C. C. Butler. The diagnosis of urinary tract infection in young children (DUTY): a diagnostic prospective observational study to derive and validate a clinical algorithm for the diagnosis of urinary tract infection in children presenting to primary care with an acute illness. Health Technology Assessment. Vol. 20, pg. 1-294, 2016, https://doi.org/10.3310/hta20510. [↩] [↩]
- A. E. Clark, E. J. Kaleta, A. Arora, D. M. Wolk. Matrix-assisted laser desorption ionization-time of flight mass spectrometry: a fundamental shift in the routine practice of clinical microbiology. Clinical Microbiology Reviews. Vol. 26, pg. 547-603, 2013, https://doi.org/10.1128/CMR.00072-12. [↩]
- A. Kumar, D. Roberts, K. E. Wood, B. Light, J. E. Parrillo, S. Sharma, R. Suppes, D. Feinstein, S. Zanotti, L. Taiberg, D. Gurka, A. Kumar, M. Cheang. Duration of hypotension before initiation of effective antimicrobial therapy is the critical determinant of survival in human septic shock. Critical Care Medicine. Vol. 34, pg. 1589-1596, 2006, https://doi.org/10.1097/01.CCM.0000217961.75225.E9. [↩]
- C. A. Petti, C. R. Polage, T. C. Quinn, A. R. Ronald, M. A. Sande. Laboratory medicine in Africa: a barrier to effective health care. Clinical Infectious Diseases. Vol. 42, pg. 377-382, 2006, https://doi.org/10.1086/499363. [↩]
- J. Pawłowski, S. Majchrowska, T. Golan. Generation of microbial colonies dataset with deep learning style transfer. Scientific Reports. Vol. 12, pg. 5212, 2022, https://doi.org/10.1038/s41598-022-09264-z. [↩] [↩]
- S. D. Brugger, C. Baumberger, M. Jost, W. Jenni, U. Brugger, K. Mühlemann. Automated counting of bacterial colony forming units on agar plates. PLoS ONE. Vol. 7, pg. e33695, 2012, https://doi.org/10.1371/journal.pone.0033695. [↩]
- A. Signoroni, A. Ferrari, S. Lombardi, M. Savardi, S. Fontana, K. Culbreath. Hierarchical AI enables global interpretation of culture plates in the era of digital microbiology. Nature Communications. Vol. 14, pg. 6874, 2023, https://doi.org/10.1038/s41467-023-42563-1. [↩]
- J. Glasson, R. Hill, M. Summerford, S. Giglio. Evaluation of an image analysis device (APAS) for screening urine cultures. Journal of Clinical Microbiology. Vol. 54, pg. 300-304, 2016, https://doi.org/10.1128/JCM.02365-15. [↩]
- M. L. Faron, B. W. Buchan, H. Samra, N. A. Ledeboer. Evaluation of WASPLab software to automatically read chromID CPS Elite agar for reporting of urine cultures. Journal of Clinical Microbiology. Vol. 58, pg. e00540-19, 2019, https://doi.org/10.1128/JCM.00540-19. [↩]
- I. Burckhardt, K. Last, S. Zimmermann. Shorter incubation times for detecting multi-drug resistant bacteria in patient samples: defining early imaging time points using growth kinetics and total laboratory automation. Annals of Laboratory Medicine. Vol. 39, pg. 43-49, 2019, https://doi.org/10.3343/alm.2019.39.1.43. [↩]
- A. Cherkaoui, G. Renzi, N. Vuilleumier, J. Schrenzel. Copan WASPLab automation significantly reduces incubation times and allows earlier culture readings. Clinical Microbiology and Infection. Vol. 25, pg. 1430.e5-1430.e12, 2019, https://doi.org/10.1016/j.cmi.2019.04.001. [↩]
- E. Bae, N. Bai, A. Aroonnual, A. K. Bhunia, E. D. Hirleman. Label-free identification of bacterial microcolonies via elastic scattering. Biotechnology and Bioengineering. Vol. 108, pg. 637-644, 2011, https://doi.org/10.1002/bit.22980. [↩]
- H. Wang, H. Ceylan Koydemir, Y. Qiu, B. Bai, Y. Zhang, Y. Jin, S. Tok, E. C. Yilmaz, E. Gumustekin, Y. Rivenson, A. Ozcan. Early detection and classification of live bacteria using time-lapse coherent imaging and deep learning. Light: Science & Applications. Vol. 9, pg. 118, 2020, https://doi.org/10.1038/s41377-020-00358-9. [↩] [↩] [↩]
- P. Paquin, C. Durmort, C. Paulus, T. Vernet, P. R. Marcoux, S. Morales. Spatio-temporal based deep learning for rapid detection and identification of bacterial colonies through lens-free microscopy time-lapses. PLOS Digital Health. Vol. 1, pg. e0000122, 2022, https://doi.org/10.1371/journal.pdig.0000122. [↩] [↩] [↩]
- J. Choi, J. Yoo, M. Lee, E. G. Kim, J. S. Lee, S. Lee, S. Joo, S. H. Song, E. C. Kim, J. C. Lee, H. C. Kim, Y. G. Jung, S. Kwon. A rapid antimicrobial susceptibility test based on single-cell morphological analysis. Science Translational Medicine. Vol. 6, pg. 267ra174, 2014, https://doi.org/10.1126/scitranslmed.3009650. [↩]
- Ö. Baltekin, A. Boucharin, E. Tano, D. I. Andersson, J. Elf. Antibiotic susceptibility testing in less than 30 min using direct single-cell imaging. Proceedings of the National Academy of Sciences. Vol. 114, pg. 9170-9175, 2017, https://doi.org/10.1073/pnas.1708558114. [↩] [↩]
- M. Fredborg, K. R. Andersen, E. Jørgensen, A. Droce, T. Olesen, B. B. Jensen, F. S. Rosenvinge, T. E. Søndergaard. Real-time optical antimicrobial susceptibility testing. Journal of Clinical Microbiology. Vol. 51, pg. 2047-2053, 2013, https://doi.org/10.1128/JCM.00440-13. [↩]
- K. P. Smith, A. D. Kang, J. E. Kirby. Automated interpretation of blood culture Gram stains by use of a deep convolutional neural network. Journal of Clinical Microbiology. Vol. 56, pg. e01521-17, 2018, https://doi.org/10.1128/JCM.01521-17. [↩]
- H. O. Eltwisy, H. O. Twisy, M. H. R. Hafez, I. M. Sayed, M. A. El-Mokhtar. Clinical infections, antibiotic resistance, and pathogenesis of Staphylococcus haemolyticus. Microorganisms. Vol. 10, pg. 1130, 2022, https://doi.org/10.3390/microorganisms10061130. [↩]
- T.-Y. Lin, M. Maire, S. J. Belongie, J. Hays, P. Perona, D. Ramanan, P. Dollár, C. L. Zitnick. Microsoft COCO: common objects in context. In Computer vision – ECCV 2014 (eds. D. Fleet, T. Pajdla, B. Schiele, T. Tuytelaars), pg. 740-755. Springer International Publishing, 2014, https://doi.org/10.1007/978-3-319-10602-1_48. [↩]
- J. D. Perry. A decade of development of chromogenic culture media for clinical microbiology in an era of molecular diagnostics. Clinical Microbiology Reviews. Vol. 30, pg. 449-479, 2017, https://doi.org/10.1128/CMR.00097-16. [↩]
- K. Gupta, T. M. Hooton, K. G. Naber, B. Wullt, R. Colgan, L. G. Miller, G. J. Moran, L. E. Nicolle, R. Raz, A. J. Schaeffer, D. E. Soper. International clinical practice guidelines for the treatment of acute uncomplicated cystitis and pyelonephritis in women: a 2010 update by the Infectious Diseases Society of America and the European Society for Microbiology and Infectious Diseases. Clinical Infectious Diseases. Vol. 52, pg. e103-e120, 2011, https://doi.org/10.1093/cid/ciq257. [↩]
- E. Matuschek, D. F. J. Brown, G. Kahlmeter. Development of the EUCAST disk diffusion antimicrobial susceptibility testing method and its implementation in routine microbiology laboratories. Clinical Microbiology and Infection. Vol. 20, pg. O255-O266, 2014, https://doi.org/10.1111/1469-0691.12373. [↩]