
Abstract
Per- and polyfluoroalkyl substances (PFAS) are environmentally persistent. I investigated whether concentrations of PFOA and PFOS in publicly available water quality monitoring datasets from California were associated with incidence rates for 19 cancers or prevalence estimates for six chronic-disease outcomes. The California data included individual municipal sample results between 2016 and 2022. Records from the same well and date were combined using the median; nondetects were assigned the reporting limit divided by √2; repeated samples within each well and year were averaged, and the median across years gave one value per well before calculating separate county medians for PFOA and PFOS. The multivariable regression models adjusted for income, current smoking, and all other specified variables, and applied corrections for multiple testing. The dataset included 29,095 retained measurements from 2,356 wells across 45 counties. No primary cancer association, county-level chronic-disease association, primary tract result, or follow-up spatial-error PFAS coefficient remained statistically significant after false-discovery-rate adjustment. Seven inverse county sensitivity coefficients and an inverse PFOS-obesity tract coefficient at 20 km survived correction. Pooled NHANES 2015-2018 data showed positive associations of serum PFOA and PFOS with total cholesterol (β = 6.00 and 5.65 mg/dL per unit higher log-transformed serum concentration, respectively; FDR p = 0.0290 and 0.0241). Neither NHANES coefficient survived correction in a joint model. Overall, the primary California analyses found no statistically significant associations after correction, while separate NHANES models showed positive cholesterol associations; these observational findings do not prove cause and effect.
Keywords: PFAS, PFOA, PFOS, incidence of cancer, cholesterol, drinking water, ecological study, NHANES
Introduction
A wide variety of synthetic chemicals known collectively as per- and polyfluoroalkyl substances (PFAS) have been developed. They serve as additives in manufacturing processes in order to provide resistance against heat, water, oils, and stains. Although some PFAS may remain intact for long periods of time and therefore persist in the environment and the human body over extended time frames, there exist varying degrees of scientific evidence regarding their adverse health impacts. Thus, treating all PFAS as having identical harmful health effects would be misleading. The International Agency for Research on Cancer classified PFOA as “carcinogenic to humans” (Group 1), whereas it classified PFOS as “possibly carcinogenic to humans” (Group 2B)1. The Agency for Toxic Substances and Disease Registry (ATSDR) provides a summary of health evidence2; the primary studies are discussed below.
On April 10, 2024, the U.S. Environmental Protection Agency established maximum contaminant levels (MCLs) in drinking water of 4.0 ng/L for PFOA and of 4.0 ng/L for PFOS3. On May 18, 2026, EPA announced a proposed rule that would allow eligible water systems to request two additional years, until 2031, to comply with those limits4. Each limit applies to one chemical, and compliance is generally determined using running annual averages at each sampling point. A county median value, a county maximum value, or a single laboratory result is not considered an EPA compliance test. This distinction makes a difference when regulatory monitoring data are reused for a health study.
The purpose of this study was to determine whether PFOA and PFOS measured in California’s public-water supply monitoring programs were associated with cancer or chronic disease. I assessed associations among 19 cancer sites utilizing the same calendar timeframe and consistent sex-specific definitions. I evaluated associations for six chronic-disease outcomes at the county level and conducted an exploratory assessment of census-tract data. Since county averages may obscure substantial differences among individuals, I conducted a secondary NHANES analysis of serum PFOA, serum PFOS, and total cholesterol. Higher total cholesterol is one of the most consistently reported health outcomes linked to PFAS exposure5.
Using publicly available UCMR 3 (2013–2015) and UCMR 5 (2023–2024) PFAS measurement data obtained from public-water supplies in conjunction with age-adjusted county cancer incidence rates from 2016–2021, a national ecological study reported positive associations among selected cancer groups. Incidence rate ratios ranged from 1.02 to 1.33 for the various cancer groups studied in the report6. The national study provides a useful comparison for this project, but both studies relied on county-level data; therefore, neither study could demonstrate that PFAS directly contributed to cancer development in an individual person.
I hypothesized that higher concentrations of PFOA and PFOS would be associated with greater cancer incidence and greater prevalence of chronic-disease outcomes examined at the county level. Additionally, I hypothesized that higher serum concentrations of PFOA and PFOS would be associated with higher total cholesterol levels. Both hypotheses concern associations rather than direct causation because the California analyses were ecological and the NHANES analysis was cross-sectional.
Methods
Study Design and Protocol
Prior to performing the final models, I documented the exposure window, chemicals involved, main exposure measure, outcomes, adjustment variables, model types, multiple-testing correction methods and interpretive criteria. I did not utilize results from prior exploratory runs that had an open-ended date range or utilized a county maximum as the main exposure.
For California Public-Water Exposure Data
Data on PFAS concentrations in California public-water systems were retrieved from a Groundwater Ambient Monitoring and Assessment (GAMA) export; information about each public-water system was obtained from Drinking Water Watch7. For inclusion in this study, each record required an exact match between the GAMA dataset name and DDW; the well category had to be Municipal; the data source had to be DDW; the chemical code had to be PFOA or PFOS; and the collection date had to fall between January 1, 2016 and December 31, 2022. Each record also needed information identifying a public-water system and a principal county. Concentration units were converted to ng/L by multiplying concentrations in µg/L by 1,000. Records with unknown concentration units could not be converted and were excluded.
Municipal is a source label, not proof of community-system status or treatment at each sampling point. The cached December 2025 facility snapshot lacks historical service areas, water volumes, blending and sample-specific treatment status.
For Nondetect Results
Concentrations less than detection (<) were assigned reporting limits divided by √2; similarly, concentrations labeled ND or DN were assigned reporting limits divided by √2. Nondetects with zero reporting limits were excluded because the cached fields provided no defensible positive substitute. No missing-limit numeric-result fallback was needed. Sensitivity analyses used zero, half-limit and full-limit substitutions for nondetects with positive limits.
When multiple samples represented the same county, water system, well number, sampling date, and chemical, concentrations were combined into a single record by taking the median. Samples for each well, year, and chemical were then averaged. The median across available annual means gave one period value per well, so wells monitored in more years did not contribute more values to the county summary.
Each county was assigned a median value for each chemical by taking the median of its well-period values. For each county, the primary summary measures were separate log[1 + PFOA median] and log[1 + PFOS median] values. This avoids adding unpaired county medians or assuming equal biological potency.
I generated nine alternative versions of the measures by using: zero, half-limit and full-limit nondetect substitution; daily collection-time handling; omission of mixed-detection days; retention of zero-limit rows under their original handling; community systems only; and residential- or total-population weighting. For population weighting, I averaged well-period values within systems and weighted system means within principal county using positive administrative population fields. These later population fields cannot establish historical delivered-water exposure. Supplement Section S2 gives the exact rules.
As mentioned previously, this is a research-based summary measure; it is not intended to approximate an individual’s cumulative dose or an MCL compliance metric.
Cancer Outcomes
Age-adjusted cancer incidence rates were obtained from State Cancer Profiles for years 2018–20228. There were 19 sites assessed: bladder; brain and other nervous system; female breast; childhood cancer under age 20; colon and rectum; esophagus; kidney and renal pelvis; leukemia; liver and intrahepatic bile duct; lung and bronchus; melanoma; non-Hodgkin lymphoma; oral cavity and pharynx; ovary; pancreas; prostate; stomach; thyroid; and uterus. Breast, ovary, and uterus used female rates, and prostate used male rates; all other sites used rates for both sexes.
I omitted a county from an outcome-specific analysis when either the rate was suppressed or the confidence interval was missing.
County and Tract Chronic Disease Outcomes
The Centers for Disease Control and Prevention (CDC) released the 2025 PLACES estimates for data year 2023 supplying estimates for high cholesterol, coronary heart disease, high blood pressure, diabetes, obesity, and current asthma9,10. I used age-adjusted prevalence (AgeAdjPrv) estimates at the county level for the six chronic disease outcomes listed above; lack of insurance; and current smoking. At the tract level I used crude prevalence (CrdPrv) since PLACES does not produce age-adjusted estimates at that geographic level.
The six outcomes concern adults aged 18 or older: professionally diagnosed asthma that is still present; ever-diagnosed angina or coronary heart disease; ever-diagnosed hypertension excluding pregnancy-only or borderline reports; ever-diagnosed diabetes excluding pregnancy-only reports; obesity defined as BMI at least 30 from reported height and weight; and ever-diagnosed high cholesterol among adults who had been screened. Unknown, refused or missing responses are excluded. Obesity also requires valid height and weight within CDC eligibility ranges (Supplement Section S1). Current smoking means at least 100 lifetime cigarettes and smoking every day or some days now, among adults aged 18 or older. Lack of insurance concerns adults aged 18–64. PLACES high cholesterol is a modeled diagnosis prevalence, not NHANES laboratory total cholesterol in mg/dL. Tract median household income and tract poverty percentage were obtained from official ACS five-year estimates B19013 and C1700211.
For the exploratory tract analysis, I used the PFAS metric based on monitored wells within 10 km of the tract center. For each compound, co-located wells were averaged before averaging eligible locations within 10 km of the Census internal point. Distances followed the Earth’s curvature. I used log[1 + the mean concentration] as the tract measure. If no eligible well was within 10 km, the measure was left missing; no distant-well replacement was used. Nearby wells are not assumed to supply tract residents.
County and Tract Statistical Analysis
Each cancer site outcome was modeled via an inverse variance-weighted linear regression where age-adjusted incidence rates served as the dependent variable. Predictors included standardized log[1+ county compound concentration]; median household income; and current smoking. Incidence rates with smaller confidence intervals received greater weights. Standard errors for each outcome were calculated by dividing the respective confidence interval widths by 3.92, with a minimum of 0.01 in outcome units. Heteroscedastic-consistent covariance matrices (HC3) were specified for estimating coefficient standard errors. PFAS coefficients represent the change in incidence rate associated with a one-standard-deviation increase in the log-transformed county compound measure.
Continuous predictors were standardized within each complete-case sample using the population standard deviation. Cancer models retained income and current smoking to address socioeconomic and smoking differences; chronic-disease models added lack of insurance to address diagnosis access. These variables were recorded in the revision plan, not selected to change PFAS p-values. The common set cannot control every cancer-specific risk factor. Models required at least 20 counties. Alternative analyses included unweighted HC3 models; the nine alternative exposure definitions; and models excluding each county individually. Matched-county reference fits compared primary and alternative measures on identical county samples.
Twelve county PLACES compound-outcome models used analogous procedures with adjustments made for income; current smoking; and lack of insurance. Twelve primary tract compound-outcome models used inverse-variance weighting with adjustments made for current smoking; lack of insurance; natural logarithm-transformed median household income; and poverty percentage. Tract models were clustered by county; had a small-sample correction applied; and t-tests were employed with reference distributions based upon t-distributions. Primary tract models used county fixed effects, facilitating comparisons among tracts within the same county; additional models omitted those effects. Primary t inference used 43 degrees of freedom. Eight exposure sensitivities included 5 and 20 km radii; Supplement Section S5 gives definitions and matched-tract checks.
Benjamini-Hochberg false-discovery-rate (FDR) and Bonferroni corrections were conducted separately for three families: 38 cancer coefficients, 12 county chronic-disease coefficients, and 12 primary tract coefficients, including both compounds in each family. Applying any type of correction lowered the probability of calling a result statistically significant solely because multiple hypotheses had been tested. Each county sensitivity used the same 38- and 12-test families; pooled sensitivity corrections covered 342 cancer and 108 chronic-disease coefficients. Tract corrections covered each 12-test definition, all 96 exposure-sensitivity coefficients, and all 108 secondary coefficients including models without county fixed effects. Reported 95% intervals are unadjusted for multiple comparisons. Raw p values below 0.05 were not treated as final findings unless they remained statistically significant after the planned multiple-testing correction.
Spatial Residual Diagnostic
Center points representing each county were linked to their four nearest neighbor counties via row-standardized symmetric graphs constructed using census-gazetteer center points in 2023. Spatial autocorrelation among county-specific model residuals was evaluated using Moran’s I12. A one-sided Moran’s I test used 9,999 permutations with a fixed random seed to evaluate positive spatial autocorrelation in county residuals.
I applied FDR corrections separately to the 38 cancer residual tests and the 12 chronic-disease residual tests. For each outcome whose residual autocorrelation remained significant after FDR correction, I fit an unweighted, heteroskedasticity-robust spatial-error model with the same standardized predictors. I then FDR-corrected the PFAS coefficient p-values across the 12 follow-up compound-outcome models.
The estimator was GM_Error_Het in spreg 1.9.0 with libpysal 4.8.1: max_iter = 1, epsilon = 0.00001, step1c = False, hard_bound = True, an intercept and no spatially lagged predictors. Follow-up inference used normal-based intervals and tests. Supplement Section S3 records the graph construction and permutation rules.
NHANES Individual-Level Analysis
NHANES files from 2015–2016 and 2017–2018 provided serum PFOA and PFOS isomer measurements, total cholesterol, demographic information, body mass index (BMI), survey strata, PFAS subsample weights, and primary sampling units13,14. Following guidance from NCHS I calculated total PFOA by adding concentrations of linear and branched isomers together. I calculated total PFOS by combining concentrations of linear and monomethyl-branched isomers14. If either isomer measurement was missing, the total for that chemical was left missing. Special missing-value codes in the SAS data were converted to missing values before analysis. When I pooled the two NHANES cycles, I divided each two-year PFAS subsample weight by two. My key exposures were log[1 + total serum PFOA (ng/mL)] and log[1 + total serum PFOS (ng/mL)]. I added age, age squared, sex, race/ethnicity, income-to-poverty ratio, and BMI as covariates to all my models.
PFAS files represent a one-third subsample of examined participants aged 12 or older. CDC-supplied below-detection values were retained. A source-byte audit found that the previous reader also treated genuine numeric zeros as missing. Restoring valid zero income-to-poverty ratios added 34 complete cases. Separate and joint models now use identical participants. Age retains the released top code of 80 for ages 80 and older.
I used survey-weighted linear regression that accounted for NHANES strata and primary sampling units using Taylor-linearized standard errors. The tests and confidence intervals used design degrees of freedom equal to the number of represented primary sampling units minus the number of represented strata. All of the final models included every available complete case. In order to correct for the fact that there were two tests for the two PFOA/PFOS compounds, I considered them part of a two-test family for FDR and Bonferroni adjustment within each model type. To perform an outlier check, I capped values greater than each chemical’s 99th percentile at that value (known as Winsorization). No participants were eliminated due to the check. The cutoff was chosen without looking at statistical significance.
The cutoffs were 8.028 ng/mL for PFOA and 39.5 ng/mL for PFOS. An additional correction covered all four joint coefficients. Of 4,303 PFAS-file records, sequential exclusions were 61 zero weights, 320 missing required isomers, five missing cholesterol, 451 missing income-to-poverty ratio and 33 missing BMI. The final sample included 1,778 participants from 2015–2016 and 1,655 from 2017–2018 (Supplement Table S9). Cholesterol-lowering medication was unavailable in the cached files.
Reproducibility and ethics
All data were publicly available and deidentified. I did not recruit or contact anyone or access identifiable private information. This was a secondary analysis of public, deidentified data; no project-specific IRB approval is claimed. A source manifest indicates where each file originated from; when it was downloaded; and its SHA-256 hash. Automated checks verify dates, chemical names, cancer ranges, data joins, PLACES estimate types, ACS coverage, tract matches, NHANES isomer sums, spatial-test families, multiple-testing fields, and SAS missing-value codes.
Reproducibility and Data Availability
The project repository contains the code run during analysis; the processed tables; the URLs from which the data were obtained; download details; and their SHA-256 hashes. Revision entry points are src/run_nhsjs_revision_audit.py, src/run_nhsjs_revision_models.py, src/run_nhsjs_revision_tract.py and src/run_nhsjs_revision_nhanes.py. The accompanying supplementary document reports the supporting methods and results. Detailed revision outputs and model-inclusion records are retained by the author and are available on request. The recorded fits used Python 3.9.6, pandas 1.5.3, NumPy 1.26.4, SciPy 1.13.1 and statsmodels 0.14.6. Due to size limitations large California source files have been saved locally. Sources for State Cancer Profiles, CDC PLACES, Census Gazetteer, ACS and NHANES are documented in data/processed/source_manifest.csv.
Results
Exposure Description
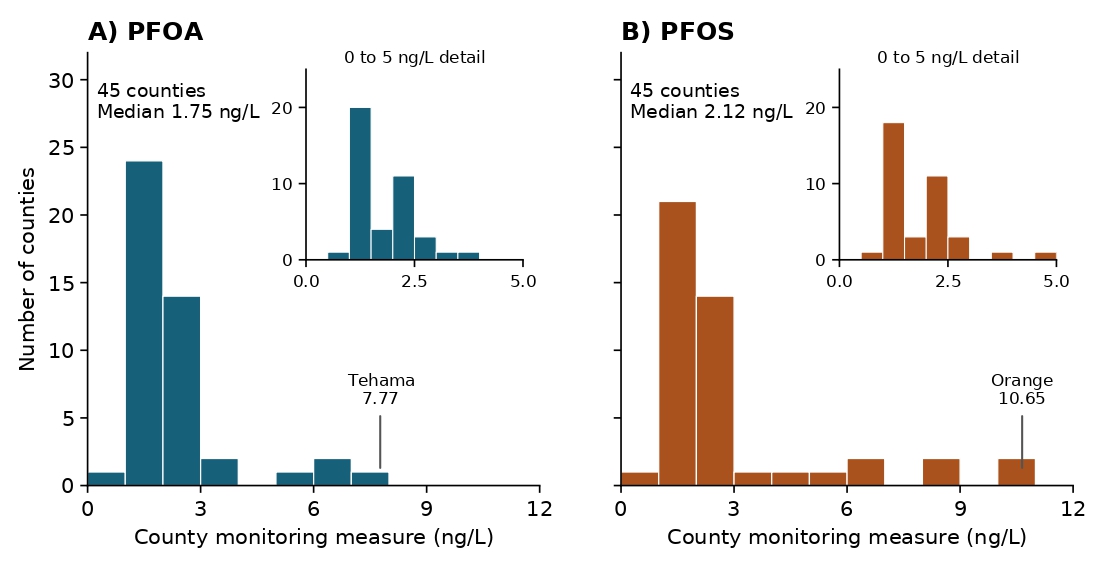
The GAMA export had 1,091,769 rows. 29,229 PFOA or PFOS measurements met the initial study rules; excluding 134 zero-limit nondetects left 29,095. Results from the same well and date were combined by taking their median, leaving 28,109 records. The retained data covered 2,356 wells, 482 public water systems, and 45 counties. After averaging the records for each well, year, and chemical; 10,861 well-year-chemical averages were produced.
The median county measures were 1.75 ng/L for PFOA and 2.12 ng/L for PFOS. Tehama County had the highest PFOA measure at 7.77 ng/L, and Orange County had the highest PFOS measure at 10.65 ng/L. These summaries describe the monitored wells only. They do not indicate how many residents were exposed or what concentrations individual residents encountered. Figure 1 shows the distributions, and Table 1 updates the ten counties listed in the submitted table.
Initially, 7,472 of 14,611 PFOA rows (51.14%) and 6,334 of 14,618 PFOS rows (43.33%) were nondetects. Excluding 72 PFOA and 62 PFOS zero-limit nondetects gave retained nondetect percentages of 50.90% and 43.09%. Median nondetect limits were 2.0 ng/L for both compounds, with interquartile ranges of 1.8–2.0 ng/L. Supplement Tables S1–S2 give annual counts and limit distributions.
County monitoring covered one to seven distinct years (Supplement Table S3). Both compounds appeared in all 2,356 eligible wells and 5,445 well-year units, and in 14,117 of 14,126 well-date units; dates do not establish the same laboratory aliquot. With zero substitution, 35 PFOA and 30 PFOS county measures became zero. Residential-population-weighted measures correlated with the primary measures at Spearman 0.811 for PFOA and 0.742 for PFOS over 42 counties; total-population correlations were 0.778 for both over 45 counties (Supplement Table S4). These comparisons do not validate delivered exposure.
| County | Wells | PFOA median (ng/L) | PFOS median (ng/L) | Years |
| Tehama | 8 | 7.77 | 5.21 | 4 |
| Orange | 142 | 6.48 | 10.65 | 6 |
| San Diego | 48 | 2.66 | 8.32 | 7 |
| Alameda | 47 | 2.13 | 10.55 | 5 |
| Del Norte | 2 | 6.10 | 6.77 | 4 |
| San Luis Obispo | 45 | 2.85 | 4.88 | 5 |
| Sutter | 2 | 5.45 | 6.00 | 1 |
| Riverside | 177 | 3.03 | 2.70 | 7 |
| Tuolumne | 2 | 1.41 | 8.21 | 1 |
| Los Angeles | 473 | 2.12 | 2.58 | 5 |
Cancer associations
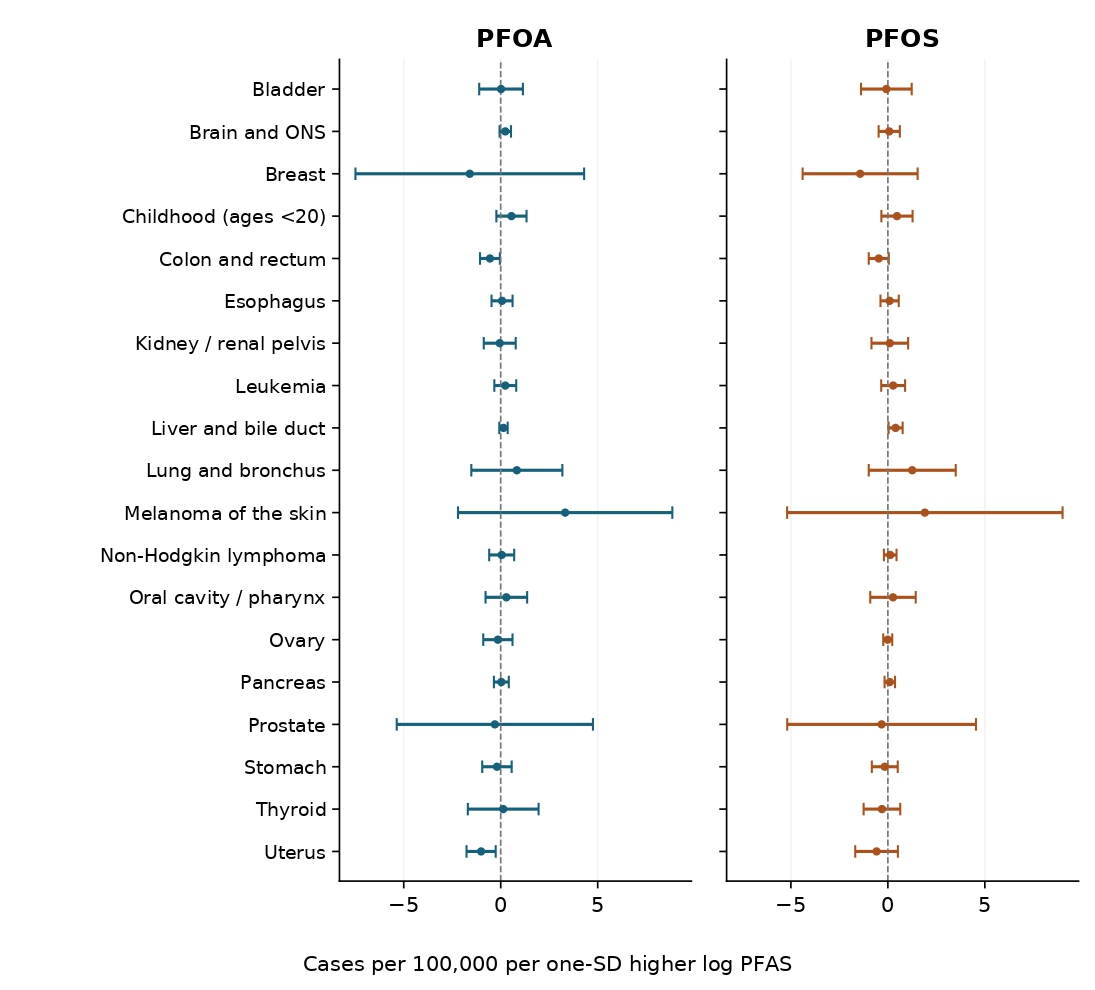
Three of the 38 cancer coefficients had a raw p value below 0.05. In the PFOS liver/bile duct cancer model, a higher log concentration was associated with a higher incidence rate. The model estimated an increase of 0.40 cases per 100,000 (95% CI 0.04–0.76; p = 0.0312) for each one-standard-deviation increase in log PFOS. Its FDR p value was 0.4221. PFOA coefficients were inverse for colon/rectum and uterus. After FDR and Bonferroni corrections, no primary cancer association remained statistically significant (Figure 2 and Supplement Table S5).
I repeated the model while leaving out one county at a time to determine whether one county was driving the PFOS liver/bile duct result. The coefficient ranged from 0.27 to 0.46, while its p value ranged from 0.0083 to 0.1227. I also examined 342 cancer coefficients under nine alternative exposure definitions. Four inverse coefficients survived both within-definition and pooled FDR: PFOA with uterine cancer under zero, half-limit and community-system definitions, and PFOA with colorectal cancer under the community-system definition. Corresponding primary fits on matched counties did not survive FDR (Supplement Tables S7 and S18).
County chronic disease associations
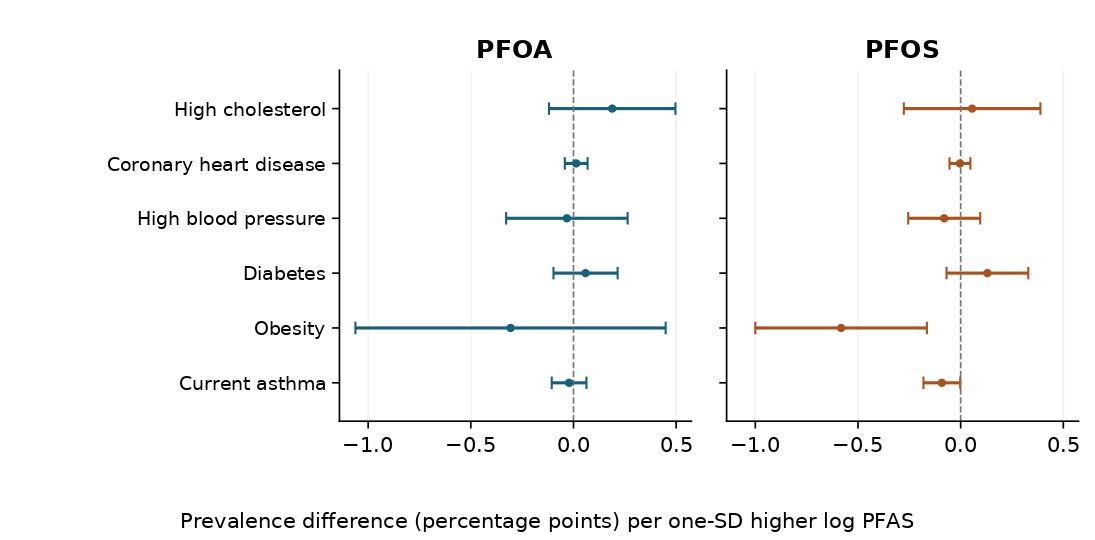
Two of the 12 primary county PLACES coefficients had a raw p value below 0.05: PFOS with obesity (β = −0.582 prevalence points; p = 0.0063; FDR p = 0.0758) and PFOS with asthma (β = −0.092; p = 0.0454; FDR p = 0.2725). No primary county chronic-disease outcome remained statistically significant after either FDR or Bonferroni correction (Figure 3 and Supplement Table S6). Among the 108 sensitivity coefficients, three inverse asthma coefficients survived both within-definition and pooled FDR: PFOS under residential and total-population weighting, and PFOA under total-population weighting. Corresponding matched-county primary fits did not survive FDR (Supplement Tables S7 and S18).
Exploratory Tract associations
All 9,070 health tract IDs matched the cached Gazetteer and ACS files. At 10 km, 2,366 health tracts lacked a nearby well and 54 more lacked covariates. Complete PLACES, monitoring, income, and poverty data were available for 6,650 tracts in 44 counties.
In the primary county-fixed-effects models, none of the 12 compound-outcome coefficients remained statistically significant after FDR or Bonferroni correction (Supplement Figure S4 and Table S12).
At 20 km, inverse obesity coefficients survived within-definition FDR for both compounds, but only PFOS survived pooled correction (β = −0.535; 95% CI −0.756 to −0.314; 96-test FDR p = 0.001210). The inverse PFOS result remained on matched tract IDs. Supplement Section S5 reports all radius and exposure-definition checks. This result does not establish protection from obesity.
Spatial Residual Diagnostics
Twelve of the 38 cancer compound-outcome models showed significant residual spatial clustering after FDR correction (Moran’s I = 0.187–0.325). None of the 12 county chronic-disease models showed significant residual spatial clustering after correction.
I then ran a spatial-error model for each of the 12 compound-outcome combinations that triggered this follow-up analysis. None of the PFAS coefficients remained statistically significant after FDR correction across those 12 follow-ups (Supplement Table S8).
PFOA/PFOS Levels and Cholesterol Levels
The separate-model NHANES analysis included 3,433 complete cases in 30 strata with 60 primary sampling units. Total serum PFOA was positively associated with total cholesterol. The coefficient was 6.00 mg/dL per unit higher log[1 + total serum PFOA (ng/mL)] (95% CI 0.66–11.35; p = 0.0290; FDR p = 0.0290; Bonferroni p = 0.0579).
Total serum PFOS showed a similar positive association. Its coefficient was 5.65 mg/dL per unit higher log[1 + total serum PFOS (ng/mL)] (95% CI 1.33–9.96; p = 0.0121; FDR p = 0.0241; Bonferroni p = 0.0241).
For the sensitivity analysis, I capped concentrations above each chemical’s 99th percentile rather than deleting any records. The PFOA coefficient increased to 6.90 mg/dL (95% CI 1.03–12.76; p = 0.0228; FDR p = 0.0228). The PFOS coefficient changed only slightly, remaining 5.65 mg/dL after rounding (95% CI 1.29–10.01; p = 0.0129; FDR p = 0.0228). Both associations remained statistically significant after Bonferroni correction, and no high-exposure records were deleted for this sensitivity analysis.
The weighted log-compound correlation was 0.580. In the joint model, coefficients were 2.55 mg/dL for PFOA (95% CI −3.83 to 8.93) and 4.80 mg/dL for PFOS (95% CI −0.32 to 9.92); neither survived FDR. Weighted variance inflation factors were 1.562 and 1.913. Joint capped models also failed FDR correction (Table 2).
| Family | Chemical | β (mg/dL) | 95% CI | p | FDR p | Design df | n |
| Separate | PFOA | 6.00 | 0.66 to 11.35 | 0.0290 | 0.0290 | 30 | 3433 |
| Separate | PFOS | 5.65 | 1.33 to 9.96 | 0.0121 | 0.0241 | 30 | 3433 |
| Separate capped | PFOA | 6.90 | 1.03 to 12.76 | 0.0228 | 0.0228 | 30 | 3433 |
| Separate capped | PFOS | 5.65 | 1.29 to 10.01 | 0.0129 | 0.0228 | 30 | 3433 |
| Joint | PFOA | 2.55 | -3.83 to 8.93 | 0.4202 | 0.4202 | 30 | 3433 |
| Joint | PFOS | 4.80 | -0.32 to 9.92 | 0.0650 | 0.1300 | 30 | 3433 |
| Joint capped | PFOA | 3.44 | -3.53 to 10.41 | 0.3219 | 0.3219 | 30 | 3433 |
| Joint capped | PFOS | 4.52 | -0.71 to 9.75 | 0.0877 | 0.1755 | 30 | 3433 |
Discussion
The California and NHANES analyses produced different results. Primary county and tract analyses did not find PFAS associations that remained significant after multiple testing corrections. County PFAS summaries varied widely among counties and the records do not establish how many people drank water at those levels. Twelve cancer compound-outcome models showed geographically clustered residuals and coefficients from follow-up spatial-error models for PFAS did not remain significant after corrections either. Separate NHANES models showed both total serum PFOA and PFOS were positively associated with total cholesterol and capping changed coefficients from 6.00 to 6.90 mg/dL for PFOA and 5.65 to 5.65 mg/dL for PFOS. Joint coefficients were not significant after correction. Seven inverse county sensitivity coefficients and the wider-radius PFOS-obesity finding also need to be considered.
Cancer results do not prove that no association exists. Monitoring of water from 2016 to 2022 overlaps with the cancer period from 2018 to 2022 and includes some measurements after diagnosis. It cannot represent decades of exposure that might matter for cancer development. Also, principal counties of water systems don’t match everyone’s actual source of water. I also lack residential history data and county cancer rates combine people with very different exposures. These limitations can hide real associations or create the appearance of associations. The limited number of county observations, unmeasured confounding, and multiple comparisons add to the uncertainty.
Results for liver cancer show why correction for multiple testing matters. The PFOS raw p value was below 0.05 and its confidence interval barely excluded zero; coefficients stayed positive when I removed counties one at a time. However, liver cancer was just one of 38 planned compound-outcome tests and its corrected p value is 0.4221 and other exposure measures did not consistently show results. Results are worth retesting but they are not confirmed associations.
The California results differed from the positive screening results reported in the national study6, but the two studies were not direct replications. That study used monitoring data at national level for UCMR and several PFAS using detection or regulatory thresholds. I used separate medians of well-period PFOA and PFOS values from California GAMA/DDW monitoring. Studies also differed in location and time period and also in cancer groups and regression models used. National studies serve as useful comparative evidence but they do not turn California results into positive findings and vice versa. Neither ecological study proves causality at the individual level.
Results for tracts depended on the monitoring radius. No primary county-fixed-effects coefficient survived correction, but inverse PFOS-obesity survived pooled correction at 20 km. Fixed county effects account for stable county differences such as health systems and regional environment. Even so, the tract metric relied on distance to monitored wells rather than service to households and PLACES values were modeled estimates rather than direct tract surveys9,10. Adult-age groups were unavailable in the cached ACS inputs; county fixed effects cannot remove age differences among tracts within the same county.
Spatial checks showed similar errors among nearby counties for 12 cancer compound-outcome models. This means regular county regressions missed some regional patterns. Spatial error models accounted for clustering but none of their PFAS coefficients remained significant after correction. This supports cautious interpretation similar to main models and explains why spatial checks were important.
The NHANES cholesterol analysis is closer to the individual level because PFAS and cholesterol were measured in the same participants. The models also accounted for the survey’s complex design. Positive coefficients agree with evidence from earlier work including a large community that was highly exposed5. However, NHANES is cross-sectional, so PFAS and cholesterol were measured at the same time. Diet or other unmeasured factors might partly explain relationships. Results do not prove lowering either chemical would reduce cholesterol.
Neither joint coefficient survived FDR, so the separate models do not clearly identify independent compound associations. Correlated compounds may share information, and the joint results do not prove that both associations are absent. Medication, smoking, diet, physical activity, kidney function and complete-case selection remain limitations. BMI may be a confounder or an intermediate variable. Laboratory cholesterol is not the same endpoint as a reported high-cholesterol diagnosis or a cardiovascular event.
Hazard assessments address a broader question rather than this project. IARC Group 1 classification asks whether PFOA can cause cancer under certain conditions rather than how much risk comes from one concentration of water1. ATSDR and National Academies review evidence from diverse populations and study designs2,15 and this project is just one limited ecological test using public monitoring and county health rates. Its cancer results do not overturn larger evidence.
Recent studies help place these results in context. Karasaki and colleagues linked water-system boundaries to tract cancer-history prevalence, reporting associations for several compounds including PFOA but not PFOS16. A national tapwater study found PFAS in private-well and public-supply samples17, and a groundwater model estimated occurrence before treatment18. Linked source, finished-water and tapwater samples showed why sampling point and treatment matter19. Associations between PFAS sources or detections and the racial and ethnic composition of populations served by community systems also support examining monitoring coverage20. These studies do not make a county statistic an individual exposure estimate.
Prediagnostic cancer studies have not all agreed. PLCO reported a positive PFOA association with renal-cell carcinoma, whereas the Multiethnic Cohort found no overall association21,22. CPS-II reported a positive association in women but not men23. A small liver study found a positive high-PFOS association; a later 12-cohort study found no overall association for the three tested PFAS, with PFOA estimates differing by sex24,25. Air Force and thyroid studies reported PFOS findings that depended on sample timing or came from small groups26,27. The differences in cancer sites, populations and exposure timing matter when comparing them with this ecological screening analysis.
For chronic disease, SWAN reported positive associations with incident hypertension and diabetes in midlife women, while another prospective study found inverse PFOS and null PFOA hypertension findings28,29,30. A dietary-trial subgroup associated PFOA and PFHxS with weight regain, although PFAS exposure was not randomized31. A pregnancy cohort found no significant association with childhood asthma incidence, and an NHANES asthma study found nominal attack associations that did not survive correction32,33. These endpoints differ from modeled adult county prevalence.
Our separate cholesterol results agree in direction with longitudinal studies in older Swedish adults, midlife women, British twins and a highly exposed Italian population34,35,36,37. The twin study’s published correction concerns group labels, not the lipid-association summary used here. Detailed lipid and mixture studies also found cholesterol associations, with differences across lipid fractions38,39. A lifestyle intervention changed cholesterol and circulating PFAS, showing why timing and shared behavioral changes remain relevant40. Several cited papers share SWAN, Multiethnic Cohort or NHANES participants and are not independent population replications.
Several choices improved reliability. I used exact chemical filters and date filters, averaged measurements before summarizing counties, explained how to handle nondetects, kept consistent cancer periods and sex definitions. I also used socioeconomic adjustments, planned corrections for multiple testing, did spatial checks and sensitivity analyses that did not exclude records based on significance. Source manifest and automated tests make work reproducible.
The largest limitations came from the available data. Monitoring was not random and county coverage was incomplete; I lacked residential history and distribution history of water. Exposure to PFAS before 2016 was not measured; cancer takes a long time to develop. Modeling of PLACES outcomes and tract exposure depended on distance to wells; some county-level samples were small, and unmeasured confounding was still possible. The nearest-neighbor graph and spatial-error model were choices, not the only possible methods. The spatial analyses served as sensitivity checks rather than replacements for long-term individual data.
Income and current smoking cannot fully control cancer-specific factors such as occupational exposure, alcohol, viral hepatitis, reproductive history, obesity or kidney function. The inverse sensitivity findings do not establish protection and may reflect exposure construction, residual confounding or modeled outcome data.
Stronger follow-up studies would connect residential histories to service areas of water systems and older PFAS records and measure exposure before following cancer outcomes. Cases of kidney and testicular cancer need to be sufficient to study latency and individual confounders need to be collected. Prospective or case-control designs would work better for cancer outcomes. For other outcomes, biomarkers and clinical measurements would be more useful than prevalence modeled at the area level.
After correction for multiple testing, the primary California public-water analyses found no statistically significant associations for 19 county cancer outcomes, six county chronic-disease outcomes, or the 12 tract compound-outcome coefficients. Twelve cancer compound-outcome models showed geographically clustered residuals, but none of the follow-up spatial-error PFAS coefficients remained statistically significant after correction. A separate survey-weighted NHANES analysis found positive associations of total serum PFOA and PFOS with total cholesterol. Separate coefficients remained FDR-significant after capping extreme values, but neither joint coefficient survived correction. Seven inverse county sensitivity coefficients and an inverse PFOS-obesity coefficient at 20 km survived correction. Analyses of California and NHANES ask different questions and neither proves causation. Results do not show PFAS are safe and they do not show that PFAS caused cancer or disease among the populations studied here.
Acknowledgments
I would like to express my deepest gratitude to my mentor, Tejinder Pal Khaket (Research Scientist at Stanford University, School of Medicine), for his invaluable guidance, patience, and support throughout this research project. From refining my initial hypothesis and guiding my research approach with various methods, models, data and Python programming to manuscript revisions, his mentorship was instrumental at every step. His encouragement all along made this project possible and sparked my long-term interest in scientific inquiry.
No external funding supported this study, and I declare no competing interests. LLM tools were used to assist with coding review, document formatting, and consistency checks. I reviewed the analysis code, scientific claims, references, and final manuscript and take responsibility for the work.
Supplementary Information
References
- International Agency for Research on Cancer. Perfluorooctanoic acid (PFOA) and perfluorooctanesulfonic acid (PFOS). IARC Monographs. Vol. 135, 2025, https://monographs.iarc.who.int/news-events/volume-135-perfluorooctanoic-acid-pfoa-and-perfluorooctanesulfonic-acid-pfos/. [↩] [↩]
- Agency for Toxic Substances and Disease Registry. How PFAS impacts your health. 2025, https://www.atsdr.cdc.gov/pfas/about/health-effects.html. [↩] [↩]
- U.S. Environmental Protection Agency. Per- and polyfluoroalkyl substances (PFAS) national primary drinking water regulation. 89 FR 32532, 2024, https://www.epa.gov/sdwa/and-polyfluoroalkyl-substances-pfas. [↩]
- U.S. Environmental Protection Agency. Proposed PFOA and PFOS compliance extension rule. 2026, https://www.epa.gov/sdwa/proposed-pfoa-and-pfos-compliance-extension-rule. [↩]
- K. Steenland, S. Tinker, S. Frisbee, A. Ducatman, V. Vaccarino. Association of perfluorooctanoic acid and perfluorooctane sulfonate with serum lipids among adults living near a chemical plant. American Journal of Epidemiology. Vol. 170, pg. 1268–1278, 2009, https://doi.org/10.1093/aje/kwp279. [↩] [↩]
- S. Li, P. Oliva, L. Zhang, J. A. Goodrich, R. McConnell, D. V. Conti, L. Chatzi, M. Aung. Associations between per- and polyfluoroalkyl substances (PFAS) and county-level cancer incidence between 2016 and 2021 and incident cancer burden attributable to PFAS in drinking water in the United States. Journal of Exposure Science & Environmental Epidemiology. Vol. 35, pg. 425–436, 2025, https://doi.org/10.1038/s41370-024-00742-2. [↩] [↩]
- California State Water Resources Control Board. GAMA Groundwater Information System and Drinking Water Watch. Accessed 2026, https://www.waterboards.ca.gov/gama/gama-gis.html and https://sdwis.waterboards.ca.gov/PDWW/. [↩]
- National Cancer Institute and Centers for Disease Control and Prevention. State Cancer Profiles: California age-adjusted incidence rates, 2018–2022. Accessed 2026, https://statecancerprofiles.cancer.gov/. [↩]
- Centers for Disease Control and Prevention. PLACES methodology. 2025, https://www.cdc.gov/places/methodology/. [↩] [↩]
- K. J. Greenlund, H. Lu, Y. Wang, K. A. Matthews, J. M. LeClercq, B. Lee, S. A. Carlson. PLACES: Local data for better health. Preventing Chronic Disease. Vol. 19, pg. 210459, 2022, https://doi.org/10.5888/pcd19.210459. [↩] [↩]
- U.S. Census Bureau. 2022 American Community Survey five-year estimates and 2023 Census Gazetteer Files, https://www.census.gov/programs-surveys/acs/data/summary-file.2022.html and https://www.census.gov/geographies/reference-files/time-series/geo/gazetteer-files.2023.html. [↩]
- P. A. P. Moran. Notes on continuous stochastic phenomena. Biometrika. Vol. 37, pg. 17–23, 1950, https://doi.org/10.2307/2332142. [↩]
- National Center for Health Statistics. NHANES tutorials: Sample design, weighting, and variance estimation. Accessed 2026, https://wwwn.cdc.gov/nchs/nhanes/tutorials/. [↩]
- National Center for Health Statistics. NHANES 2015–2016 and 2017–2018 perfluoroalkyl and polyfluoroalkyl substances laboratory data documentation. 2018 and 2020, https://wwwn.cdc.gov/Nchs/Data/Nhanes/Public/2015/DataFiles/PFAS_I.htm and https://wwwn.cdc.gov/Nchs/Data/Nhanes/Public/2017/DataFiles/PFAS_J.htm. [↩] [↩]
- National Academies of Sciences, Engineering, and Medicine. Guidance on PFAS exposure, testing, and clinical follow-up. The National Academies Press, 2022, https://doi.org/10.17226/26156. [↩]
- S. Karasaki, H. S. Iyer, A. I. Phipps, T. VoPham. Per- and polyfluoroalkyl substances in drinking water and cancer prevalence in the United States. Environmental Health. Vol. 25(1), pg. 19, 2026, https://doi.org/10.1186/s12940-026-01272-0. [↩]
- K. L. Smalling, K. M. Romanok, P. M. Bradley, M. C. Morriss, J. L. Gray, L. K. Kanagy, S. E. Gordon, B. M. Williams, S. E. Breitmeyer, D. K. Jones, L. A. DeCicco, C. A. Eagles-Smith, T. Wagner. Per- and polyfluoroalkyl substances (PFAS) in United States tapwater: Comparison of underserved private-well and public-supply exposures and associated health implications. Environment International. Vol. 178, pg. 108033, 2023, https://doi.org/10.1016/j.envint.2023.108033. [↩]
- A. K. Tokranov, K. M. Ransom, L. M. Bexfield, B. D. Lindsey, E. Watson, D. I. Dupuy, P. E. Stackelberg, M. S. Fram, S. A. Voss, J. A. Kingsbury, B. C. Jurgens, K. L. Smalling, P. M. Bradley. Predictions of groundwater PFAS occurrence at drinking water supply depths in the United States. Science. Vol. 386(6723), pg. 748-755, 2024, https://doi.org/10.1126/science.ado6638. [↩]
- K. L. Smalling, P. M. Bradley, K. M. Romanok, S. M. Elliot, J. de Lambert, M. J. Focazio, S. E. Gordon, J. L. Gray, L. K. Kanagy, M. L. Hladik, K. A. Loftin, R. B. McCleskey, E. K. Medlock-Kakaley, M. C. Cardon, N. Evans, C. P. Weis. Exposures and potential health implications of contaminant mixtures in linked source water, finished drinking water, and tapwater from public-supply drinking water systems in Minneapolis/St. Paul area, USA. Environmental Science: Water Research & Technology. Vol. 9(7), pg. 1813-1828, 2023, https://doi.org/10.1039/d3ew00066d. [↩]
- J. M. Liddie, L. A. Schaider, E. M. Sunderland. Sociodemographic factors are associated with the abundance of PFAS sources and detection in U.S. community water systems. Environmental Science & Technology. Vol. 57(21), pg. 7902-7912, 2023, https://doi.org/10.1021/acs.est.2c07255. [↩]
- J. J. Shearer, C. L. Callahan, A. M. Calafat, W. Y. Huang, R. R. Jones, V. S. Sabbisetti, N. D. Freedman, J. N. Sampson, D. T. Silverman, M. P. Purdue, J. N. Hofmann. Serum concentrations of per- and polyfluoroalkyl substances and risk of renal cell carcinoma. Journal of the National Cancer Institute. Vol. 113(5), pg. 580-587, 2021, https://doi.org/10.1093/jnci/djaa143. [↩]
- J. Rhee, V. C. Chang, I. Cheng, A. M. Calafat, J. C. Botelho, J. J. Shearer, J. N. Sampson, V. W. Setiawan, L. R. Wilkens, D. T. Silverman, M. P. Purdue, J. N. Hofmann. Serum concentrations of per- and polyfluoroalkyl substances and risk of renal cell carcinoma in the Multiethnic Cohort Study. Environment International. Vol. 180, pg. 108197, 2023, https://doi.org/10.1016/j.envint.2023.108197. [↩]
- A. Winquist, J. M. Hodge, W. R. Diver, J. L. Rodriguez, A. N. Troeschel, J. Daniel, L. R. Teras. Case-cohort study of the association between PFAS and selected cancers among participants in the American Cancer Society’s Cancer Prevention Study II LifeLink cohort. Environmental Health Perspectives. Vol. 131(12), pg. 127007, 2023, https://doi.org/10.1289/EHP13174. [↩]
- J. A. Goodrich, D. Walker, X. Lin, H. Wang, T. Lim, R. McConnell, D. V. Conti, L. Chatzi, V. W. Setiawan. Exposure to perfluoroalkyl substances and risk of hepatocellular carcinoma in a multiethnic cohort. JHEP Reports. Vol. 4(10), pg. 100550, 2022, https://doi.org/10.1016/j.jhepr.2022.100550. [↩]
- C. Z. Watling, J. L. Petrick, B. I. Graubard, X. Zhang, M. J. Barnett, J. E. Buring, Y. Chen, A. H. Eliassen, M. Gaziano, J. H. Kang, J. Koshiol, W. Y. Huang, I. M. Lee, S. C. Moore, L. A. Mucci, M. L. Neuhouser, C. C. Newton, J. R. Palmer, L. Rosenberg, H. D. Sesso, M. Shrubsole, L. Tinker, M. Triplette, C. Y. Um, K. Visvanathan, J. Wactawski-Wende, W. Willett, F. Wu, W. Zheng, J. Hofmann, M. P. Purdue, P. T. Campbell, D. Barupal, K. A. McGlynn. Circulating per- and polyfluoroalkyl substances and liver cancer risk: a nested case-control analysis of individual participant data from 12 prospective cohorts. Environmental Health Perspectives. Published online May 21, 2025, https://doi.org/10.1289/EHP16980. [↩]
- M. P. Purdue, J. Rhee, H. Denic-Roberts, K. A. McGlynn, C. Byrne, J. Sampson, J. C. Botelho, A. M. Calafat, J. Rusiecki. A nested case-control study of serum per- and polyfluoroalkyl substances and testicular germ cell tumors among U.S. Air Force servicemen. Environmental Health Perspectives. Vol. 131(7), pg. 077007, 2023, https://doi.org/10.1289/EHP12603. [↩]
- M. van Gerwen, E. Colicino, H. Guan, G. Dolios, G. N. Nadkarni, R. C. H. Vermeulen, M. S. Wolff, M. Arora, E. M. Genden, L. M. Petrick. Per- and polyfluoroalkyl substances (PFAS) exposure and thyroid cancer risk. EBioMedicine. Vol. 97, pg. 104831, 2023, https://doi.org/10.1016/j.ebiom.2023.104831. [↩]
- N. Ding, C. A. Karvonen-Gutierrez, B. Mukherjee, A. M. Calafat, S. D. Harlow, S. K. Park. Per- and polyfluoroalkyl substances and incident hypertension in multi-racial/ethnic women: the Study of Women’s Health Across the Nation. Hypertension. Vol. 79(8), pg. 1876-1886, 2022, https://doi.org/10.1161/HYPERTENSIONAHA.121.18809. [↩]
- S. K. Park, X. Wang, N. Ding, C. A. Karvonen-Gutierrez, A. M. Calafat, W. H. Herman, B. Mukherjee, S. D. Harlow. Per- and polyfluoroalkyl substances and incident diabetes in midlife women: the Study of Women’s Health Across the Nation (SWAN). Diabetologia. Vol. 65(7), pg. 1157-1168, 2022, https://doi.org/10.1007/s00125-022-05695-5. [↩]
- Z. Zhang, F. Wang, Y. Zhang, J. Yao, J. Bi, J. He, S. Zhang, Y. Wei, H. Guo, X. Zhang, M. He. Associations of serum PFOA and PFOS levels with incident hypertension risk and change of blood pressure levels. Environmental Research. Vol. 212(Pt B), pg. 113293, 2022, https://doi.org/10.1016/j.envres.2022.113293. [↩]
- P. Grandjean, A. Meddis, F. Nielsen, A. Sjödin, M. F. Hjorth, A. Astrup, E. Budtz-Jørgensen. Weight loss relapse associated with exposure to perfluorinated alkylate substances. Obesity. Vol. 31(6), pg. 1686-1696, 2023, https://doi.org/10.1002/oby.23755. [↩]
- L. M. Zell-Baran, C. Venter, D. Dabelea, J. M. Norris, D. H. Glueck, J. L. Adgate, J. M. Brown, A. M. Calafat, K. Pickett-Nairne, A. P. Starling. Prenatal exposure to poly- and perfluoroalkyl substances and the incidence of asthma in early childhood. Environmental Research. Vol. 239(Pt 1), pg. 117311, 2023, https://doi.org/10.1016/j.envres.2023.117311. [↩]
- A. J. Burbank, R. C. Fry, C. A. Keet. Associations between serum per- and polyfluoroalkyl substances and asthma morbidity in the National Health and Nutrition Examination Survey (2003-18). The Journal of Allergy and Clinical Immunology: Global. Vol. 2(2), pg. 100078, 2023, https://doi.org/10.1016/j.jacig.2023.100078. [↩]
- L. Dunder, P. M. Lind, S. Salihovic, J. Stubleski, A. Kärrman, L. Lind. Changes in plasma levels of per- and polyfluoroalkyl substances (PFAS) are associated with changes in plasma lipids – A longitudinal study over 10 years. Environmental Research. Vol. 211, pg. 112903, 2022, https://doi.org/10.1016/j.envres.2022.112903. [↩]
- H. Kang, N. Ding, C. A. Karvonen-Gutierrez, B. Mukherjee, A. M. Calafat, S. K. Park. Per- and polyfluoroalkyl substances (PFAS) and lipid trajectories in women 45-56 years of age: the Study of Women’s Health Across the Nation. Environmental Health Perspectives. Vol. 131(8), pg. 087004, 2023, https://doi.org/10.1289/EHP12351. [↩]
- Y. N. Raza, J. S. E. Moustafa, X. Zhang, D. Wang, M. Tomlinson, M. Falchi, C. Menni, R. C. E. Bowyer, C. J. Steves, K. S. Small. Longitudinal association of perfluorooctanoic acid (PFOA) and perfluorooctanesulfonic acid (PFOS) exposure with lipid traits, in a healthy unselected population. Journal of Exposure Science & Environmental Epidemiology. Vol. 35(6), pg. 1060-1068, 2025, https://doi.org/10.1038/s41370-025-00773-3. Published correction: https://doi.org/10.1038/s41370-025-00792-0. [↩]
- E. Batzella, T. Fletcher, G. Pitter, F. da Re, F. Russo, A. di Nisio, C. Canova. Decreases in serum PFAS are associated with decreases in serum lipids: A longitudinal study on a highly exposed population. Science of the Total Environment. Vol. 954, pg. 176227, 2024, https://doi.org/10.1016/j.scitotenv.2024.176227. [↩]
- M. Haug, L. Dunder, P. M. Lind, L. Lind, S. Salihovic. Associations of perfluoroalkyl substances (PFAS) with lipid and lipoprotein profiles. Journal of Exposure Science & Environmental Epidemiology. Vol. 33(5), pg. 757-765, 2023, https://doi.org/10.1038/s41370-023-00545-x. [↩]
- Y. Liu, H. Zhang, F. Xu, X. Zhang, N. Zhao, L. Ding. Associations between serum per- and polyfluoroalkyl substances as mixtures and lipid levels: A cross-sectional study in Jinan. Science of the Total Environment. Vol. 923, pg. 171305, 2024, https://doi.org/10.1016/j.scitotenv.2024.171305. [↩]
- S. Morgan, M. A. Mottaleb, M. P. Kraemer, D. K. Moser, J. Worley, A. J. Morris, M. C. Petriello. Effect of lifestyle-based lipid lowering interventions on the relationship between circulating levels of per-and polyfluoroalkyl substances and serum cholesterol. Environmental Toxicology and Pharmacology. Vol. 98, pg. 104062, 2023, https://doi.org/10.1016/j.etap.2023.104062. [↩]