

Abstract
Astrocytoma, IDH-mutant, CNS WHO grade 4 arises from a lower-grade astrocytoma, shows less necrosis than IDH-wildtype glioblastoma, and is associated with longer median survival. How far its growth can be attributed to any single genetic alteration is difficult to test in patients. This paper models two astrocytoma agents that both carry the IDH1 R132H mutation and differ only in TP53 status, in order to isolate the effect of the assigned apoptosis parameter on population growth. Simulations used PhysiCell 1.14.2 on a local installation, with ten seeded replicates per condition and monoculture, well-mixed, position-swapped and identical-parameter control arms. The TP53-mutant population reached a larger final size in every co-culture arm (paired difference in log growth rate 4.6-5.3 x 10⁻⁵ min-1, Cohen’s dz 2.2-3.3), an effect an order of magnitude larger than that obtained between two identically parameterised control populations. However, competition coefficients measured against monoculture at the same random seed all included zero, so the two populations did not measurably affect one another’s growth: the difference is the assigned apoptosis parameter expressing itself, and reproduces the closed-form prediction to within 7%. Because no measured value supports any particular degree of apoptosis suppression, the result is reported as a sensitivity analysis and no variant-specific mechanism is claimed.
Keywords: Astrocytoma, TP53, IDH1 Mutation, Cancer, Physicell, Secondary Glioblastoma, Glioma Progression, Apoptosis Suppression, Tumor Heterogeneity, Agent-Based Modeling, Genomic Instability, Shannon Diversity Index
Introduction
AIDHmut/G4 are a subtype of astrocytomas that arises from previously existing lower grade gliomas, commonly grade 3 astrocytomas. AIDHmut/G4 show less necrosis than IDH-wildtype glioblastoma, are associated with longer median survival1, and develop through a progression process in younger patients rather than de novo. TP53 mutations are present in approximately 60 percent of precursor low-grade astrocytomas, where they are an early detectable alteration2. The TP53 gene has a key role of tumor suppression which prevents uncontrolled cell proliferation that results from DNA damage, while the IDH gene carries prognostic significance. This study asks a narrower question than that clinical literature: holding the IDH1 R132H background fixed, how much of a growth difference follows from the apoptosis parameter assigned to a TP53-mutant agent, and how much of it the simulation can independently establish. With the 2021 WHO change in classification, sGBMs are now referred to as AIDHmut/G4, though morphological similarities with primary glioblastoma remain.
In “Genetic Pathways to Primary and Secondary Glioblastoma” (2007), Ohgaki and Kleihues describe the transition from grade 3 astrocytoma to AIDHmut/G42. They report a TP53 mutation in 65 percent of cases and identify it as the first detectable genetic alteration in precursor lesions; the IDH1 mutation, by contrast, acts on metabolic pathways rather than directly on progression. Primary glioblastomas account for about 90 percent of cases and develop without a prior less malignant lesion, while AIDHmut/G4 arise from low-grade or grade 3 astrocytoma and manifest in younger patients. The TP53 mutations show a high incidence of G:C to A:T transitions at CpG sites, a pattern associated with deamination of 5-methylcytosine and indicative of early malignant transformation and genomic instability.
In “The Definition of Primary and Secondary Glioblastoma” (2013), Ohgaki and Kleihues review the features separating the two entities3. The tumors are often indistinguishable histologically but differ in genetic and epigenetic profile: primary glioblastoma typically carries EGFR amplification, PTEN mutation and chromosome 10 loss, while AIDHmut/G4 characteristically carries IDH1/2 mutation together with TP53 and ATRX mutation and a hypermethylation phenotype. Whole-arm 1p/19q codeletion with an IDH mutation defines oligodendroglioma rather than astrocytoma, which is 1p/19q non-codeleted, and is therefore not a feature of this tumour type. IDH1 mutation is present in over 80 percent of AIDHmut/G4 but is rare in primary glioblastoma, and is usually the earliest detectable alteration, preceding TP53 mutation.
An important side note when reviewing these papers is that in 2021, WHO changed the secondary glioblastoma classification to Astrocytoma IDH Mutant Grade 4. This was done since tumors with IDH mutations and similar morphological features tend to have a different prognosis and response to treatment than those without the IDH mutation, which are classified as glioblastoma. Recent research indicates that glioblastoma does not evolve from a lower-grade astrocytoma and instead develop rapidly de novo, without a precursor lower-grade tumor.
Identification of Gaps in Existing Research
Many studies have highlighted the need to assess both inter-tumor and intra-tumor heterogeneity in order to improve personalized treatment for glioblastoma patients. Work such as Tumor Heterogeneity in Glioblastomas: From Light Microscopy to Molecular Profiling (2021) has approached this over short time horizons4, but longer studies are needed to track how heterogeneity evolves and how different subclones within a tumor respond to therapy over time. Longitudinal data on clonal dynamics and evolutionary patterns would supplement early detection and treatment strategies.
Two modeling approaches illustrate both the promise and the limits of current work. Patient-derived organoids follow tumor evolution over time and capture heterogeneity well, but depend on repeated patient sampling5. Genetically engineered human pluripotent stem cells reproduce tumor heterogeneity and authentic cancer pathobiology, while leaving the clinical implications of specific mutations, and how multiple mutations interact, underexplored6. Addressing those interactions is what would most improve predictions of treatment efficacy and prognosis.
Theoretical Framework
Three theories are most relevant to AIDHmut/G4 and its progression: cancer stem cell theory, multiclonal origin theory, and multi tumorigenesis theory.
Cancer Stem Cell (CSC) theory suggests that a subset of cells within a tumor can self-renew indefinitely and generate the heterogeneous cell populations found in tumors, much as normal stem cells do. It provides an explanation for why tumors recur after treatment, since these stem-like cells can survive conventional therapy through enhanced DNA repair, overexpression of drug efflux transporters and distinctive metabolic pathways7. The theory describes tumors as hierarchically organized with CSCs at the top, giving rise to the differentiated cell types that form the bulk of the tumor and, in doing so, increasing intra-tumoral heterogeneity. This heterogeneity complicates treatment, since subclones differ in their sensitivity to therapy and stem-like cells can repopulate the tumor afterwards8.
CSCs play a key role in the transition from lower-grade astrocytoma to AIDHmut/G4, as mutations in TP53 and IDH1 together with selection of CSCs can drive increased malignancy and aggressiveness. CSC markers such as CD133 and ALDH are associated with a more aggressive disease course and poorer survival outcomes23. This has opened new avenues for targeted therapy, with current strategies aiming to inhibit pathways critical to CSC survival or to target specific CSC markers directly8.
Multiclonal tumor origin theory holds that cancer can arise through distinct cellular pathways, so that different tumor types can form within the same tissue from stem cells, progenitor cells or fully differentiated cells. Multi-region sequencing supports this, showing subclones with unique mutations within the same tumor, and phylogenetic analysis suggests tumors branch into multiple coexisting clones rather than evolving linearly from a single one. This explains why recurrent tumors often differ genetically from the primary tumor, a difference that also underlies therapy resistance and relapse.
Multi tumorigenesis theory relates to AIDHmut/G4 through its origin in pre-existing lower-grade tumors, holding that progression from a lower-grade glioma involves transformations driven by genetic mutations, signaling pathway alterations and the involvement of CSCs, with markers such as IDH1/2 mutation, TP53 mutation and ATRX loss distinguishing the stages.
Molecular Characterisation of Astrocytoma, IDH-Mutant: Primary Evidence
Under the 2021 WHO classification, grade 4 status in IDH-mutant astrocytoma no longer rests on histology alone. In a cohort of 114 IDH-mutant astrocytomas, patients whose tumours carried homozygous CDKN2A deletion had the poorest overall survival and those with hemizygous deletion an intermediate outcome, supporting a grading system that combines deletion status with histological grade9. In a separate series of 136 gliomas reclassified under the 2021 criteria, CDKN2A deletion carried the largest independent hazard ratio of any factor examined, exceeding age, performance status, extent of resection, MGMT methylation and IDH status10, and tumours defined this way remain heterogeneous across clinical, imaging and molecular features11. The present model represents neither CDKN2A/B status, necrosis, nor microvascular proliferation, so grade 4 is assumed for parameterisation rather than demonstrated by the simulation.
Astrocytoma, IDH-mutant, CNS WHO grade 4 remains clinically distinct from IDH-wildtype glioblastoma, and within IDH-mutant gliomas TERT promoter mutation predicts favourable prognosis independently of 1p/19q codeletion12. TP53 and ATRX alterations characterise the astrocytic lineage: ATRX loss was detected in 45% of anaplastic astrocytomas in the NOA-04 biomarker cohort, was almost mutually exclusive with 1p/19q codeletion, and identified tumours with significantly longer time to treatment failure13. ATRX loss is closely associated with the alternative lengthening of telomeres phenotype14, which is enriched alongside SMARCAL1 loss in giant cell glioblastoma15. Neither telomere maintenance nor ATRX status is represented in the present model.
The functional consequence of a TP53 missense mutation is substitution-specific and is not simply an absence of wild-type activity. The hotspot R273H product binds replicating DNA together with PARP1, elevates MCM2 levels and promotes cell proliferation16, and this activity depends on the protein’s C-terminal region17. Where p53-dependent apoptosis does operate in glioma it proceeds through BH3-only effectors such as PUMA, whose restoration sensitises drug-resistant glioblastoma stem cells to temozolomide18 and whose induction drives cell death through mitochondrial routes in glioblastoma models19. Because these are gain-of-function properties that differ between substitutions, the present model does not claim to represent any particular variant and treats the apoptosis parameter as an assumption to be varied rather than a measured property.
The IDH1 R132H substitution produces the oncometabolite D-2-hydroxyglutarate. Conditional knock-in raises haematopoietic progenitor numbers and alters histone and DNA methylation20, and 2-HG additionally suppresses necroptosis through DNMT1-dependent hypermethylation of the RIP3 promoter21. The same metabolic change alters treatment response: inhibiting mutant IDH1 with AGI-5198 was radioprotective in IDH1-mutant cells22. None of these metabolic effects is represented in the model, which differentiates its two agents by apoptosis rate alone.
Intratumoural heterogeneity in these tumours has been characterised directly. Single-cell RNA sequencing of IDH-mutant gliomas resolves a shared developmental hierarchy whose composition differs between astrocytoma and oligodendroglioma23, longitudinal sequencing tracks the genomic changes accompanying malignant transformation in IDH1-mutant glioma24, and mismatch-repair-deficient IDH-mutant astrocytoma has been described as a distinct type with a poor prognosis25. The two agents modelled here are homogeneous by construction, so the diversity index reported below reflects only their relative abundance.
Clinical outcome depends on treatment as well as molecular status. IDH1 mutation and MGMT methylation together predict survival in anaplastic astrocytoma26; a randomised trial of neoadjuvant temozolomide before radiotherapy found no overall survival benefit27; and partial resection offers a survival benefit over biopsy in MGMT-methylated tumours28. Molecular status can increasingly be inferred without surgery, from multiparametric MRI29 or from FET-PET in gliomas graded under the 2021 criteria30. The model contains no treatment, imaging or resection component and bears on none of these. Agent-based modelling is nevertheless an established approach to the growth question it does address: PhysiCell couples individual cell phenotype to diffusible substrates through finite-difference solution of reaction-diffusion equations31, and comparable hybrid models have been used to study hypoxia-dependent drug and radiation response in the tumour microenvironment32.
Materials and Methods
All computational simulations used PhysiCell version 1.14.2, an open-source, physics-based multicellular simulator31. PhysiCell was compiled from source and executed from the command line on a local installation. The unmodified template sample project was used and no custom C++ was written, so the entire model specification resides in the archived XML configuration and initial-condition CSV. Each run stores a manifest recording its random seed, the PhysiCell version and git commit, the OpenMP thread count and a SHA-256 hash of the configuration used. Employing a lattice-free, off-lattice agent-based modeling framework, PhysiCell has individual cells represented as discrete agents occupying continuous two-dimensional space. Each agent has customizable biophysical properties governing the cell-cycle progression, death behavior, volume dynamics, mechanics, motility, and secretion patterns. Physicell uses finite-difference methods on a Cartesian mesh to solve partial differential equations for diffusible substrates, allowing for dynamic coupling between cell behavior and the local microenvironment.
The simulation’s domain extends from -500 to +500 microns along both the x and y axes. The spatial resolution was 20 micrometers per grid element, which yields a 50 x 50 computational mesh of 2,500 voxels. Simulations are constrained to the z=0 plane, consistent with standard two-dimensional PhysiCell implementations. The simulation time was 7920 minutes saved every 360 minutes, which gives 22 intervals and therefore 23 saved output timepoints once t = 0 and the endpoint are both counted. The diffusion timestep was 0.01 minutes, the mechanics timestep was 0.1 minutes, and the phenotype update timestep was 6 minutes, consistent with PhysiCell default stability requirements.
Two astrocytoma cell types were defined, both carrying the IDH1 R132H mutation and differing only in TP53 status: IDH1-mutant/TP53-wild-type and IDH1-mutant/TP53-mutant. ATRX and CDKN2A/B status are held constant across both and are not represented; CNS WHO grade 4 is assumed for parameterisation and is not demonstrated by the simulation. Each cell type was assigned parameters derived from peer-reviewed in vitro and clinical studies (detailed in Table 1). The Live cycle model was applied uniformly to both cell types. It has a single phase with an exponentially distributed duration and transition rate r, so with apoptosis hazard d the population obeys dN/dt = (r – d)N and the population doubling time is ln(2)/(r – d). The doubling time is therefore neither the mean phase duration nor independent of the death rate.
The wild-type cells reflected the baseline proliferative behavior of diffuse astrocytoma cells in the absence of mutations. Published doubling times are population doubling times and already net out cell loss, so the cycle rate was obtained by inverting the relation above as r = ln(2)/T + d rather than by setting the phase duration equal to the published doubling time. The TP53-wild-type agent was assigned the 4.9-day mean reported for patient-derived IDH1-mutant glioma cultures33, giving r = 1.514 x 10⁻⁴ per minute (mean phase duration 6605 minutes). Setting the phase duration equal to the doubling time instead, as in the previous version of this work, encodes a 3.40-day doubling time in place of the intended 4.90 days34. The apoptosis death rate was set to the PhysiCell default of 5.317×10⁻⁵ per minute, which corresponds to a baseline rate of programmed cell death reflective of normal tumor suppressor activity. The Necrosis parameters were retained at PhysiCell defaults and are driven dynamically by local oxygen concentration.
The TP53-mutant cells are modeled after the loss-of-function mutation in the TP53 tumor suppressor gene. Mutation of TP53 gene inhibits the p53’s ability to induce apoptosis in response to genotoxic stress and DNA damage. In accordance, the apoptosis death rate for TP53-mutant cells was set at 5.317×10⁻⁶, which is 10-fold lower than the TP53-wild-type agent. This factor is an assumption: no study was identified reporting a basal per-minute apoptosis hazard for a named TP53 substitution on an IDH1-mutant background, so it is declared unsourced and varied across a sensitivity analysis rather than asserted. The cycle transition rate was held identical to the TP53-wild-type agent, so the two arms are matched on proliferation by construction and differ only in apoptosis. The TP53-mutant population doubling time of 3.30 days is consequently an output of those two settings rather than an input, and the resulting growth difference is an arithmetic consequence of the parameterisation34.
Model Parameters Summary
| Parameter | Value | Unit | PhysiCell field | Provenance |
| Domain extent | -500 to +500 | µm | domain/x_min, x_max | assumed |
| Voxel size | 20 | µm | domain/dx | default |
| Simulated time | 7920 | min | overall/max_time | assumed |
| Save interval | 360 | min | save/full_data/interval | assumed |
| Saved timepoints | 23 | count | computed, not entered | calculated |
| TP53-wt doubling time | 4.9 | days | input to the conversion | measured (Verheul 2021) |
| TP53-wt cycle rate | 1.514 x 10⁻⁴ | min-1 | cycle[code=5]/phase_transition_rates/rate[0-0] | calculated |
| TP53-wt apoptosis rate | 5.317 x 10⁻⁵ | min-1 | death/model[code=100]/death_rate | default |
| TP53-mut cycle rate | 1.514 x 10⁻⁴ | min-1 | cycle[code=5]/phase_transition_rates/rate[0-0] | assumed (matched to wt) |
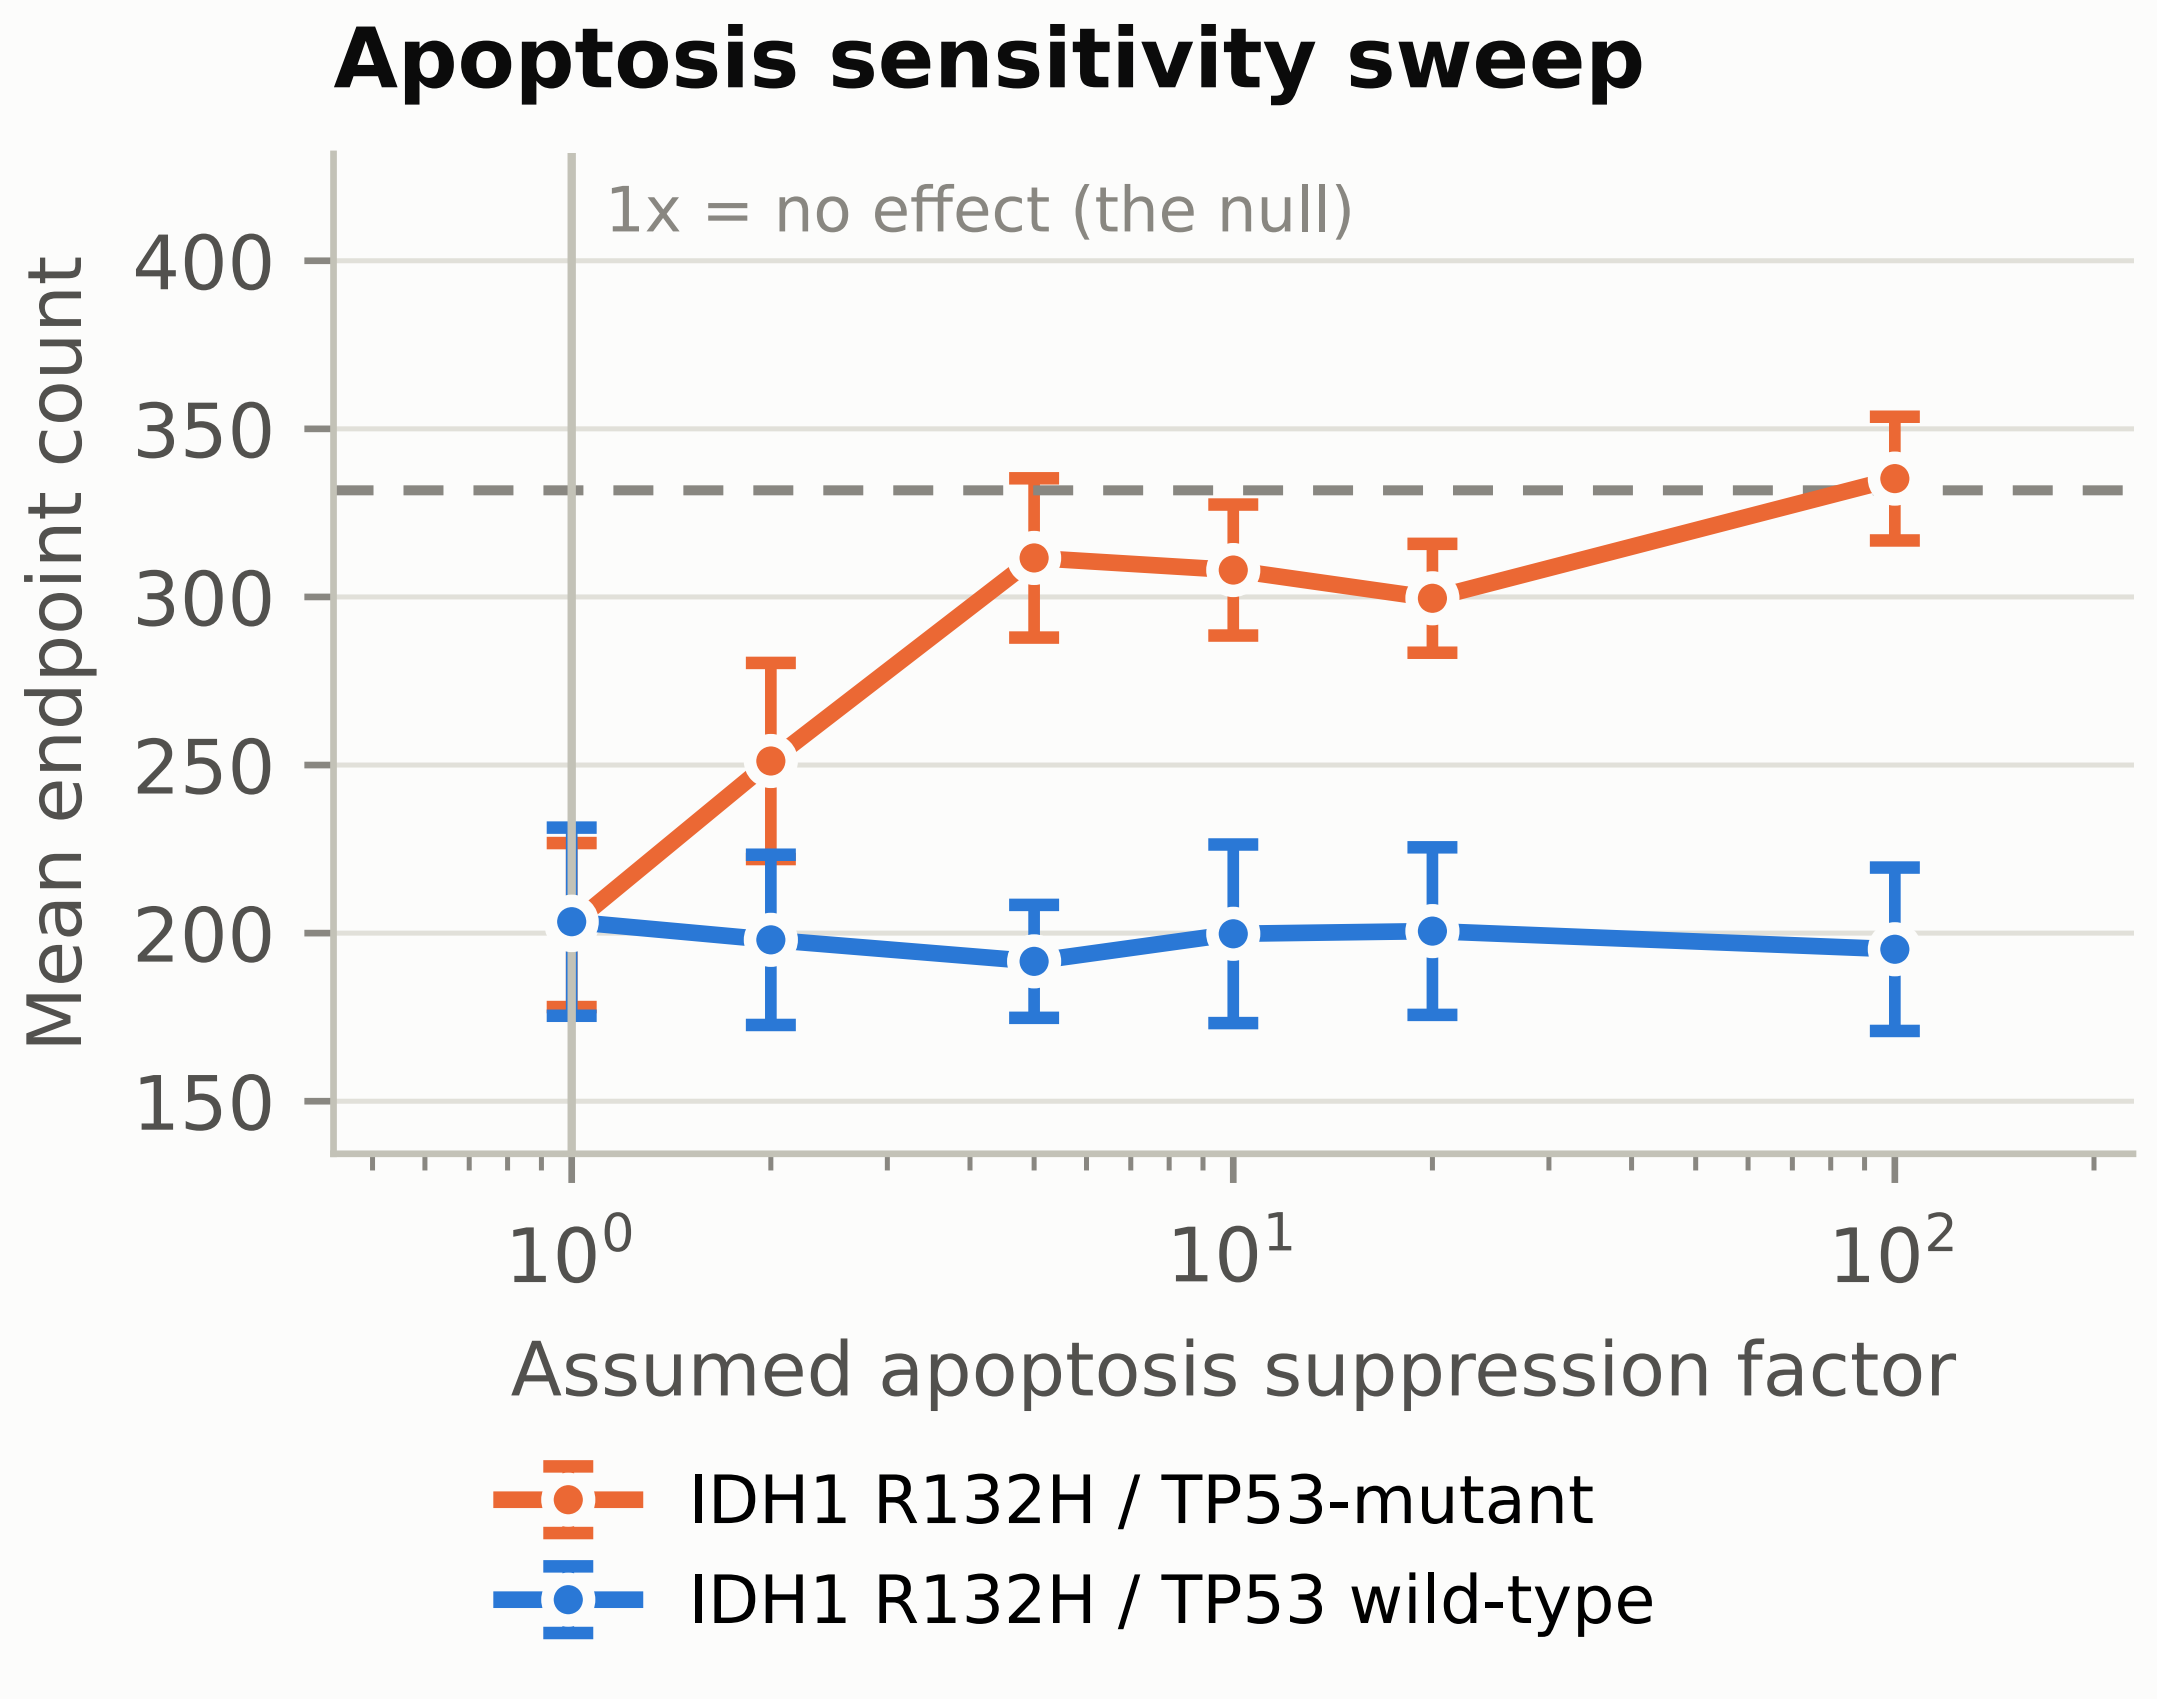
| Apoptosis suppression factor | 10 (swept 1-100) | dimensionless | death/model[code=100]/death_rate | ASSUMED – no source |
| TP53-mut apoptosis rate | 5.317 x 10⁻⁶ | min-1 | death/model[code=100]/death_rate | calculated |
| TP53-mut doubling time | 3.30 | days | OUTPUT, not entered | calculated |
| Oxygen diffusion | 100000 | µm²/min | variable[oxygen]/diffusion_coefficient | default |
| Oxygen decay | 0.1 | min-1 | variable[oxygen]/decay_rate | default |
| Oxygen initial and boundary | 38 | mmHg | initial_condition; Dirichlet_boundary_condition | default |
| Oxygen uptake | 10 | min-1 | secretion/substrate[oxygen]/uptake_rate | default |
| Cell-cell adhesion | 0.4 | µm/min | mechanics/cell_cell_adhesion_strength | default |
| Cell-cell repulsion | 10.0 | µm/min | mechanics/cell_cell_repulsion_strength | default |
| Motility | disabled | – | motility/options/enabled | assumed |
| Cells per population | 100 | count | initial_conditions (CSV) | assumed |
| Seeding disk radius | 50 | µm | initial_conditions (CSV) | assumed |
| Replicates per arm | 10 | count | options/random_seed | assumed |
Note: Cycle durations reflect phase 0-to-0 transition time in the live-cell cycle model.
Microenvironment Configuration
Oxygen was configured to be the sole diffusible substrate in order to model the driver of necrosis in avascular tumor regions. Oxygen diffusion coefficient was set to 100,000 microns µm2/min, and the initial oxygen condition throughout the domain was set to 38 mmHg. Both of these values reflect the diffusion coefficient of oxygen in brain tissue and the physiological oxygen tension in normal brain parenchyma respectively. Dirichlet boundary conditions of 38 mmHg were applied to the domain boundaries in the xy plane. Oxygen gradient calculator and agent-level oxygen tracking are both enabled. Necrosis is triggered automatically by the simulation engine when local oxygen concentration falls below cell-type-specific necrosis threshold and is done to model hypoxia-induced cell death consistent with avascular necrosis observed in high-grade glioma.
Initial Conditions
Cell types were initialized with 100 cells distributed via random fill within a disk of radius 50 microns centered at a distinct spatial coordinate. In the separated co-culture arm the TP53-wild-type population was centred at (-200, 0) and the TP53-mutant population at (200, 0); the position-swapped arm exchanges these, the well-mixed arm seeds both at (0, 0), and each monoculture arm seeds a single population at (0, 0). Separating the groups allows independent initial growth, but because a change in relative abundance between separated populations cannot by itself demonstrate interaction, competition is assessed by comparing growth in co-culture against monoculture at the same seed rather than inferred from the layout. All cells are initialized at z=0.
Data Collection and Output
Simulation output is saved at 360-minute intervals in standard XML and binary .mat format. Each output contained an XML manifest with simulation metadata and current time, a _cells.mat file with per-cell state, position, cell type identifier, volume and cycle phase, and a _microenvironment0.mat file with the substrate concentration at each voxel. 23 output timepoints were captured across the 5.5-day simulation period.
Data Analysis
Post simulation analyses are performed using custom Python scripts employing the pandas (version 2), numpy (version 1.24), matplotlib (version 3.7), scipy (version 1.11), seaborn (version 0.12) and statsmodels (version 0.14) libraries. Cell population data were extracted from the _cells.mat binary files using scipy.io.loadmat, with the cell type identifier in row 5 of the cell data matrix and the oxygen concentration in row 4 of the microenvironment matrix. The run that previously terminated at Day 3.25 through a memory allocation limit on NanoHub was rerun to completion on the local installation rather than excluded. No timepoint was removed from any run in the reported set, and any run that failed to produce all 23 timepoints was rerun rather than trimmed.
We then applied exponential growth regression to each cell population using the model N(t) = N0 exp(rt) (eq1), where N0 represents the initial cell count and r the instantaneous growth rate. Regression is performed using scipy.optimize.curve_fit with initial parameter estimates of N0 = 100 and r = 0.5, and fit is evaluated using the coefficient of determination; doubling times are calculated as ln(2)/r. Statistical comparisons are made between complete runs rather than between timepoints. The primary outcome is the fitted log growth rate per replicate, compared within seed as a paired difference with percentile bootstrap confidence intervals and Cohen’s dz; competition coefficients are the difference between a genotype’s growth rate in co-culture and in monoculture at the same seed. Tumor heterogeneity is quantified using the Shannon diversity index, and spatial analyses include mean and maximum cell displacement from the domain origin, spatial distribution scatter plots and kernel density estimation heatmaps generated using seaborn.kdeplot.
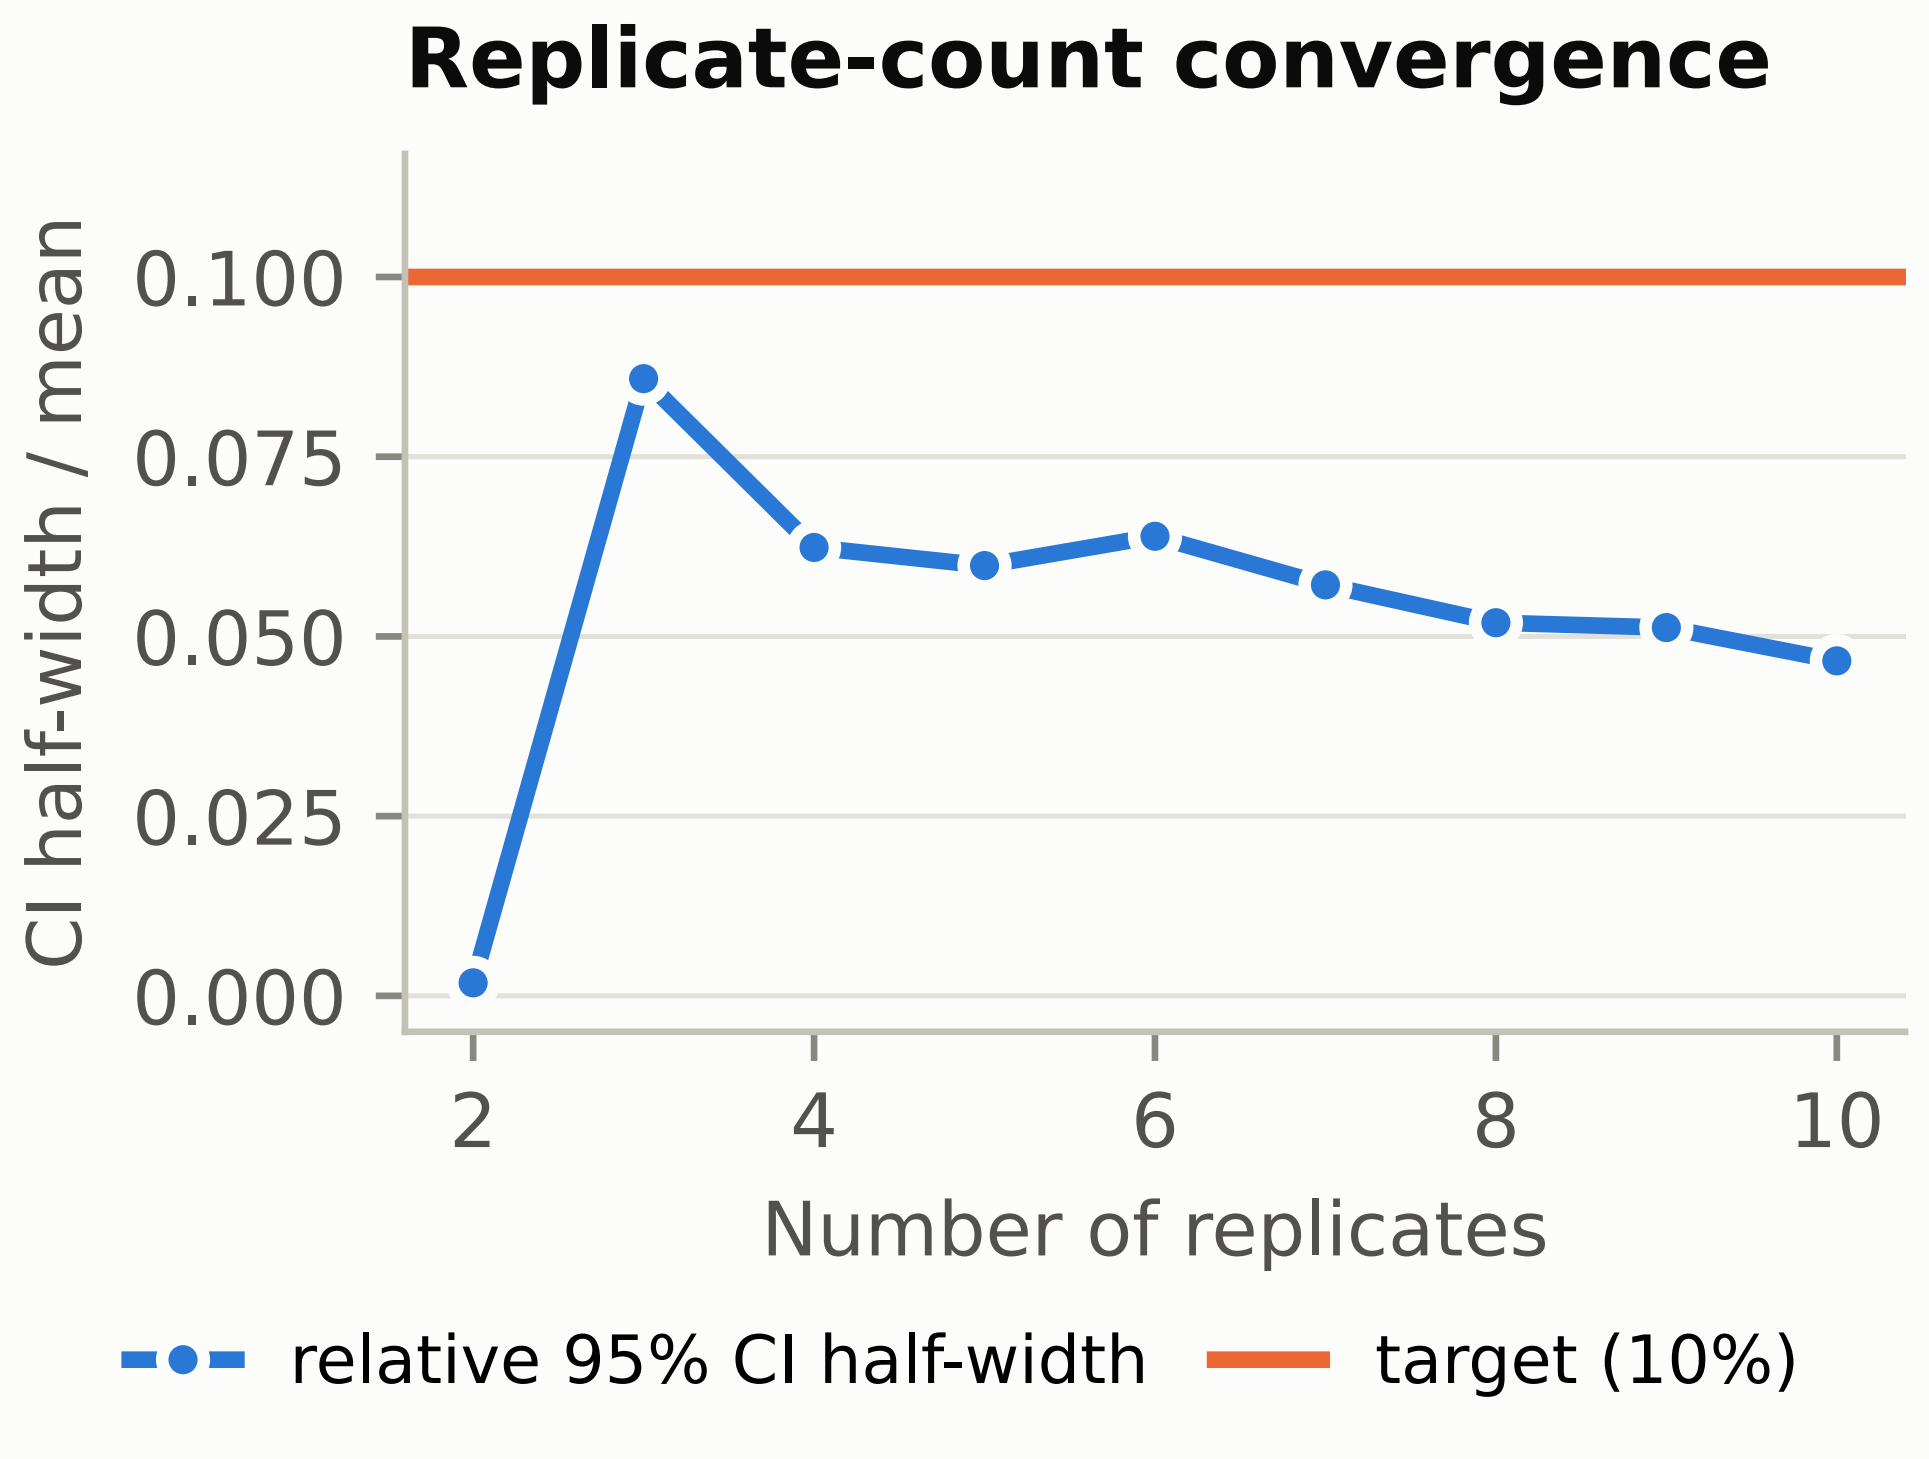
Each condition was run as ten independent replicates differing only in random seed. The determinism assumed in the previous version of this work was tested directly and does not hold: PhysiCell implements a non-zero death rate as a probabilistic event and the Live cycle transition is exponentially distributed rather than fixed-duration, so the trajectory is stochastic beyond initial placement. Across seeds the coefficient of variation in the primary outcome ranged from 7.4% to 18.9% by arm. The unit of analysis is therefore the run and not the timepoint: each run was reduced to replicate-level outcomes before any comparison was made, and arms were compared within seed. Replicate count was set by a convergence check rather than by convention, the relative half-width of the 95% confidence interval falling to 4.7% at n = 10.
Results
Overall Population Dynamics
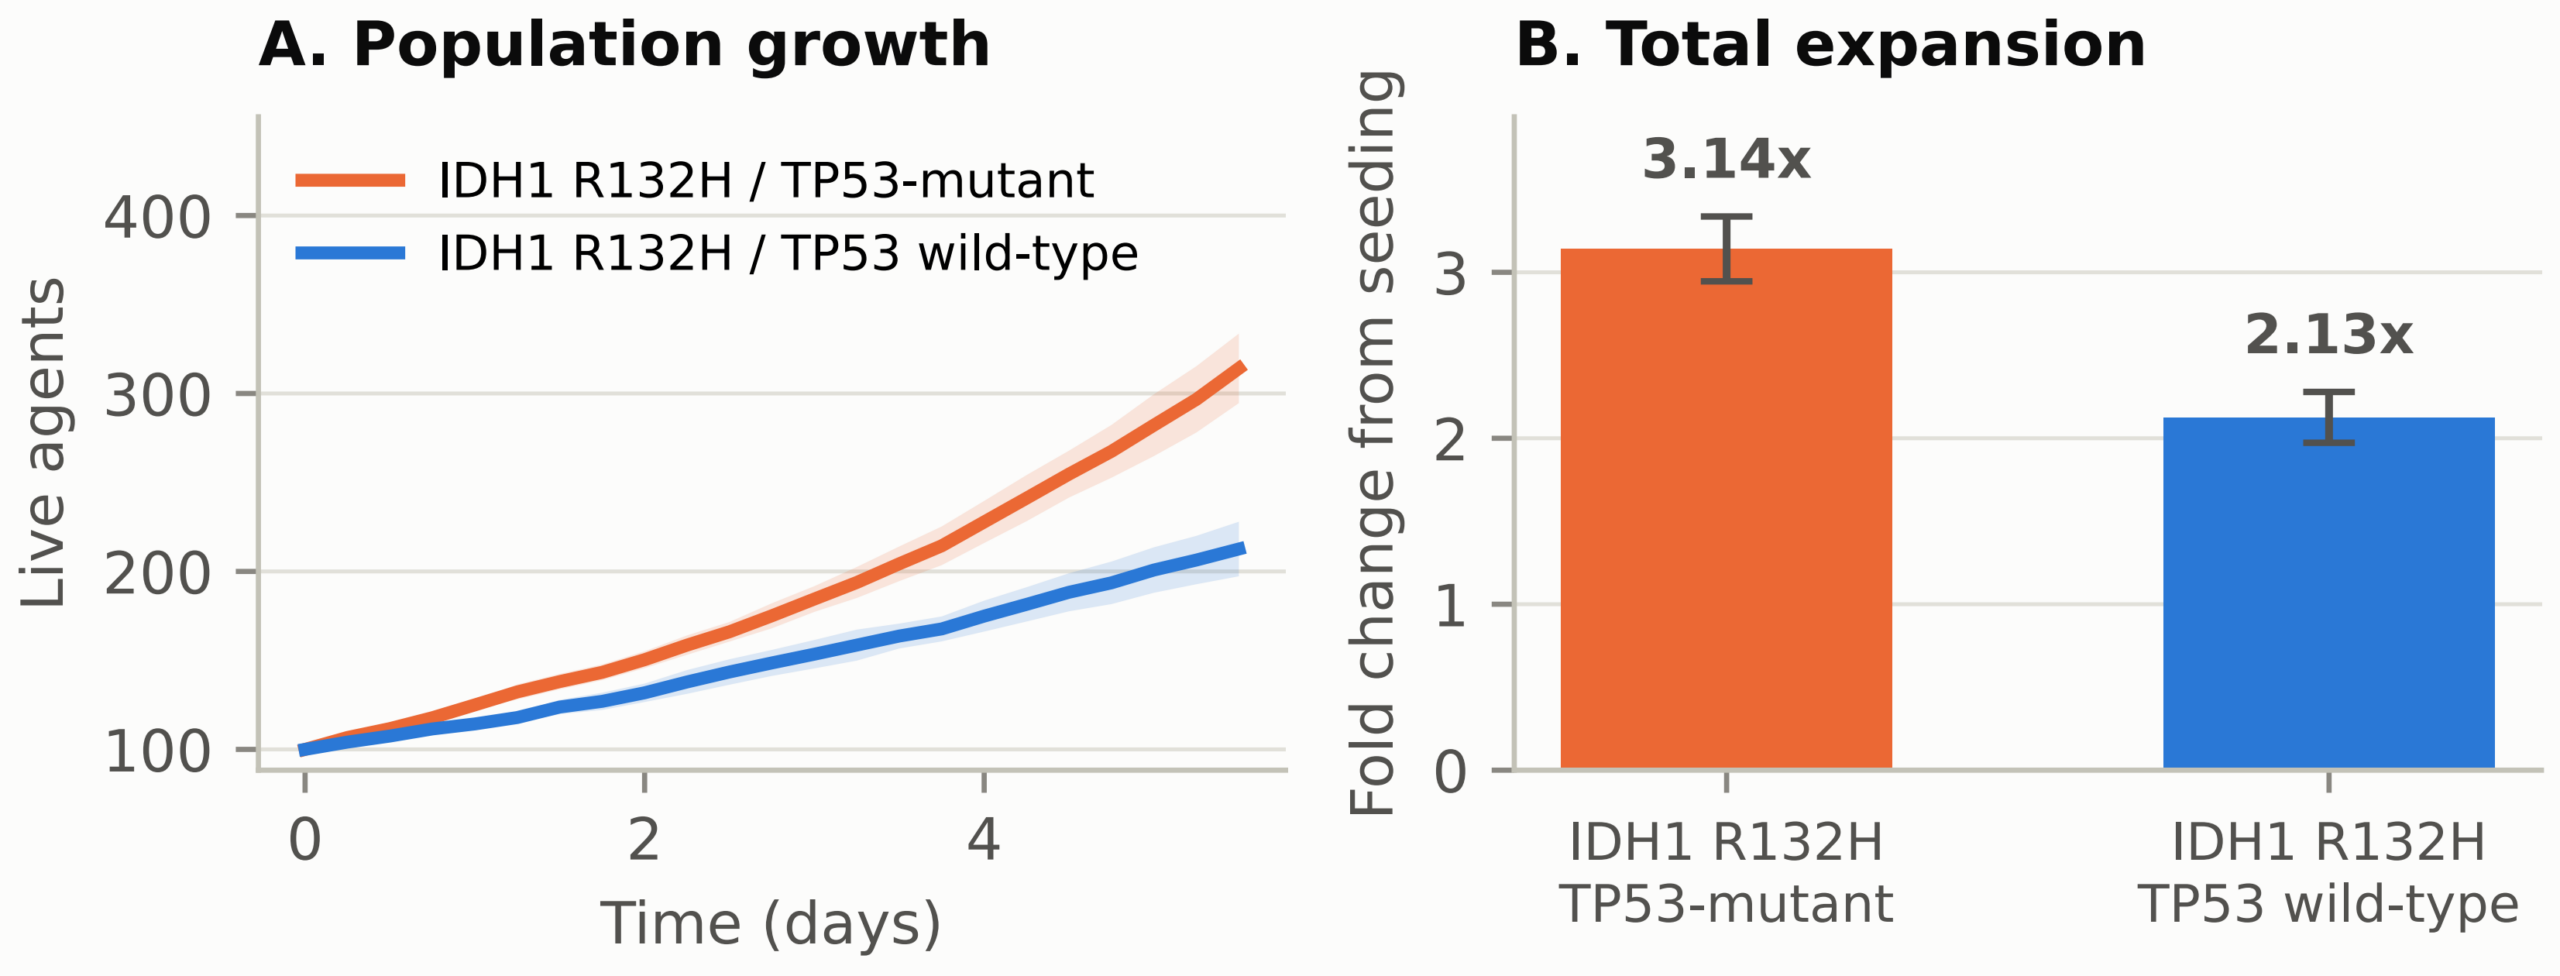
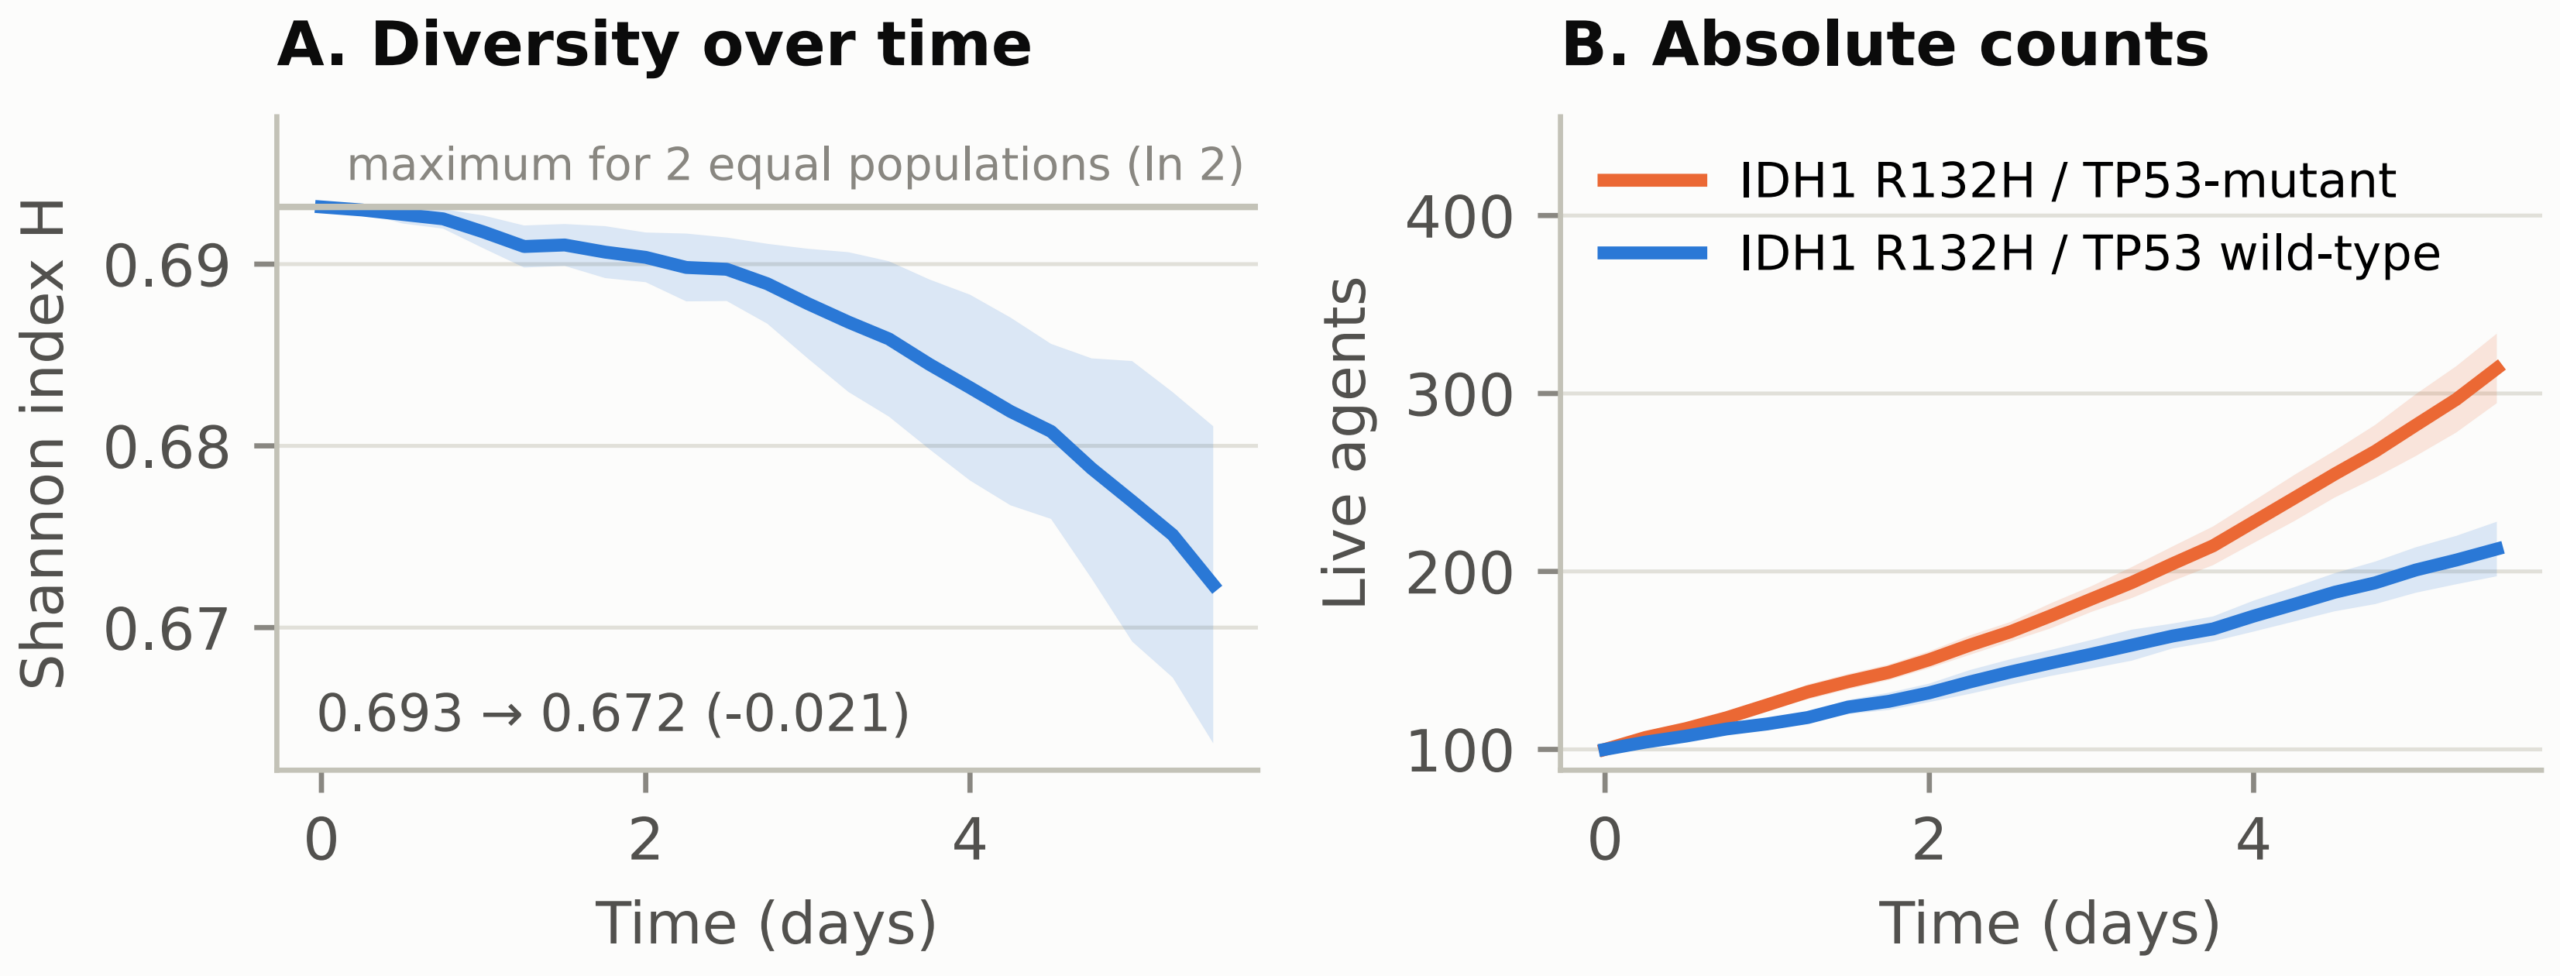
Over the 5.5 day simulation period, each cell population had a different growth trajectory that aligns with their differential biological parameterizations. The TP53-mutant population expanded 3.14-fold (SD 0.32) and the TP53-wild-type population 2.13-fold (SD 0.25), reaching mean endpoint counts of 314.1 and 212.6 agents. These values differ by roughly two orders of magnitude from those previously reported (236-fold and 131-fold); that discrepancy is fully accounted for by the cycle-rate error described in the Methods, since a 1440-minute phase duration predicts a 234.6-fold expansion over 5.5 days by closed form. The difference between the two arms follows from the assigned apoptosis parameter and is not an independent finding of the simulation.
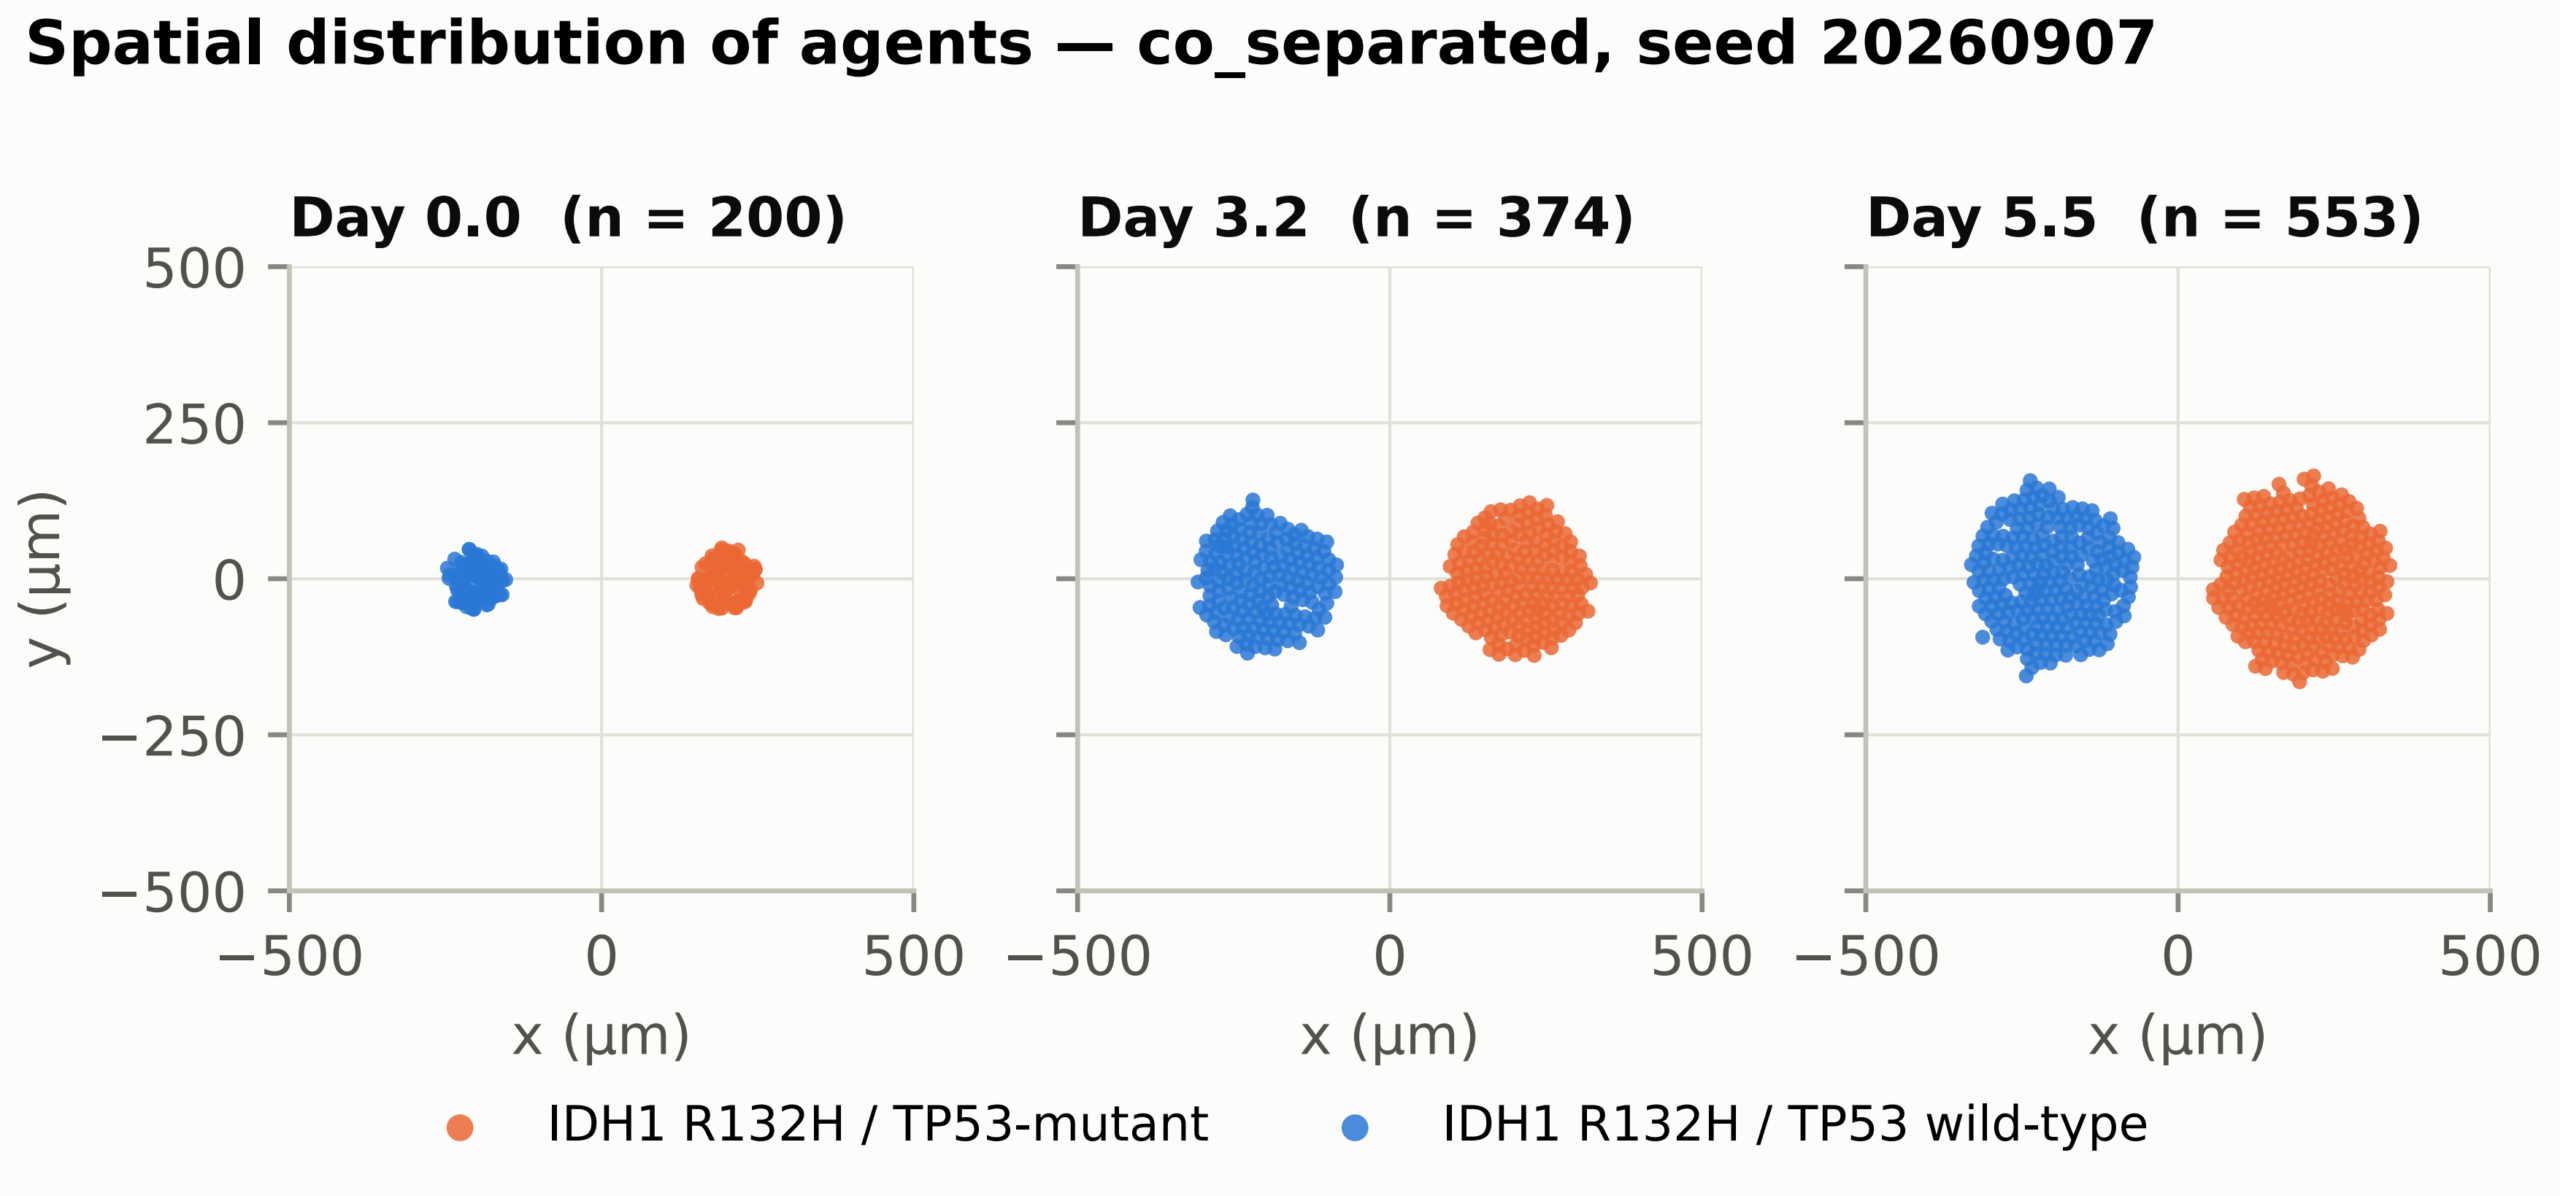
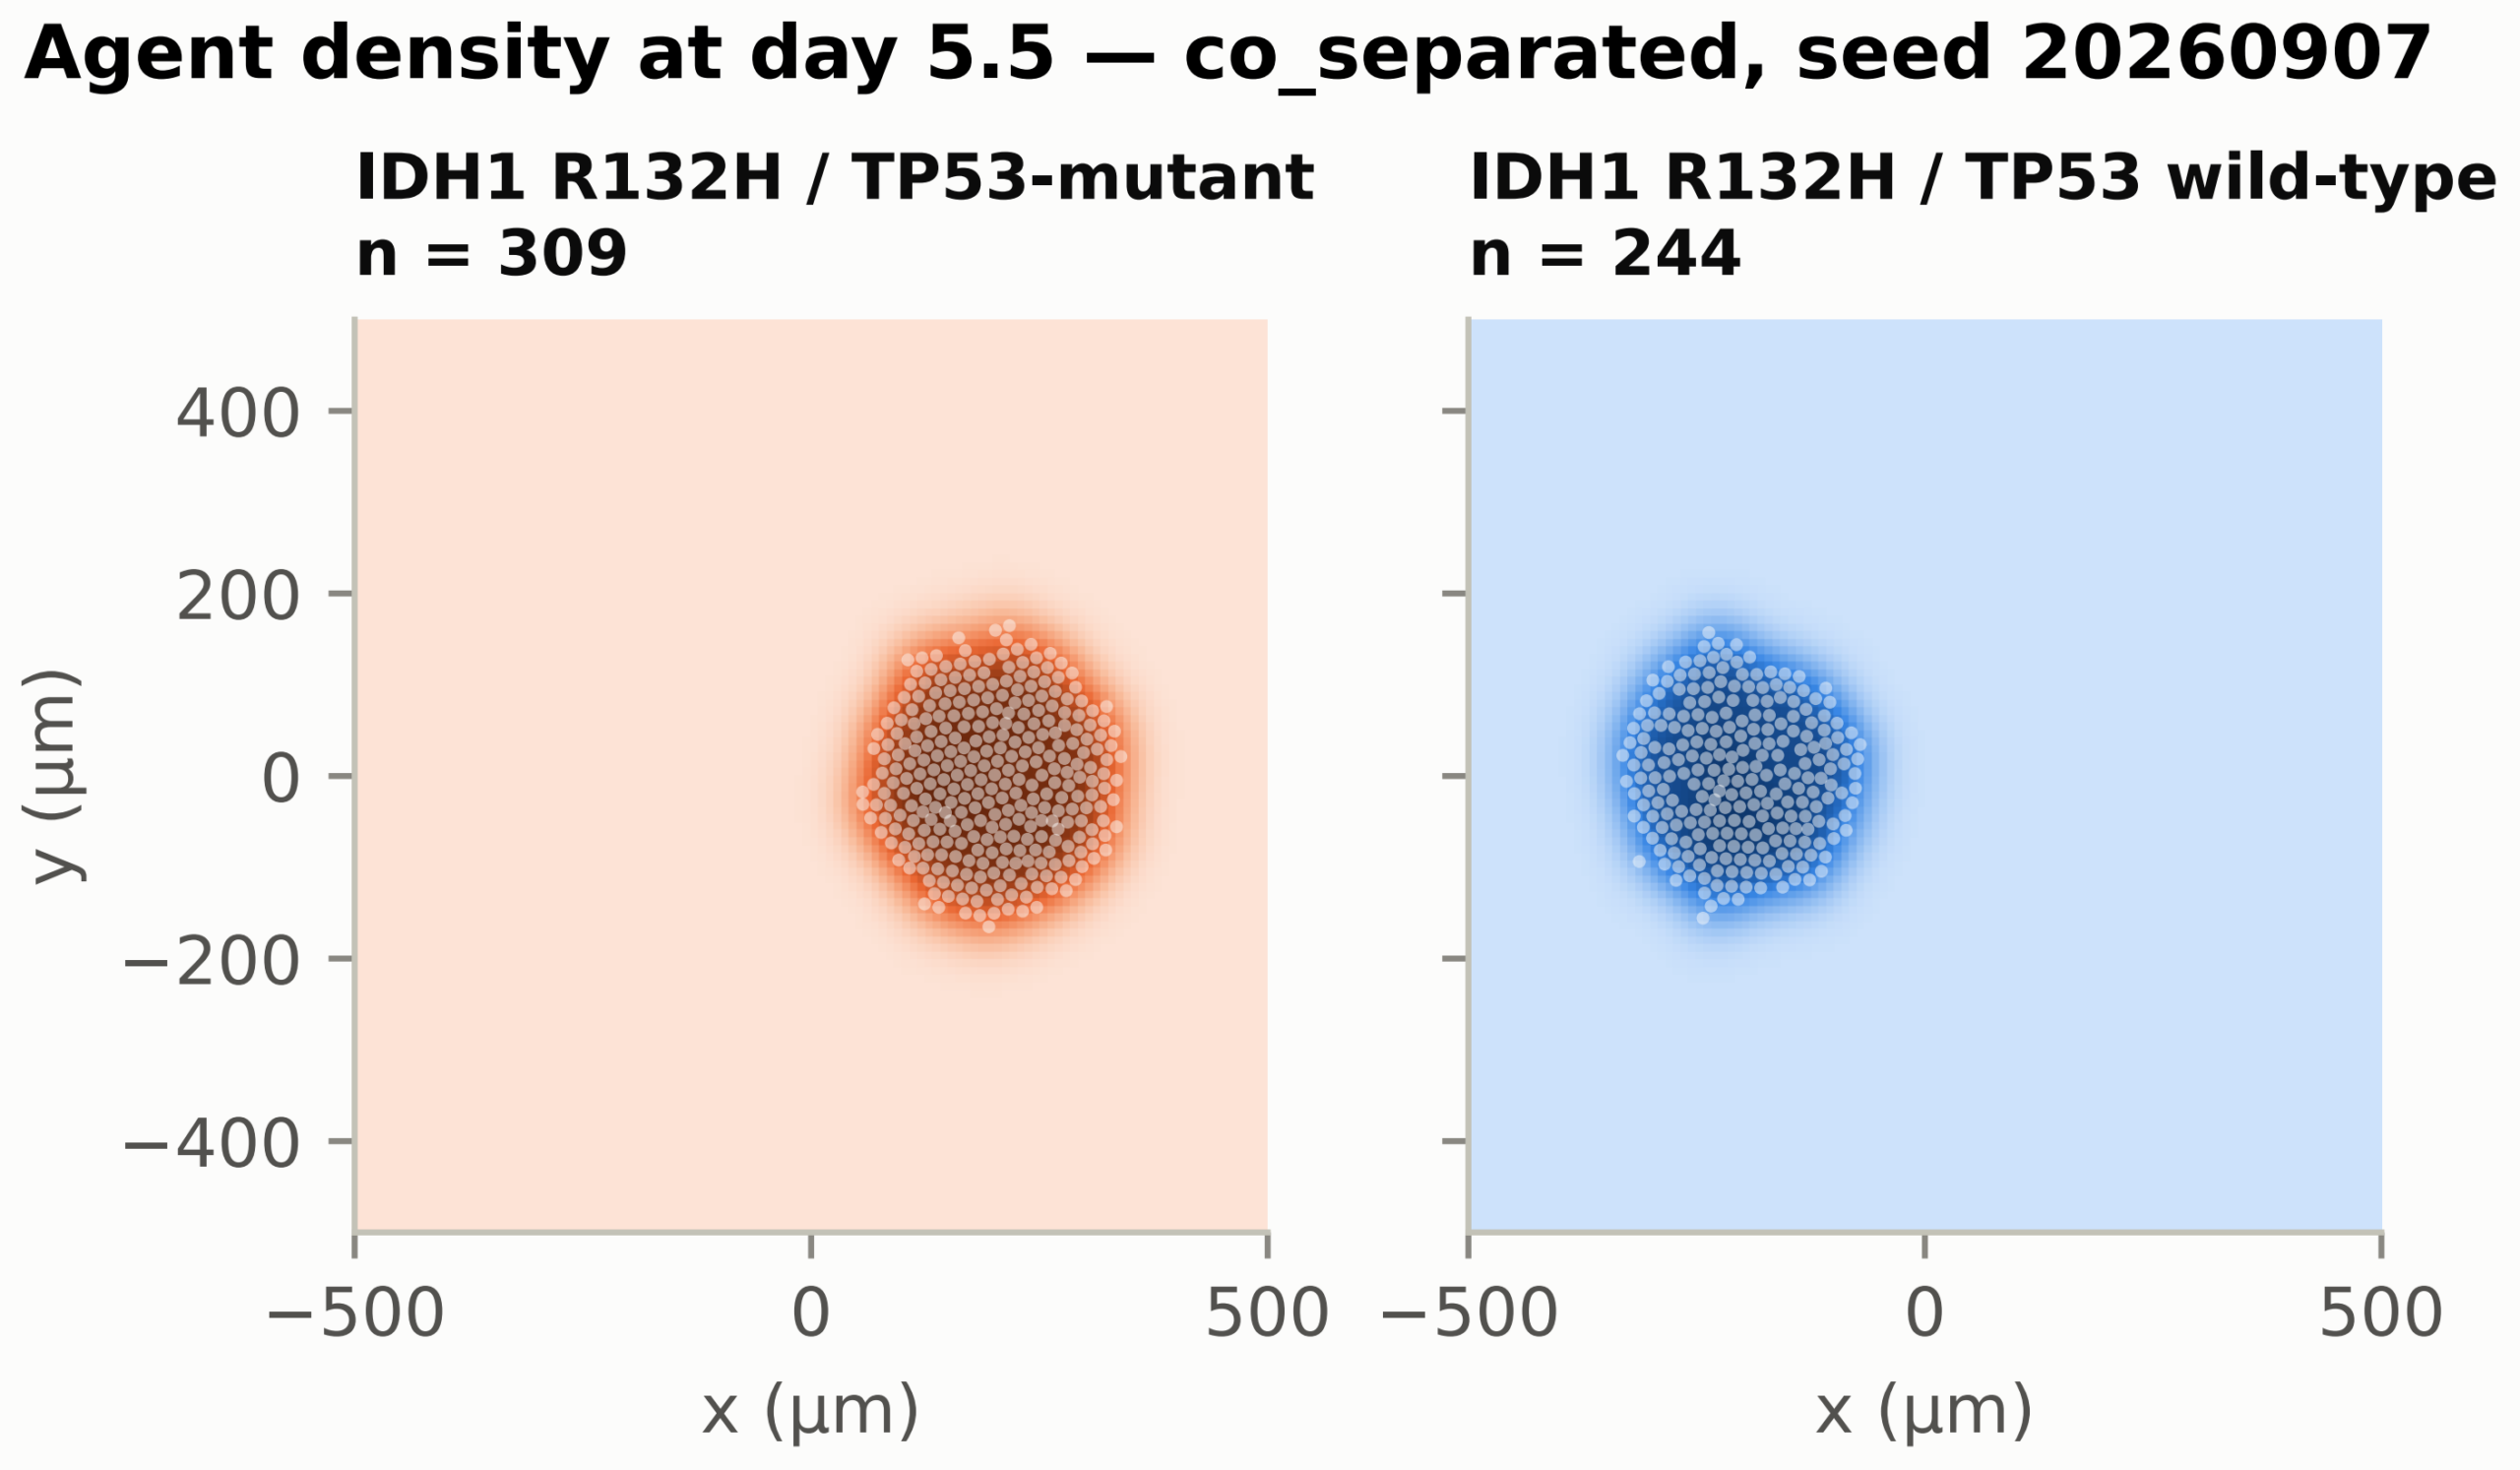
Both populations expanded approximately isotropically from their seeding disks (Figures 2 and 8). Motility was disabled and adhesion and repulsion parameters were identical across genotypes, so the model contains no genotype-specific spatial phenotype: the larger footprint of the TP53-mutant population follows from its larger cell count rather than from any distinct migratory or mechanical behaviour, and no conclusion about mutation-specific invasion is drawn.
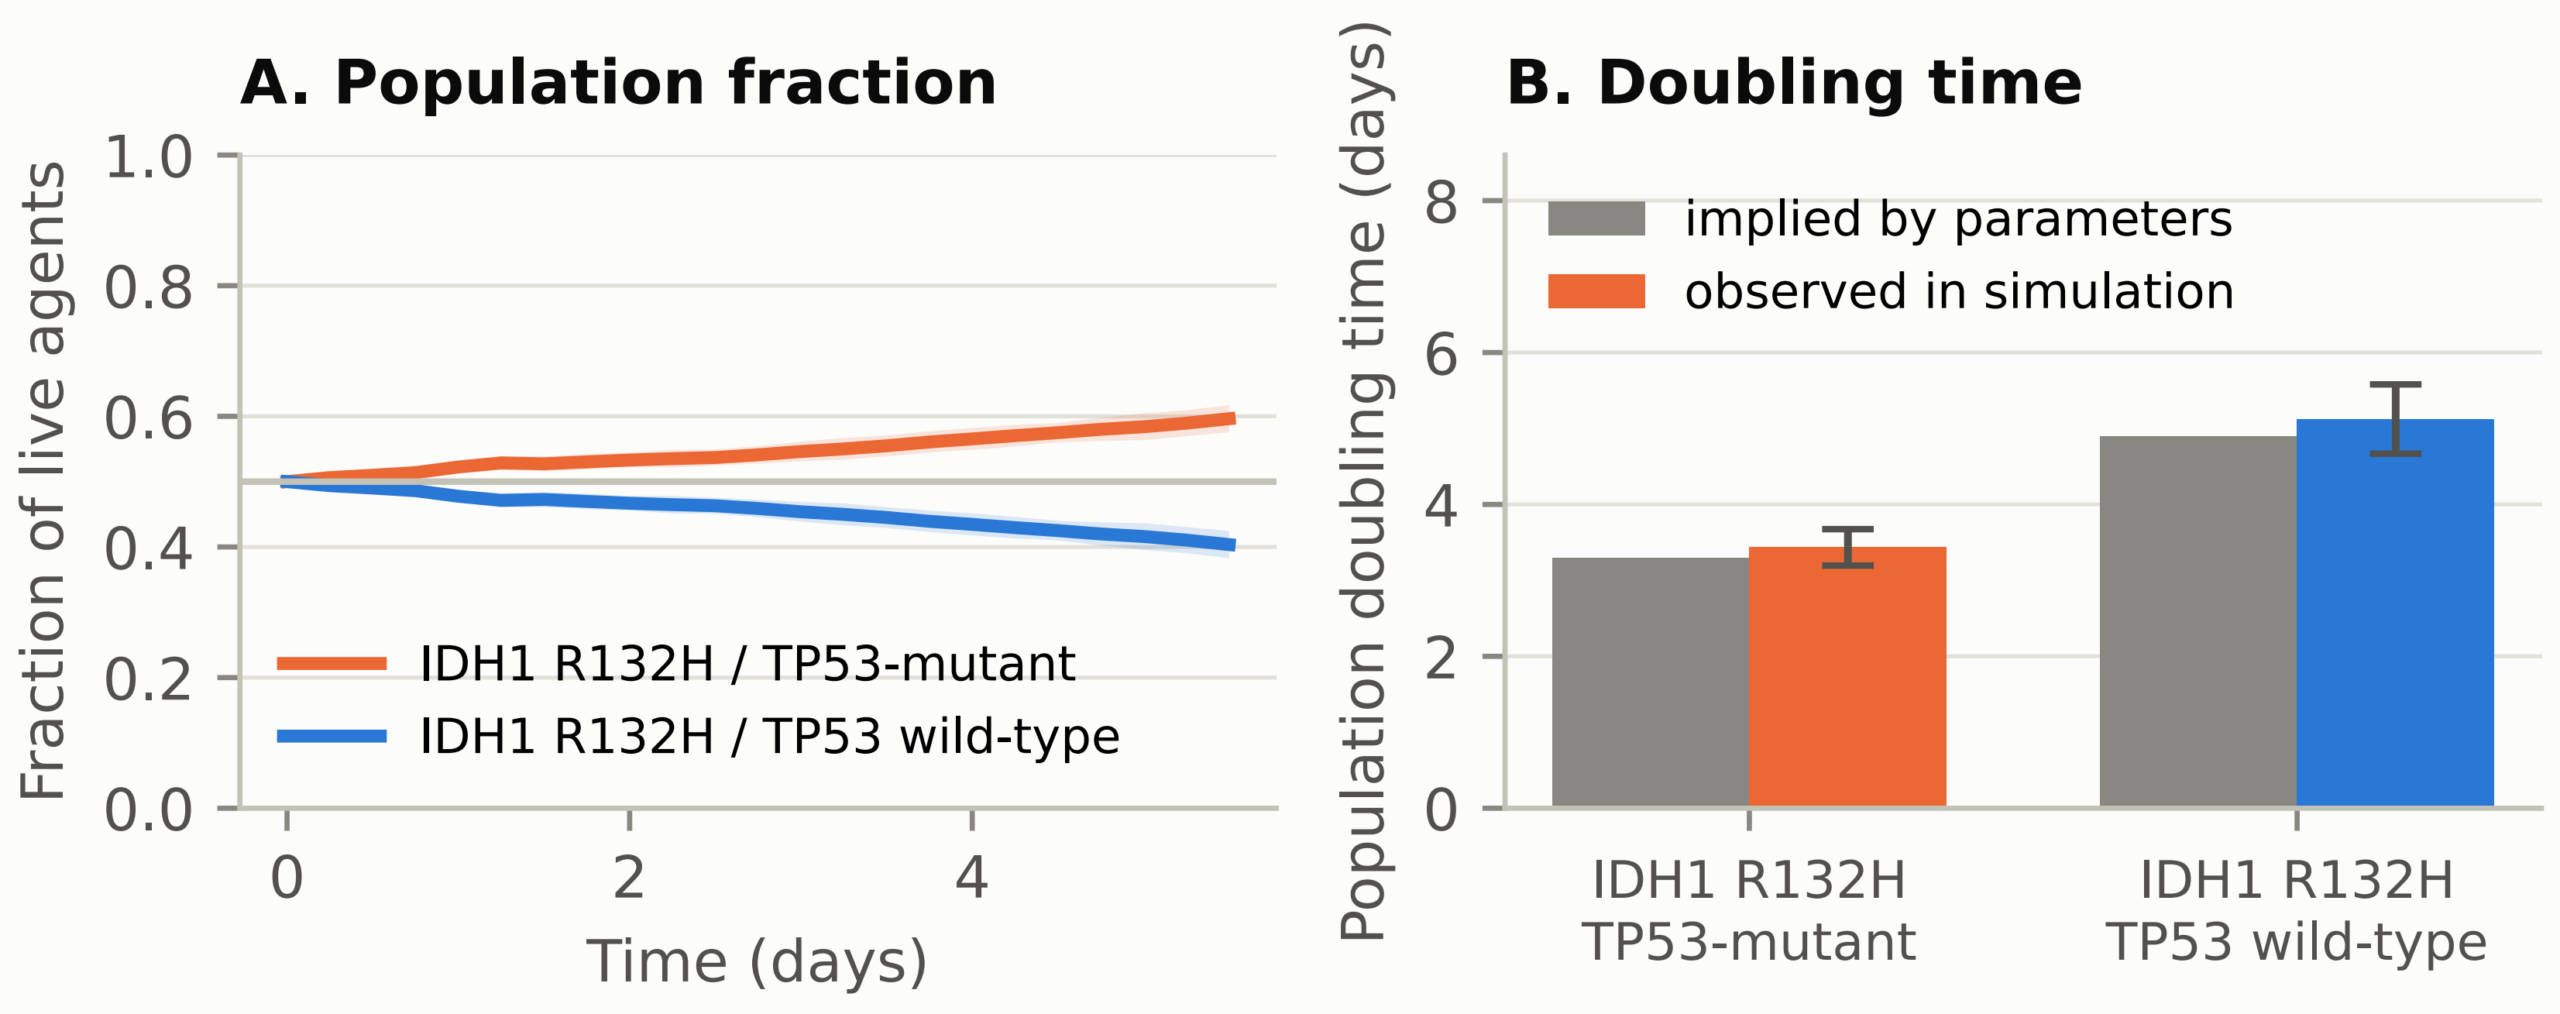
Exponential regression was performed for each population. The fitted doubling times agree with the values implied by the entered parameters to within a few percent, which is the verification the fit is used for rather than a finding in its own right. Any residual departure reflects crowding within the finite domain rather than competitive pressure, since competition coefficients measured against monoculture were indistinguishable from zero. Fold change from the initial cell count is reported alongside the fitted rate throughout (Figure 1, right panel).
Statistical Analysis
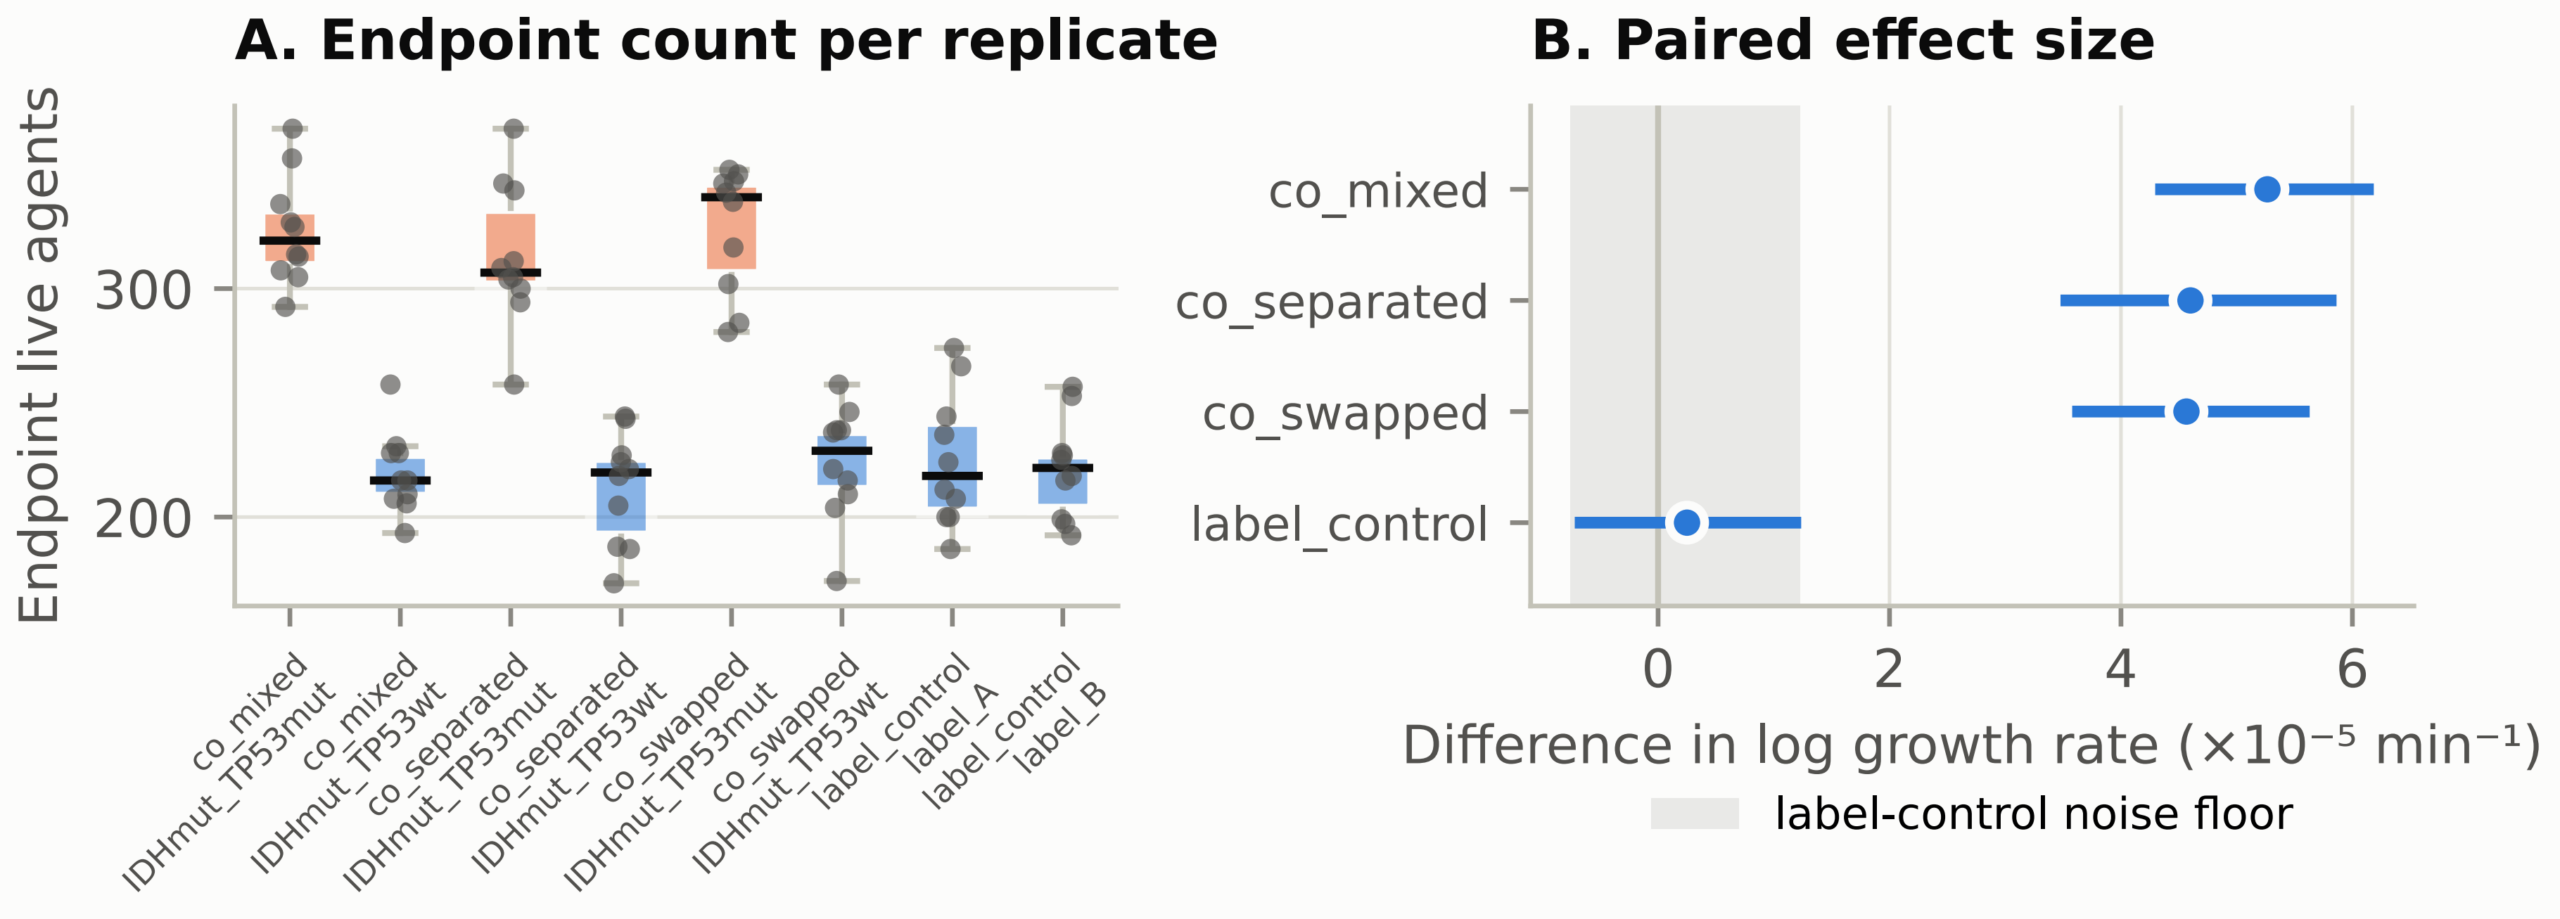
All statistical tests treating timepoints as independent observations have been removed, since successive timepoints within a run are serially dependent and their use inflates the degrees of freedom. Comparisons are now made between complete runs. The within-seed paired difference in fitted log growth rate between the TP53-mutant and TP53-wild-type populations was 5.3 x 10⁻⁵ min-1 (95% CI 4.3-6.2 x 10⁻⁵, Cohen’s dz 3.28) in the well-mixed arm, 4.6 x 10⁻⁵ (3.5-5.9 x 10⁻⁵, dz 2.25) in the separated arm and 4.6 x 10⁻⁵ (3.6-5.6 x 10⁻⁵, dz 2.64) in the position-swapped arm. The separated and position-swapped arms agree to two significant figures, so the effect does not depend on which side of the domain a population is seeded. In the label control, where two populations are parameterised identically, the same comparison gave 2.5 x 10⁻⁶ (95% CI -7.2 x 10⁻⁶ to 1.2 x 10⁻⁵, dz 0.15), which is the false-positive floor of the analysis. Competition coefficients, defined as a genotype’s growth rate in co-culture minus its growth rate in monoculture at the same seed, all had confidence intervals spanning zero. Neither population’s growth was measurably altered by the presence of the other.
| Arm | Comparison | Mean difference in log growth rate (1/min) | 95% CI | Cohen’s dz |
| Well-mixed co-culture | TP53-mutant – TP53-wild-type | 5.3 x 10⁻⁵ | 4.3 x 10⁻⁵ to 6.2 x 10⁻⁵ | 3.28 |
| Separated co-culture | TP53-mutant – TP53-wild-type | 4.6 x 10⁻⁵ | 3.5 x 10⁻⁵ to 5.9 x 10⁻⁵ | 2.25 |
| Position-swapped | TP53-mutant – TP53-wild-type | 4.6 x 10⁻⁵ | 3.6 x 10⁻⁵ to 5.6 x 10⁻⁵ | 2.64 |
| Label control | Label A – Label B | 2.5 x 10⁻⁶ | -7.2 x 10⁻⁶ to 1.2 x 10⁻⁵ | 0.15 |
Note: Within-seed paired differences in fitted log growth rate between the TP53-mutant and TP53-wild-type populations, by arm. Each row is ten paired replicates; confidence intervals are percentile bootstrap. The label control gives the false-positive floor of the analysis, since both of its populations are parameterised identically. All 60 competition coefficients measured against monoculture at the same seed had confidence intervals spanning zero and are reported in full in the accompanying data file.
Tumor Heterogeneity
The Shannon diversity analysis revealed a decline in tumor heterogeneity over the simulation period. With two populations the maximum index is ln 2 = 0.693, the value at seeding. By day 5.5 it had declined to 0.672, a change of -0.021. The corresponding change in the label control, where both populations are parameterised identically, was -0.0016. The decline is thus real and roughly an order of magnitude above the analysis floor, but small in absolute terms, amounting to about a 3% reduction.
Oxygen Microenvironment
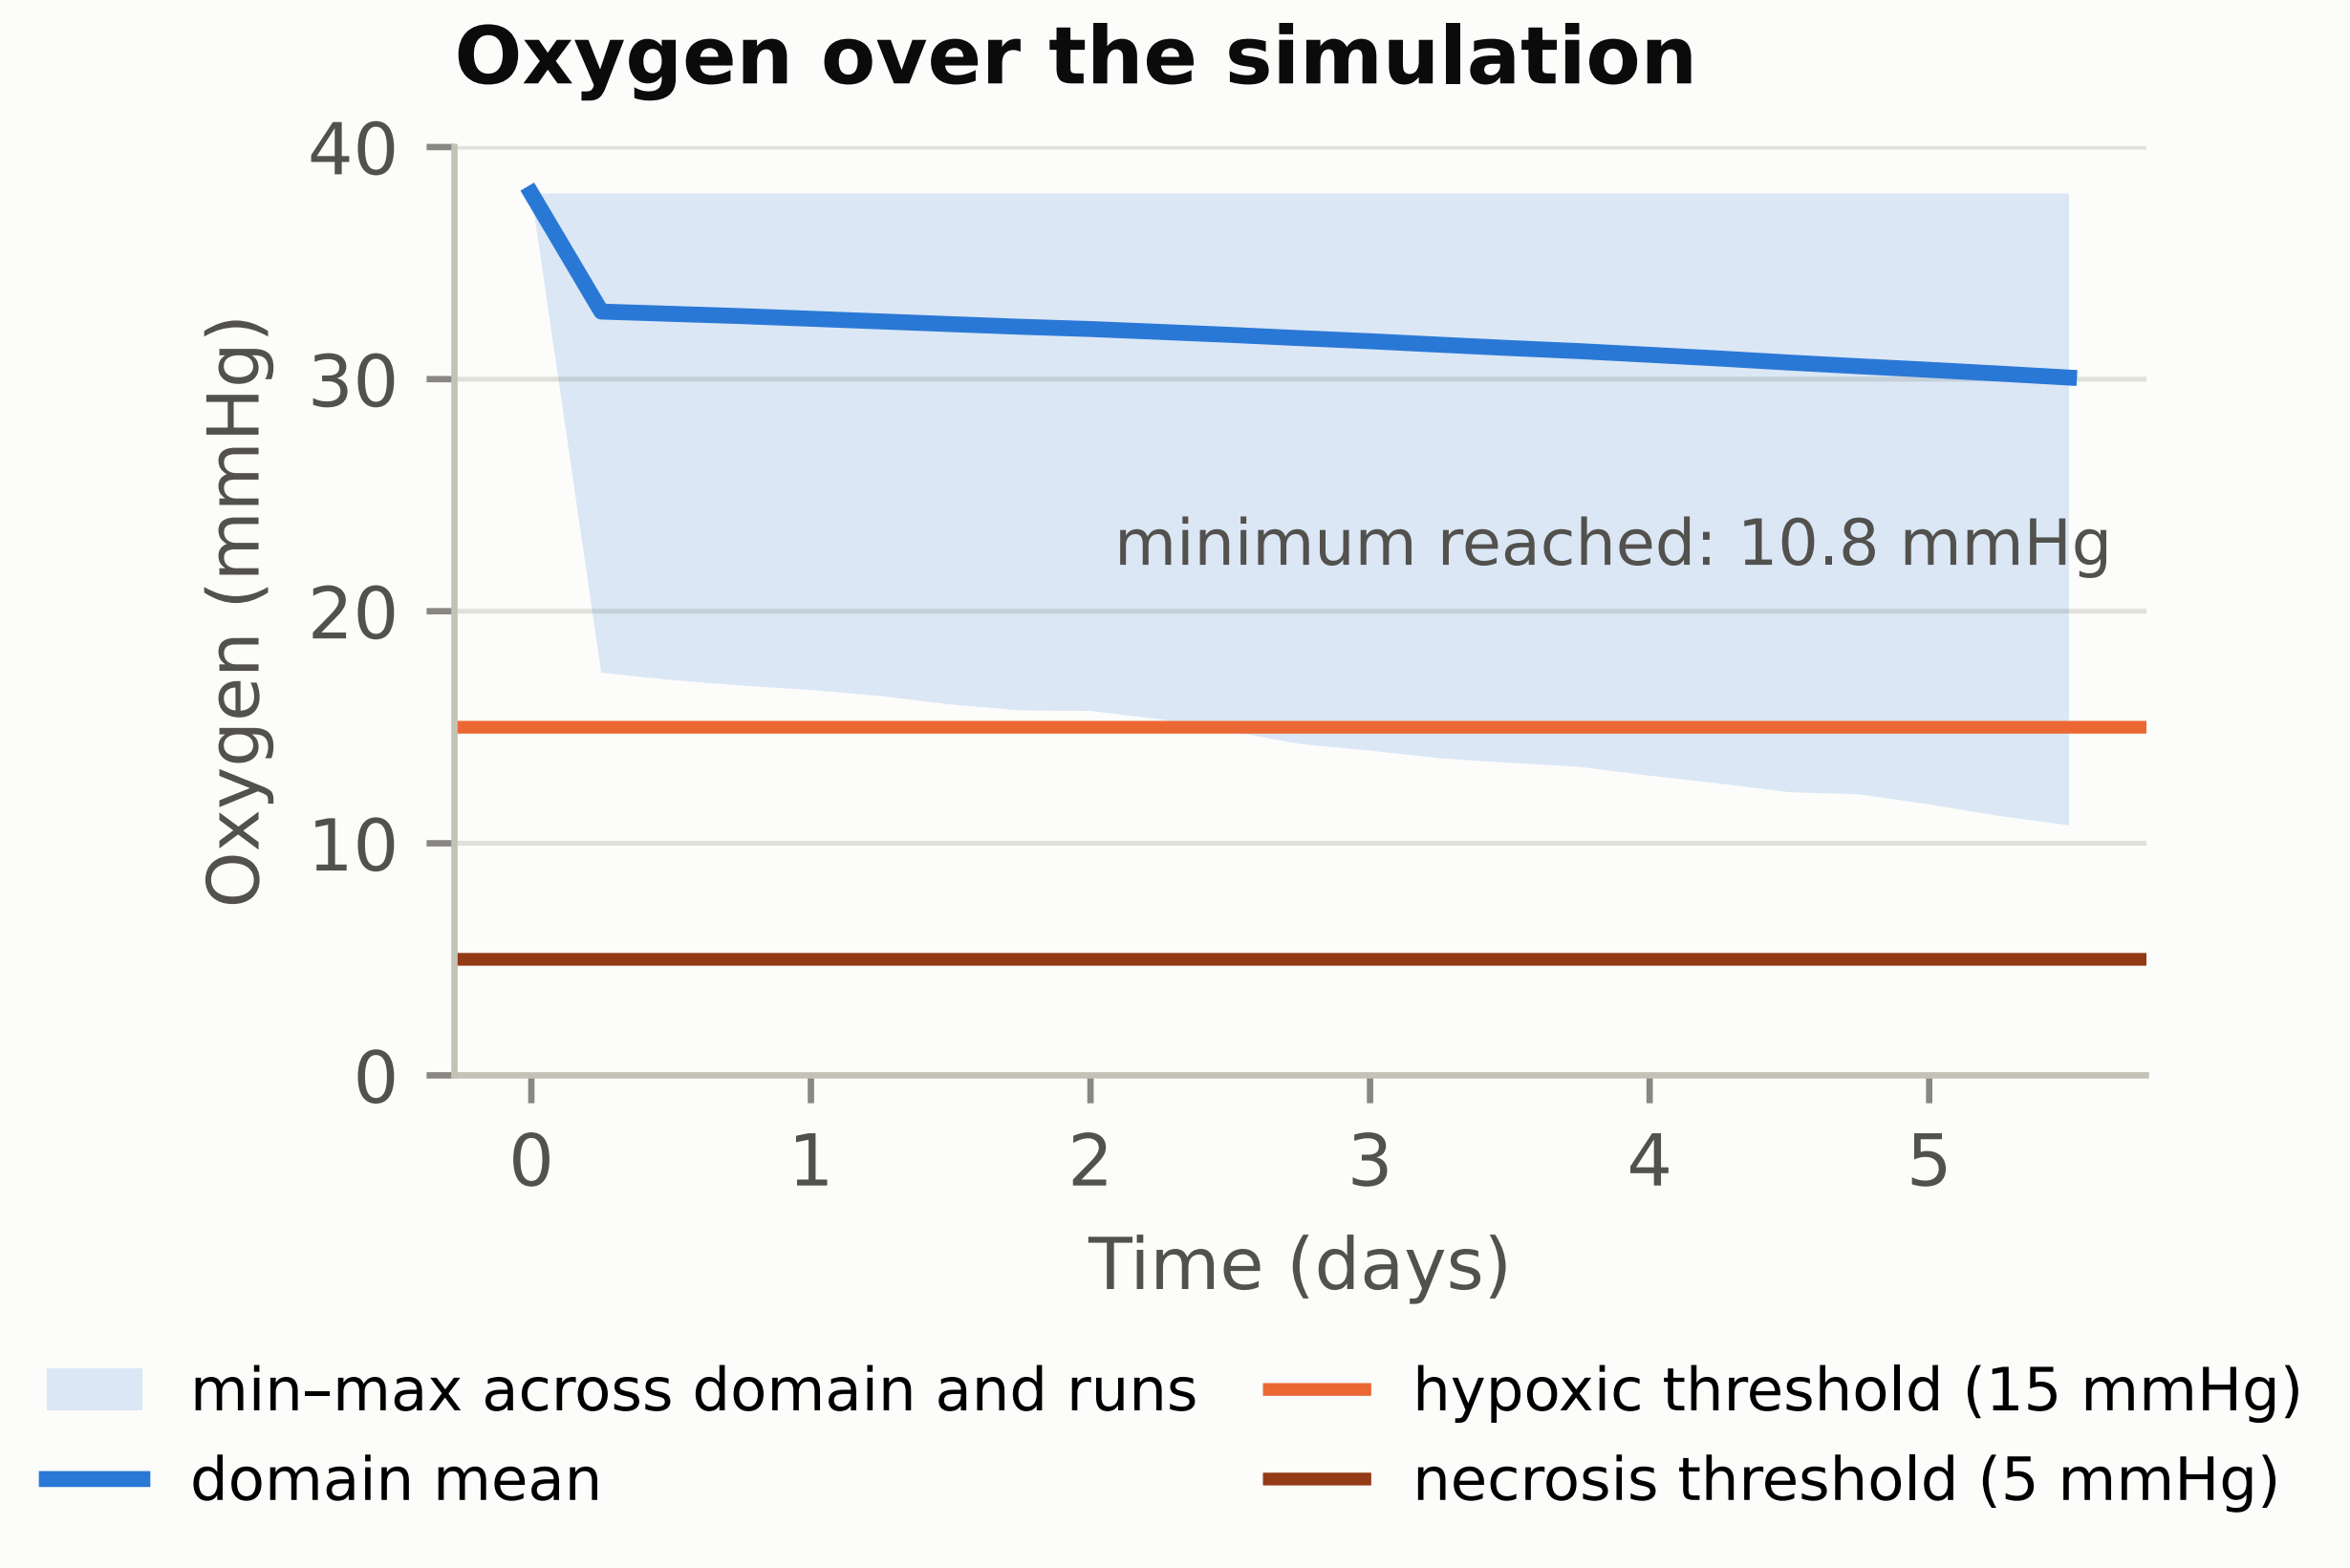
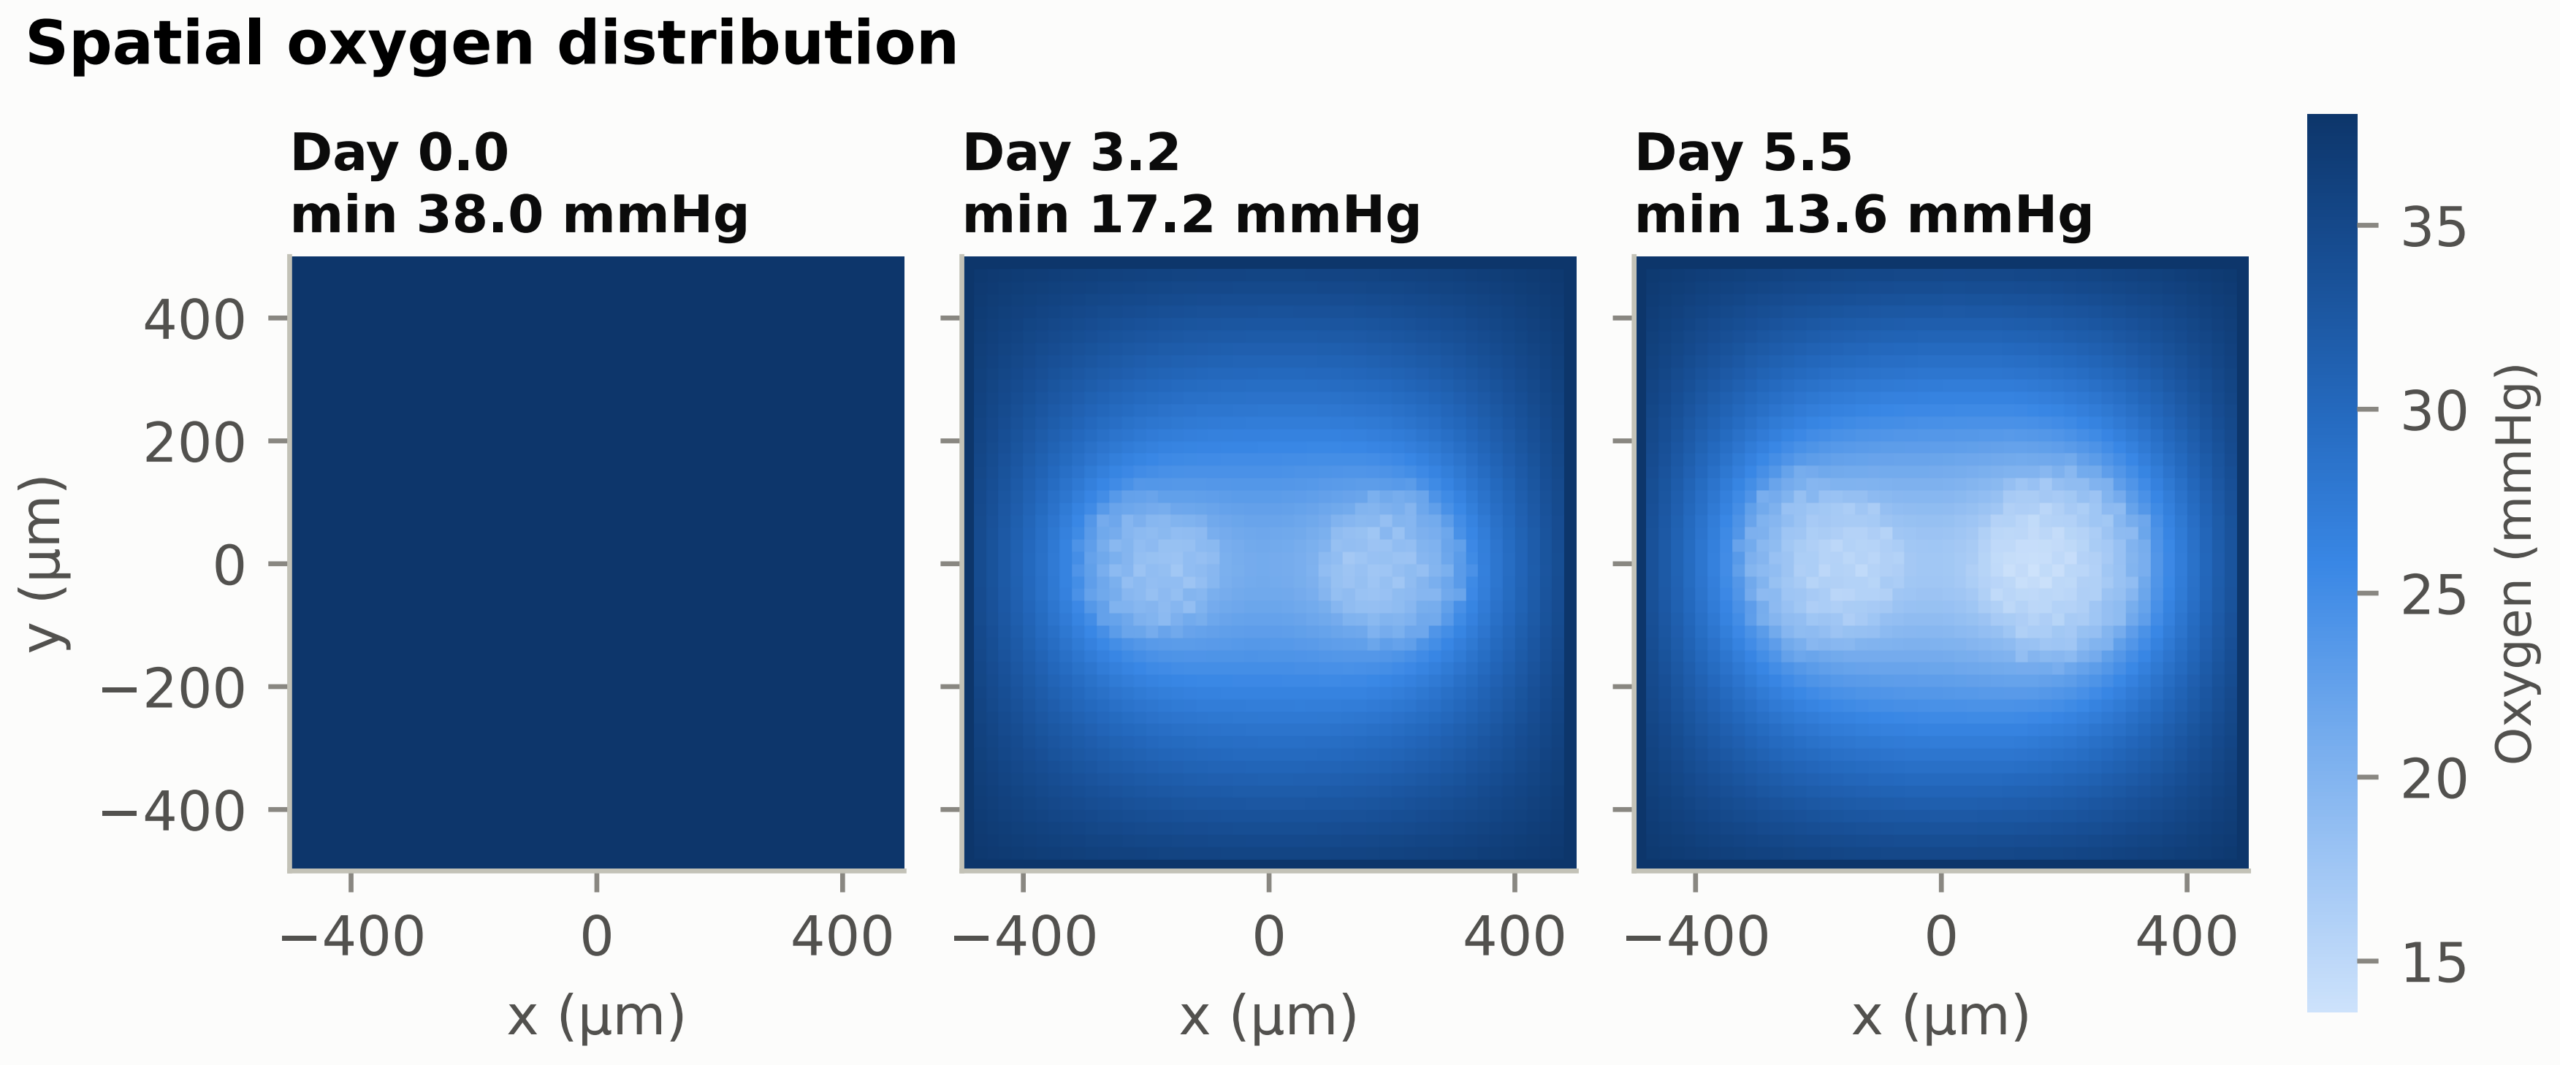
Domain-mean oxygen declined from 38.0 mmHg at simulation onset to 32.9 mmHg within the first six hours as the populations established consumption, and then fell gradually to 30.1 mmHg by day 5.5 rather than stabilising. The minimum voxel value fell further, to 17.4 mmHg at six hours. The minimum oxygen concentration reached in any voxel across the run set was 10.8 mmHg. This is below PhysiCell’s default hypoxic threshold of 15 mmHg, though it remains above the 5 mmHg necrosis threshold, and no necrotic core formed at any timepoint. Spatial depletion zones are clearly visible beneath each population by day 3.2 (Figure 7), so the oxygen landscape is not uniform and oxygen is a weakly limiting shared resource rather than an inert background. Because both genotypes have identical uptake parameters this depletion is symmetric and does not favour either population.
Spatial Density
At day 5.5, kernel density estimation showed both populations occupying approximately circular regions centred on their seeding positions, the TP53-mutant region being larger in proportion to its larger cell count. Since the spatial descriptions follow directly from where each population was placed, and no genotype-specific motility, adhesion, or mechanical parameters were assigned, these distributions are reported as a description of the model configuration rather than as a spatial phenotype.
Model Verification and Sensitivity Analysis
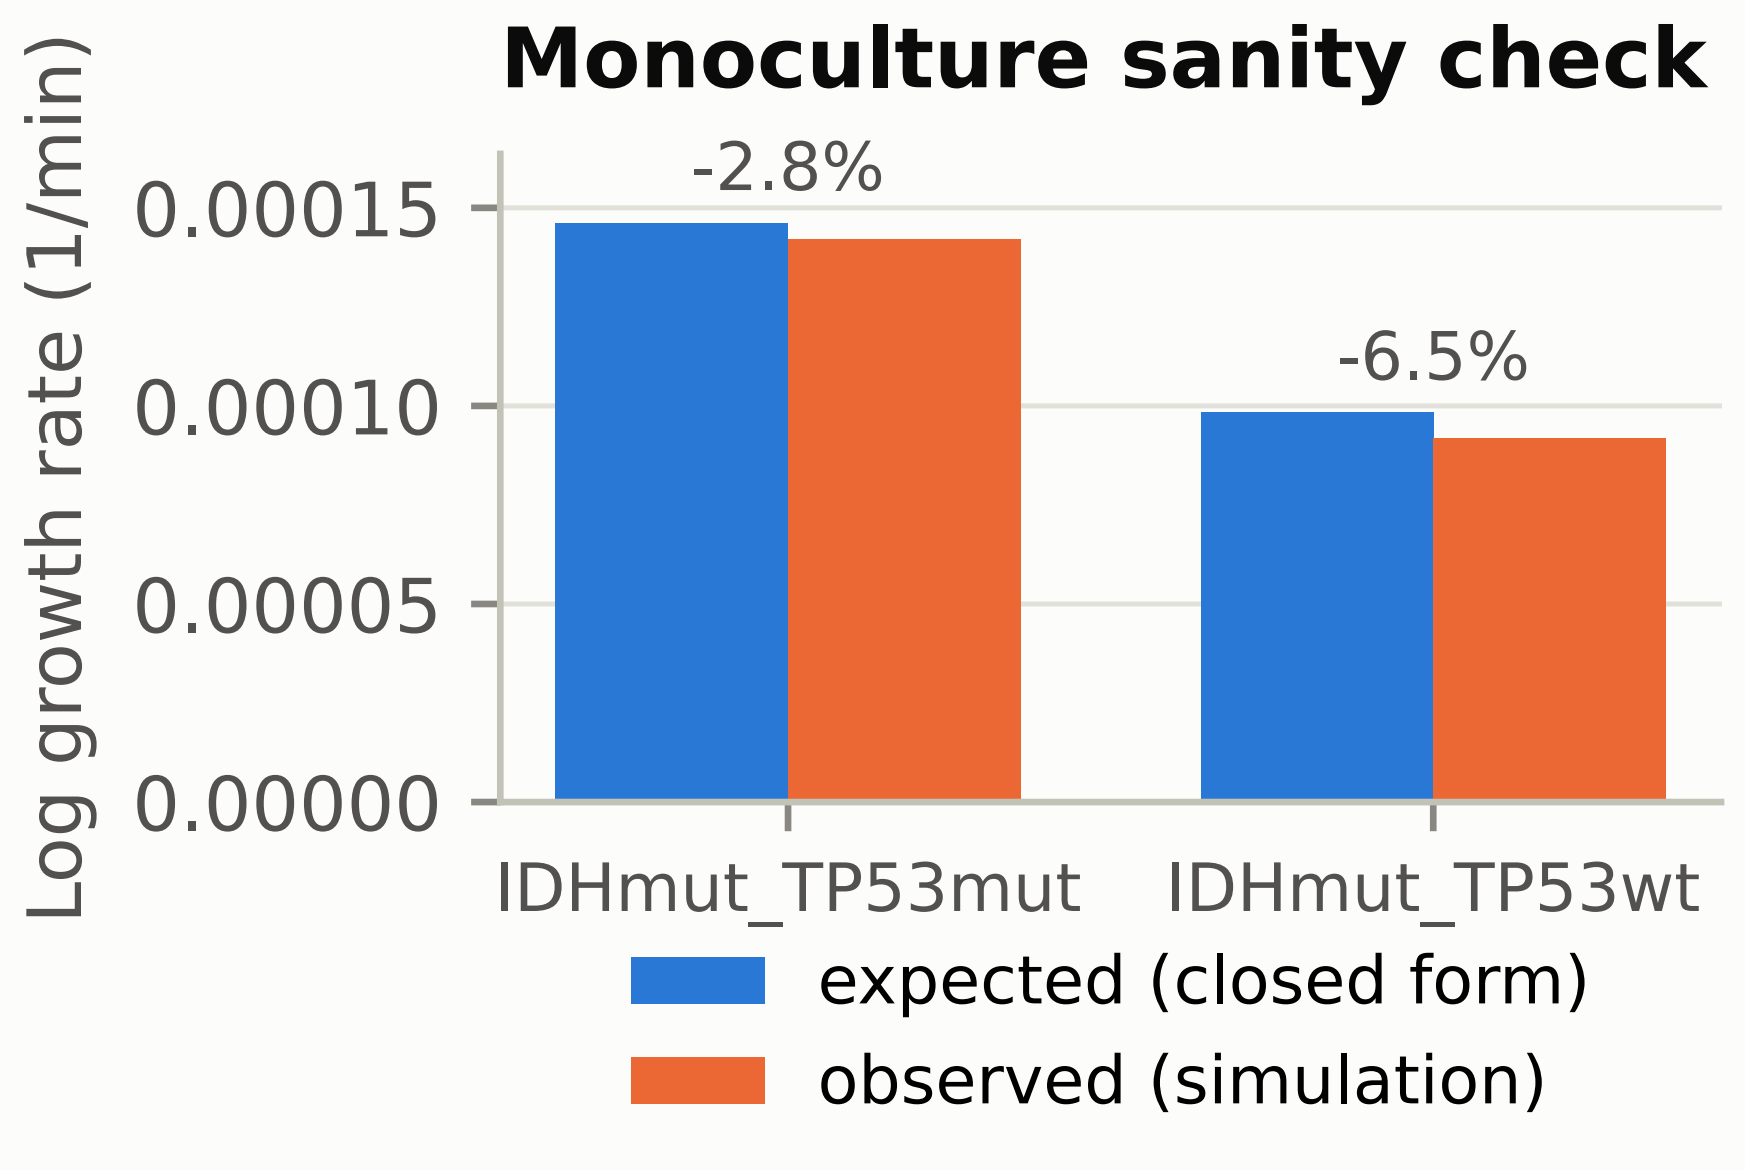
Before any co-culture result was interpreted, each genotype was simulated alone and compared against the closed-form prediction N(t) = N0 exp((r – d)t) computed from its parameters with no fitting. Both monoculture arms agreed with the prediction to within 7% (Figure 9), which verifies that the emitted configuration encodes the intended parameters. Because the degree of apoptosis suppression is an assumption rather than a measured quantity, it was varied across six values from 1 (no effect) to 100 with five seeded replicates per value (Figure 10). At the null the two arms are indistinguishable, so the entire effect disappears when the assumption is switched off; the effect saturates above roughly fivefold because apoptosis can at most be removed, after which growth is bounded by the cycle rate. Replicate count was set by convergence rather than convention, the relative half-width of the 95% confidence interval falling to 4.7% at ten replicates (Figure 11).
Discussion
The central finding of this study is that TP53-mutant cells are driven by apoptosis suppression, not proliferation. In the corrected run set the TP53-mutant population expanded 3.14-fold against 2.13-fold for the TP53-wild-type population, at identical cycle transition rates. The only parameter differentiating the two was the assumed 10-fold reduction in apoptosis rate, so the growth gap is a direct arithmetic consequence of that assumption. The simulation confirms that the model behaves as its parameters dictate; it does not independently establish that TP53 mutation produces this effect in patients. Currently, the clinical narrative around TP53 tends to conflate tumor suppressor loss with accelerative growth, yet it is more accurate that TP53 mutation allows cells that should die to persist and accumulate.
This reflects the role of p53 in activating the intrinsic apoptotic pathway. Under regular conditions, genotoxic stress activates p53, which then transcriptionally upregulates BAX, PUMA, and NOXA, permeabilizing the mitochondrial outer membrane and initiating caspase-dependent cell death3. Mutation at hotspot codons 248 or 273 ablates this response.
Each division cycle in a TP53-mutant cell produces daughter cells that accumulate DNA damage, then driving the genomic instability that marks the characteristic G:C to A:T transition pattern at CpG sites observed in clinical AIDHmut/G42. Over the simulated period the assigned survival advantage compounds into a 1.47-fold greater total population expansion relative to the TP53-wild-type agent.
In the revised model both agents carry the IDH1 R132H mutation, so the contrast concerns TP53 status on a shared IDH1-mutant background rather than a comparison between IDH1-mutant and IDH1-wildtype subclones. The IDH1 R132H substitution redirects isocitrate dehydrogenase activity towards producing 2-hydroxyglutarate, an oncometabolite that competitively inhibits α-ketoglutarate-dependent dioxygenases and alters histone and DNA methylation35,20. None of this metabolic machinery is represented here. The observed doubling times agree with the values implied by the entered parameters to within a few percent, which verifies the configuration; any departure reflects crowding within the domain rather than competitive pressure. No population was excluded by another within the timeframe of the simulation, and both grew at rates indistinguishable from their monoculture rates.
The Shannon index declined from 0.693 at seeding to 0.672 at day 5.5, a change of -0.021 against -0.0016 in the identically parameterised label control. The decline is real and roughly an order of magnitude above the analysis floor, but amounts to only about 3% of the two-population maximum, so the two populations remain close to evenly balanced at the end of the run rather than converging on a monoclonal state. The model contains no stem-cell state, no differentiation hierarchy, no self-renewal mechanism and no stem-cell markers, so a modest shift in the relative proportions of two predefined populations bears no evidential weight on cancer stem cell theory and no such inference is drawn.
No treatment, DNA-damage response, or drug mechanism was represented in this model, so it provides no basis for a therapeutic recommendation. The MDM2 inhibitor recommendation previously made here was in any case biologically reversed: MDM2 inhibitors depend on functional wild-type p53 and act on TP53-wild-type cells, not the TP53-mutant cells they were proposed to target34.
Oxygen fell to a minimum of 10.8 mmHg, below the hypoxic threshold but above the necrosis threshold, and no necrotic core formed. Domain-mean oxygen declined from 38.0 to 32.9 mmHg in the first six hours as the seeded populations established their consumption rate, then continued to fall slowly rather than reaching a steady state, with mild hypoxia developing beneath each population. The absence of necrosis follows from the domain size, the boundary conditions and the population sizes reached, and cannot be offered as evidence about the histology of AIDHmut/G4.
Limitations
Several limitations must be noted. The simulation was two-dimensional, while tumor growth in the brain parenchyma is inherently three-dimensional. It included two cell types differing in a single parameter, whereas AIDHmut/G4 involves several coexisting alterations, notably ATRX and CDKN2A/B, which were held constant here and not represented; whole-arm 1p/19q codeletion is a feature of oligodendroglioma rather than astrocytoma and is not applicable. The 5.5-day window is short relative to the months over which these tumors develop, so long-term competition is not observable here. All parameters derive from in vitro models, and immune cell interactions were not represented. The most important remaining limitation is that the magnitude of the apoptosis suppression is an assumption rather than a measured quantity: the sensitivity analysis shows the qualitative result is robust across a 5- to 100-fold range but disappears entirely at the null, so the finding is conditional on assuming suppression exists.
One more important limitation concerns the statistical analyses. The previous version of this work applied Kruskal-Wallis H tests and one-way ANOVAs to the cell count distribution across timepoints. Successive timepoints within a run are serially dependent, so treating them as independent inflated the degrees of freedom and produced artificially small p-values. Those tests have been removed entirely. The present analysis uses the run as the unit of replication, which is the appropriate unit but also a coarser one: with ten replicates per arm the study is powered to detect only differences of roughly the size reported here.
Future Directions
To test the hypothesis that TP53-mutant cells resist treatment, parallel simulations would have to apply apoptosis rates relevant to chemotherapy, both generally and selectively to the TP53-mutant population. Further work would extend the model to three dimensions, represent ATRX and CDKN2A/B status explicitly, simulate longer periods, and incorporate patient-specific genetic data.
Ethics and Policy
It must be noted that the present work is completely computational in its nature and did not include research on humans, patients’ information, any animal tests, or biological samples. Institutional review and informed consent were not applicable, as the study did not involve human participants, clinical patient data, animal testing, or biological tissue samples. In addition, all cellular activity values used in the current investigation have been obtained only from published sources.
Code and data availability. The complete simulation and analysis code is publicly available at https://github.com/vedant-dave832/glioma_physicell. The repository contains the parameter registry from which both the PhysiCell configuration and the parameter table are generated, the replicate runner, the analysis and figure code, and the test suite. Every run is archived with a manifest recording its random seed, the PhysiCell version and git commit, the OpenMP thread count and a SHA-256 hash of the configuration passed to the executable, together with the configuration file and initial-condition CSV themselves, so any value reported in this paper can be regenerated exactly. Each figure is accompanied by a data file containing the values plotted.
Conclusion
The aim of this study was to model growth dynamics of TP53-wild-type and TP53-mutant astrocytoma cell populations on a shared IDH1-mutant background in PhysiCell, in order to examine mechanisms proposed for the different prognoses of these sub-clonal lineages in Astrocytoma IDH Mutant Grade 4. Across ten seeded replicates the TP53-mutant population expanded 3.14-fold against 2.13-fold for the TP53-wild-type population at identical cycle transition rates, the only difference between them being an assumed 10-fold reduction in apoptosis rate. Within the model, a reduced apoptosis rate is therefore sufficient to produce a larger final population without any change in division rate. This is a property of the parameterisation, verified against the closed-form expectation, and is not evidence about prognosis in patients. The model contains no stem-cell state and no treatment, so it bears on neither cancer stem cell theory nor temozolomide resistance, and supports no therapeutic recommendation. Most importantly, competition coefficients measured against monoculture all included zero: the larger TP53-mutant population reflects its assigned death rate rather than competitive displacement.
Supplementary Material
References
- A. Chaurasia, S. H. Park, J. W. Seo, C. K. Park. Immunohistochemical analysis of ATRX, IDH1 and p53 in glioblastoma and their correlations with patient survival. J Korean Med Sci. Vol. 31, pg. 1208–1214, 2016, https://doi.org/10.3346/jkms.2016.31.8.1208. [↩]
- H. Ohgaki, P. Kleihues. Genetic pathways to primary and secondary glioblastoma. Am J Pathol. Vol. 170, pg. 1445–1453, 2007, https://doi.org/10.2353/ajpath.2007.070011. [↩] [↩] [↩] [↩]
- H. Ohgaki, P. Kleihues. The definition of primary and secondary glioblastoma. Clin Cancer Res. Vol. 19, pg. 764–772, 2013, https://doi.org/10.1158/1078-0432.CCR-12-3002. [↩] [↩] [↩]
- A. P. Becker, B. E. Sells, S. J. Haque, A. Chakravarti. Tumor heterogeneity in glioblastomas: from light microscopy to molecular pathology. Cancers. Vol. 13, pg. 761, 2021, https://doi.org/10.3390/cancers13040761. [↩]
- Z. Lu, B. Nie, W. Zhai, Z. Hu. Delineating the longitudinal tumor evolution using organoid models. J Genet Genomics. Vol. 48, pg. 560–570, 2021, https://doi.org/10.1016/j.jgg.2021.06.010. [↩]
- T. Koga, I. A. Chaim, J. A. Benitez, et al. Longitudinal assessment of tumor development using cancer avatars derived from genetically engineered pluripotent stem cells. Nat Commun. Vol. 11, pg. 550, 2020. [↩]
- M. Podberezin, J. Wen, C. C. Chang. Cancer stem cells: a review of potential clinical applications. Arch Pathol Lab Med. Vol. 137, pg. 1111–1116, 2013. [↩]
- N. Hasanzadeh, A. Niknejad. Cerebral glioblastoma: a review on genetic alterations, signaling pathways, and clinical management. Jentashapir J Cell Mol Biol. Vol. 12, pg. e119223, 2021. [↩] [↩]
- S. Xi, Q. Huang, J. Zeng. A novel grading system combining histological grade and CDKN2A homozygous and hemizygous deletion to predict prognosis in IDH-mutant astrocytoma. J Neuropathol Exp Neurol. Vol. 83, pg. 125–130, 2024, https://doi.org/10.1093/jnen/nlad112. [↩]
- S. H. Lee, T. G. Kim, K. H. Ryu, S. H. Kim, Y. Z. Kim. Homozygous deletion is a stronger predictor of outcome than mutation in CNS WHO grade 4 gliomas. Biomedicines. Vol. 12, pg. 2256, 2024, https://doi.org/10.3390/biomedicines12102256. [↩]
- H. Jiang, X. Wang, X. Chen, S. Zhang, Q. Ren, M. Li, et al. Unravelling the heterogeneity of WHO grade 4 gliomas: insights from clinical, imaging, and molecular characterization. Discov Oncol. Vol. 16, pg. 111, 2025, https://doi.org/10.1007/s12672-025-01811-0. [↩]
- H. Arita, Y. Matsushita, R. Machida, K. Yamasaki, N. Hata, M. Ohno, et al. TERT promoter mutation confers favorable prognosis regardless of 1p/19q status in adult diffuse gliomas with IDH1/2 mutations. Acta Neuropathol Commun. Vol. 8, pg. 201, 2020, https://doi.org/10.1186/s40478-020-01078-2. [↩]
- B. Wiestler, D. Capper, T. Holland-Letz, A. Korshunov, A. von Deimling, S. M. Pfister, et al. ATRX loss refines the classification of anaplastic gliomas and identifies a subgroup of IDH mutant astrocytic tumors with better prognosis. Acta Neuropathol. Vol. 126, pg. 443–451, 2013, https://doi.org/10.1007/s00401-013-1156-z. [↩]
- M. Abedalthagafi, J. J. Phillips, G. E. Kim, S. Mueller, D. A. Haas-Kogen, R. E. Marshall, et al. The alternative lengthening of telomere phenotype is significantly associated with loss of ATRX expression in high-grade pediatric and adult astrocytomas: a multi-institutional study of 214 astrocytomas. Mod Pathol. Vol. 26, pg. 1425–1432, 2013, https://doi.org/10.1038/modpathol.2013.90. [↩]
- J. A. Brosnan-Cashman, C. M. Davis, B. H. Diplas, A. K. Meeker, F. J. Rodriguez, C. M. Heaphy. SMARCAL1 loss and alternative lengthening of telomeres (ALT) are enriched in giant cell glioblastoma. Mod Pathol. Vol. 34, pg. 1810–1819, 2021, https://doi.org/10.1038/s41379-021-00841-7. [↩]
- G. Xiao, D. Lundine, G. K. Annor, J. Canar, V. Ellison, A. Polotskaia, et al. Gain-of-function mutant p53 R273H interacts with replicating DNA and PARP1 in breast cancer. Cancer Res. Vol. 80, pg. 394–405, 2020, https://doi.org/10.1158/0008-5472.CAN-19-1036. [↩]
- D. Lundine, G. K. Annor, V. Chavez, S. Maimos, Z. Syed, S. Jiang, et al. The C-terminus of gain-of-function mutant p53 R273H is required for association with PARP1 and poly-ADP-ribose. Mol Cancer Res. Vol. 20, pg. 1799–1810, 2022, https://doi.org/10.1158/1541-7786.MCR-22-0133. [↩]
- W. Miao, X. Liu, H. Wang, Y. Fan, S. Lian, X. Yang, et al. p53 upregulated modulator of apoptosis sensitizes drug-resistant U251 glioblastoma stem cells to temozolomide through enhanced apoptosis. Mol Med Rep. Vol. 11, pg. 4165–4173, 2015, https://doi.org/10.3892/mmr.2015.3255. [↩]
- P. K. Panda, P. P. Naik, B. R. Meher, D. N. Das, S. Mukhopadhyay, P. P. Praharaj, et al. PUMA dependent mitophagy by Abrus agglutinin contributes to apoptosis through ceramide generation. Biochim Biophys Acta Mol Cell Res. Vol. 1865, pg. 480–495, 2018, https://doi.org/10.1016/j.bbamcr.2017.12.002. [↩]
- M. Sasaki, C. B. Knobbe, J. C. Munger, E. F. Lind, D. Brenner, A. Brustle, et al. IDH1(R132H) mutation increases murine haematopoietic progenitors and alters epigenetics. Nature. Vol. 488, pg. 656–659, 2012, https://doi.org/10.1038/nature11323. [↩] [↩]
- Z. Yang, B. Jiang, Y. Wang, H. Ni, J. Zhang, J. Xia, et al. 2-HG inhibits necroptosis by stimulating DNMT1-dependent hypermethylation of the RIP3 promoter. Cell Rep. Vol. 19, pg. 1846–1857, 2017, https://doi.org/10.1016/j.celrep.2017.05.012. [↩]
- R. J. Molenaar, D. Botman, M. A. Smits, V. V. Hira, S. A. van Lith, J. Stap, et al. Radioprotection of IDH1-mutated cancer cells by the IDH1-mutant inhibitor AGI-5198. Cancer Res. Vol. 75, pg. 4790–4802, 2015, https://doi.org/10.1158/0008-5472.CAN-14-3603. [↩]
- A. S. Venteicher, I. Tirosh, C. Hebert, K. Yizhak, C. Neftel, M. G. Filbin, et al. Decoupling genetics, lineages, and microenvironment in IDH-mutant gliomas by single-cell RNA-seq. Science. Vol. 355, pg. eaai8478, 2017, https://doi.org/10.1126/science.aai8478. [↩]
- C. K. Park, I. Park, S. Lee, C. H. Sun, Y. Koh, S. H. Park, et al. Genomic dynamics associated with malignant transformation in IDH1 mutated gliomas. Oncotarget. Vol. 6, pg. 43653–43666, 2015, https://doi.org/10.18632/oncotarget.6189. [↩]
- A. K. Suwala, D. Stichel, D. Schrimpf, M. Kloor, A. K. Wefers, A. Reinhardt, et al. Primary mismatch repair deficient IDH-mutant astrocytoma (PMMRDIA) is a distinct type with a poor prognosis. Acta Neuropathol. Vol. 141, pg. 85–100, 2021, https://doi.org/10.1007/s00401-020-02243-6. [↩]
- G. Minniti, C. Scaringi, A. Arcella, G. Lanzetta, D. Di Stefano, S. Scarpino, et al. IDH1 mutation and MGMT methylation status predict survival in patients with anaplastic astrocytoma treated with temozolomide-based chemoradiotherapy. J Neurooncol. Vol. 118, pg. 377–383, 2014, https://doi.org/10.1007/s11060-014-1443-0. [↩]
- A. Malmstrom, H. S. Poulsen, B. H. Gronberg, G. Stragliotto, S. Hansen, T. Asklund, et al. Postoperative neoadjuvant temozolomide before radiotherapy versus standard radiotherapy in patients 60 years or younger with anaplastic astrocytoma or glioblastoma: a randomized trial. Acta Oncol. Vol. 56, pg. 1776–1785, 2017, https://doi.org/10.1080/0284186X.2017.1332780. [↩]
- G. Hallaert, H. Pinson, D. Vanhauwaert, C. Van den Broecke, D. Van Roost, T. Boterberg, et al. Partial resection offers an overall survival benefit over biopsy in MGMT-unmethylated IDH-wildtype glioblastoma patients. Surg Oncol. Vol. 35, pg. 515–519, 2020, https://doi.org/10.1016/j.suronc.2020.10.016. [↩]
- S. Rathore, S. Mohan, S. Bakas, C. Sako, C. Badve, S. Pati, et al. Multi-institutional noninvasive in vivo characterization of IDH, 1p/19q, and EGFRvIII in glioma using neuro-Cancer Imaging Phenomics Toolkit (neuro-CaPTk). Neurooncol Adv. Vol. 2, Suppl. 4, pg. iv22–iv34, 2021, https://doi.org/10.1093/noajnl/vdaa128. [↩]
- M. Muther, L. Konig, P. Backhaus, W. Stummer, O. M. Grauer, M. Schafers, et al. Prognostic value of [18F]FET-PET in diffuse low-grade (grade 2) gliomas after the 2021 classification of CNS tumors. Eur J Nucl Med Mol Imaging. Vol. 53, pg. 1951–1961, 2025, https://doi.org/10.1007/s00259-025-07543-1. [↩]
- A. Ghaffarizadeh, R. Heiland, S. H. Friedman, S. M. Mumenthaler, P. Macklin. PhysiCell: an open source physics-based cell simulator for 3-D multicellular systems. PLOS Comput Biol. Vol. 14, pg. e1005991, 2018, https://doi.org/10.1371/journal.pcbi.1005991. [↩] [↩]
- X. Mao, S. McManaway, J. K. Jaiswal, P. B. Patel, W. R. Wilson, K. O. Hicks, et al. An agent-based model for drug-radiation interactions in the tumour microenvironment: hypoxia-activated prodrug SN30000 in multicellular tumour spheroids. PLoS Comput Biol. Vol. 14, pg. e1006469, 2018, https://doi.org/10.1371/journal.pcbi.1006469. [↩]
- C. Verheul, I. Ntafoulis, T. V. Kers, Y. Hoogstrate, P. G. Mastroberardino, S. Barnhoorn, et al. Generation, characterization, and drug sensitivities of 12 patient-derived IDH1-mutant glioma cell cultures. Neuro-Oncol Adv. Vol. 3, pg. vdab103, 2021, https://doi.org/10.1093/noajnl/vdab103. [↩]
- Y. Zhang, C. Dube, M. Gibert Jr, N. Cruickshanks, B. Wang, M. Coughlan, et al. The p53 pathway in glioblastoma. Cancers. Vol. 10, pg. 297, 2018, https://doi.org/10.3390/cancers10090297. [↩] [↩] [↩]
- A. Mansouri, G. Zadeh, K. Aldape. Molecular genetics of secondary glioblastoma. In: Glioblastoma, Ch. 2. Codon Publications, Brisbane, Australia, 2017. [↩]