
Abstract
Background/objective: This study aimed to characterize domain-specific symptom intensity and functional burden in visual snow syndrome (VSS) using the Colorado Visual Snow Survey 2.0 (CVSS 2.0) and to examine intensity–burden and inter-domain correlation patterns.
Methods: This retrospective cross-sectional study included 72 patients who met the diagnostic criteria for VSS. Symptoms were assessed across ten CVSS 2.0 domains, comprising six visual domains (visual static, afterimages, visual trails, blue-field entoptic phenomenon, floaters, and night vision problems) and four nonvisual domains (tinnitus, depersonalization/derealization, anxiety, and depression). Symptom intensity was defined as the item A score, and functional burden was calculated as the mean of items B, C, and D. Associations between symptom intensity and functional burden, correlations among symptom domains, and the characteristics of participants in the upper quartile of overall burden were analyzed.
Results: The cohort included 72 patients (37 males, 35 females; mean age 27.9 ± 11.85 years). Intensity and burden were significantly correlated in nine domains, excluding afterimages. Visual composite intensity scores were higher than nonvisual scores, whereas no statistically significant difference was detected in functional burden. Blue-field entoptic phenomenon and floaters showed the largest intensity–burden differences. The upper quartile burden subgroup showed greater burden across multiple domains without significant demographic differences.
Conclusions: VSS showed distinct patterns of symptom intensity and functional burden across CVSS 2.0 domains, with significant intensity–burden associations in most domains and broader inter-domain correlations for functional burden. Understanding this broad symptom spectrum may help provide a more comprehensive clinical assessment of patients with VSS.
Keywords: Visual snow syndrome; Colorado Visual Snow Survey; Symptom intensity; Functional burden
Introduction
Visual snow syndrome (VSS) is a neurological condition in which patients continuously perceive dynamic flickering dots across the entire visual field, with this often being compared to the static of an untuned television1. Although patients usually present with visual complaints, VSS is increasingly understood not as a primary eye disease but as a disorder of central visual processing2,3. The current data suggest that the syndrome is distinct from persistent migraine aura and is more appropriately framed as a brain-based perceptual disorder involving abnormal sensory processing4,5.
One important characteristic of VSS is that it extends beyond visual static, with patients also commonly reporting afterimages, visual trails, enhanced entoptic phenomena, photophobia, and nyctalopia, along with nonvisual symptoms such as tinnitus, depersonalization/derealization, anxiety, and depression6,7,8. Neuroimaging studies have reported functional alterations involving regions beyond the primary visual pathways, although the mechanisms underlying the broad symptom profile of VSS remain uncertain. Recent reviews have therefore described VSS as a widespread or network-level disorder that may involve cortical and subcortical dysfunction beyond the classical visual pathways9,10,11.
Evaluating the patient-reported impact of VSS is clinically important because diagnostic criteria alone fail to reflect how patients actually experience the condition. Assessing specific symptom domains offers valuable insight into both perceptual intensity and functional impairment in daily life12,13. Patient-reported measures are uniquely suited for this purpose, capturing subjective perceptual experiences that standard ophthalmic exams cannot detect. In this regard, the newly evaluated Colorado Visual Snow Survey 2.0 (CVSS 2.0) effectively quantifies symptom intensity and functional burden across multiple visual and nonvisual domains, showing substantial utility in distinguishing VSS patients from controls14.
Although previous studies have described the broad range of visual and nonvisual symptoms associated with VSS, the relationship between perceived symptom intensity and symptom-related functional burden remains insufficiently characterized. In particular, it is unclear how intensity and burden differ across visual and nonvisual domains, and how the burden of different symptom domains is interrelated. To address these gaps, we used the CVSS 2.0 to characterize symptom intensity and functional burden across ten domains, examine domain-specific intensity–burden relationships, compare visual and nonvisual domain scores, and explore interdomain correlation patterns as well as the characteristics of patients with high overall burden.
Methods
Study Design and Participants
This retrospective cross-sectional observational study included a consecutive clinic-based series of patients evaluated at the neuro-ophthalmology clinic between September 2024 and April 2026. During this period, CVSS 2.0 was routinely administered to patients who met the diagnostic criteria for VSS. All eligible patients with completed CVSS 2.0 assessments were included, without selection according to symptom intensity, functional burden, demographic characteristics, or clinical outcomes. The study was conducted in accordance with the principles of the Declaration of Helsinki and was approved by the Institutional Review Board of Konkuk University Medical Center (Approval No. KUMC IRB 2026-05-099). The requirement for informed consent was waived by the Institutional Review Board because this was a retrospective review of existing clinical data that involved minimal risk to participants.
Among patients who presented to the neuro-ophthalmology clinic with persistent visual static, 72 individuals who fulfilled the ICHD-3 diagnostic criteria for VSS were included in the study (Table 1). Visual snow was defined as the continuous perception of dynamic, tiny dots across the entire visual field for longer than 3 months. In addition, patients were required to report at least two of the following symptoms: palinopsia, enhanced entoptic phenomena, photophobia, and impaired night vision. The visual symptoms were required to be inconsistent with typical migraine visual aura and not better explained by another ophthalmic, neurologic, or substance-related disorder.
The diagnosis was made by a neuro-ophthalmologist (H.J.S.) based on a detailed history and neuro-ophthalmologic examination. The clinical assessment included the characteristics and duration of visual symptoms, migraine and aura history, medication and recreational drug exposure, visual acuity, pupillary examination, ocular motility assessment, slit-lamp examination, and fundus examination. Additional investigations, including automated perimetry, optical coherence tomography, and neuroimaging, were performed in all patients to rule out alternative causes of the symptoms15. Patients whose symptoms were attributable to retinal disease, persistent migraine aura, hallucinogen-persisting perception disorder, or another neurologic or ophthalmic condition were excluded.
| 1. Dynamic, continuous, tiny dots across the entire visual field, persisting for >3 months 2. Additional visual symptoms of at least two of the following four types: a. Palinopsia b. Enhanced entoptic phenomena c. Photophobia d. Impaired night vision (nyctalopia) 3. Symptoms are not consistent with typical migraine visual aura 4. Symptoms are not better accounted for by another disorder |
Symptom Assessments
Symptoms were assessed using the CVSS 2.0, a patient-reported questionnaire developed to characterize VSS symptom intensity and functional burden across visual and nonvisual domains14. CVSS 2.0 evaluates ten domains: six visual domains (visual static, afterimages, visual trails, blue-field entoptic phenomenon, floaters, and night vision problems) and four nonvisual domains (tinnitus, depersonalization/derealization, anxiety, and depression). Each domain begins with a yes/no screening question asking whether the participant experienced that symptom in the past month; only participants who endorsed a symptom completed the corresponding four rating items for that domain.
The four items (A–D) are each scored on a five-point scale (1, lowest; 5, highest). Item A rates the average perceived intensity of the symptom over the past month. Items B and C both rate symptom-related interference, but the specific activity probed differs by domain type: for the six visual domains, item B addresses interference while using electronic devices (e.g., smartphone, computer, television) and item C addresses interference while viewing the surrounding environment unrelated to screens (e.g., faces, objects, printed text); for tinnitus, item B addresses interference with hearing and item C addresses interference with sleep; for depersonalization/derealization, anxiety, and depression, item B addresses interference with socializing and item C addresses interference with overall feelings of wellness. Item D, common to all ten domains, rates the average degree to which the symptom reduced the participant’s ability to perform daily activities over the past month.
Symptom Grouping
Symptoms were grouped into visual and nonvisual domains following the item design of the CVSS 2.0 instrument itself. The six visual domains (visual static, afterimages, visual trails, blue-field entoptic phenomenon, floaters, and night vision problems) share a common item structure in which items B and C separately probe interference during electronic-device use and interference while viewing the surrounding environment. The four remaining domains (tinnitus, depersonalization/derealization, anxiety, and depression) use distinct item wording not tied to visual function (e.g., interference with hearing and sleep for tinnitus; interference with socializing and overall wellness for the remaining three), and were accordingly classified as nonvisual14.
Outcome Measures
The primary outcomes were domain-specific symptom intensity and functional burden across the ten CVSS 2.0 domains. Symptom intensity was defined as the item A score, and functional burden was calculated as the mean of items B, C, and D. Because CVSS 2.0 administers items A–D only when a symptom is endorsed, non-endorsed domains were not assigned a score and were excluded from the primary endorser-only analyses. Visual, nonvisual, and overall composite scores were calculated for each patient by averaging scores across the corresponding endorsed symptom domains. For comparisons between visual and nonvisual composite scores, only patients who endorsed at least one nonvisual symptom were included.
As a sensitivity analysis, we additionally analyzed the full cohort by assigning a value of 0 to non-endorsed symptoms while retaining the original 1–5 scores for endorsed symptoms. This 0–5 scoring scheme was used solely as an analytic extension for sensitivity analysis and does not represent the original CVSS 2.0 response scale; these results are presented in Supplementary Table 1. The upper quartile burden subgroup was defined using the 75th percentile of the patient-level mean functional burden across endorsed symptoms. Secondary analyses included domain-specific intensity–burden correlations, within-domain differences between intensity and burden, inter-domain correlation patterns, and associations of composite scores with demographic and clinical variables.
Statistical Analyses
Primary analyses were restricted to participants who endorsed the corresponding symptom. Within-domain intensity–burden associations were assessed using Spearman correlation, with 95% confidence intervals, and intensity–burden differences were tested using the Wilcoxon signed-rank test. A full-cohort sensitivity analysis was additionally performed by coding non-endorsed symptoms as 0 while retaining the original 1–5 scores for endorsed symptoms. Inter-domain correlations were calculated pairwise among participants endorsing both symptoms. Visual and nonvisual composite scores were compared using the Wilcoxon signed-rank test, and associations with demographic and clinical variables were assessed using Spearman correlation, the Mann–Whitney U test, or Fisher’s exact test as appropriate. Multiple comparisons were adjusted using the Benjamini–Hochberg false-discovery-rate procedure, with q<0.05 considered statistically significant. FDR correction was applied separately to the 10 domain-specific intensity–burden correlations and to the 45 inter-domain correlations for symptom intensity and functional burden. Statistical analyses were performed using SPSS version 26 (IBM Corp., Armonk, NY, USA), Python 3.13.5 with pandas 2.2.3, NumPy 2.3.5, and SciPy 1.17.0. Figures were generated using Matplotlib 3.10.8.
Results
Demographic and Clinical Characteristics
The analyses included 72 patients with VSS, comprising 37 males and 35 females, with a mean age of 27.9 ± 11.85 years and a mean age at symptom onset of 24.39 ± 11.55 years. The median symptom duration was 12.0 months (IQR, 6.0–40.5 months). Visual static was present in all patients, while the prevalence of the remaining CVSS 2.0 symptom domains ranged from 34.7% for depersonalization/derealization to 80.6% for floaters (Table 2).
| Variables | Total cohort (N = 72) |
| Demographic characteristics | |
| Age, years | 27.90 ± 11.85 |
| Sex, male/female, n (%) | 37 (51.4) / 35 (48.6) |
| Age at symptom onset, years | 24.39 ± 11.55 |
| Symptom duration, months | 12 [6.0–40.5] |
| CVSS 2.0 symptom presence | |
| Visual static | 72 (100.0) |
| Afterimages | 48 (66.7) |
| Visual trails | 27 (37.5) |
| Blue-field entoptic phenomenon | 53 (73.6) |
| Floaters | 58 (80.6) |
| Night vision problems | 42 (58.3) |
| Tinnitus | 35 (48.6) |
| Depersonalization/derealization | 25 (34.7) |
| Anxiety | 56 (77.8) |
| Depression | 47 (65.3) |
Relationship between Symptom Intensity and Functional Burden
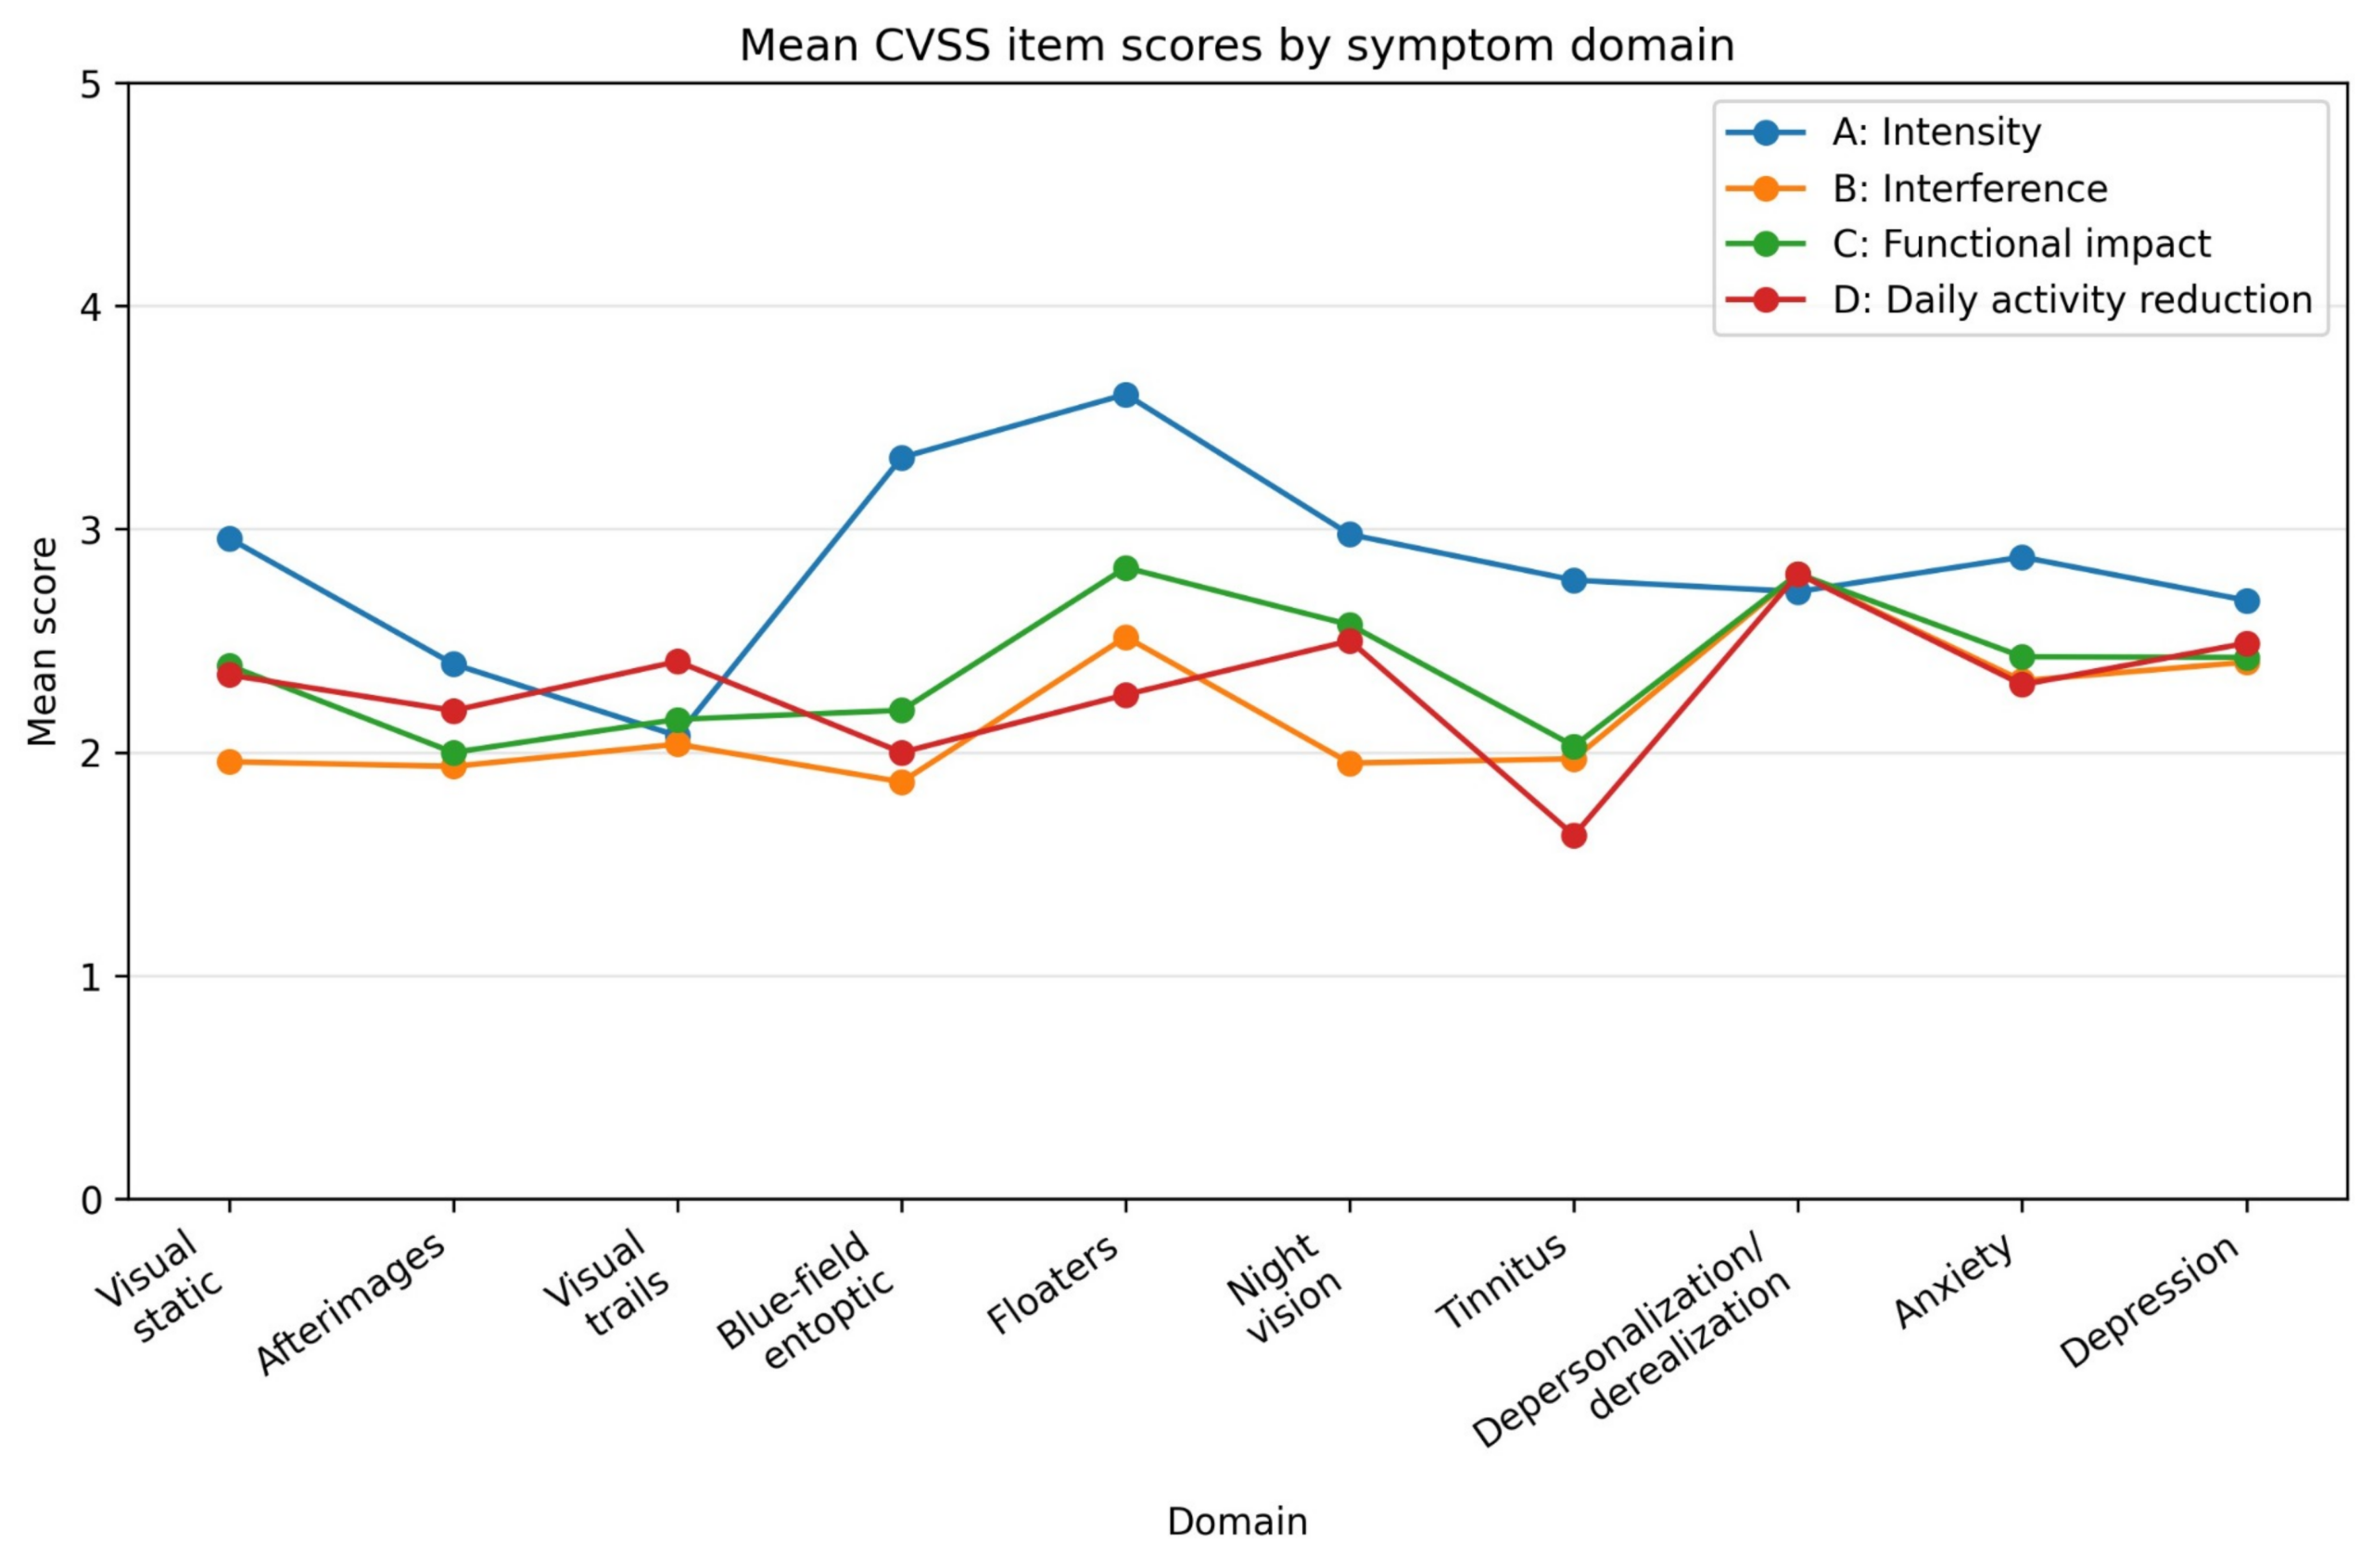
Among symptom endorsers, intensity was positively correlated with functional burden in 9 of the 10 CVSS 2.0 domains after FDR correction (Table 3). The correlation was strongest for anxiety (n=56, ρ=0.732, q<0.001), followed by depression (n=47, ρ=0.628, q<0.001), whereas afterimages showed the weakest correlation (n=48, ρ=0.202, q=0.169) and was the only domain without a statistically significant association. In the full-cohort sensitivity analysis, correlations were generally stronger, consistent with the influence of shared structural zeros introduced by coding non-endorsed symptoms as 0. Accordingly, endorser-only analyses were retained as the primary analysis, with the full-cohort results presented in Supplementary Table 1.
The mean scores for CVSS 2.0 items A–D across symptom domains are shown in Figure 1. Blue-field entoptic phenomenon and floaters showed the largest positive differences, whereas visual trails and depersonalization/derealization showed little difference between intensity and burden. Overall, symptom intensity exceeded functional burden in most domains, although the magnitude of the difference varied across symptoms.
| Domain | Group | Symptom endorsers, n (%) | Intensity, mean ± SD | Functional burden, mean ± SD | Spearman ρ (95% CI) | Raw p | FDR-adjusted q |
| Visual static | Visual | 72 (100.0%) | 2.96 ± 1.05 | 2.23 ± 0.84 | 0.577 (0.385 to 0.732) | <0.001 | <0.001 |
| Afterimages | Visual | 48 (66.7%) | 2.40 ± 0.94 | 2.04 ± 0.77 | 0.202 (-0.131 to 0.506) | 0.169 | 0.169 |
| Visual trails | Visual | 27 (37.5%) | 2.07 ± 0.96 | 2.20 ± 0.83 | 0.425 (0.010 to 0.766) | 0.027 | 0.030 |
| Blue-field entoptic phenomenon | Visual | 53 (73.6%) | 3.32 ± 1.07 | 2.02 ± 0.84 | 0.360 (0.073 to 0.610) | 0.008 | 0.010 |
| Floaters | Visual | 58 (80.6%) | 3.60 ± 0.92 | 2.53 ± 1.05 | 0.468 (0.219 to 0.678) | <0.001 | <0.001 |
| Night vision problems | Visual | 42 (58.3%) | 2.98 ± 1.05 | 2.34 ± 1.05 | 0.420 (0.070 to 0.698) | 0.006 | 0.008 |
| Tinnitus | Nonvisual | 35 (48.6%) | 2.77 ± 1.06 | 1.88 ± 0.97 | 0.537 (0.188 to 0.811) | <0.001 | 0.002 |
| Depersonalization/derealization | Nonvisual | 25 (34.7%) | 2.72 ± 1.10 | 2.80 ± 1.13 | 0.550 (0.128 to 0.838) | 0.004 | 0.007 |
| Anxiety | Nonvisual | 56 (77.8%) | 2.88 ± 1.03 | 2.35 ± 1.06 | 0.732 (0.564 to 0.846) | <0.001 | <0.001 |
| Depression | Nonvisual | 47 (65.3%) | 2.68 ± 0.75 | 2.44 ± 0.94 | 0.628 (0.413 to 0.790) | <0.001 | <0.001 |
Note. Intensity was defined as CVSS 2.0 item A (1–5), and functional burden was calculated as the mean of items B, C, and D (1–5). Only participants who endorsed the corresponding symptom were included in each domain-specific analysis. Spearman correlation coefficients are presented with 95% confidence intervals. Raw p values were adjusted using the Benjamini–Hochberg false-discovery-rate procedure across the 10 domain-specific correlation tests, with q < 0.05 considered statistically significant. CVSS 2.0, Colorado Visual Snow Survey 2.0; CI, confidence interval; FDR, false discovery rate; SD, standard deviation.
Comparison between Visual and Nonvisual Domains
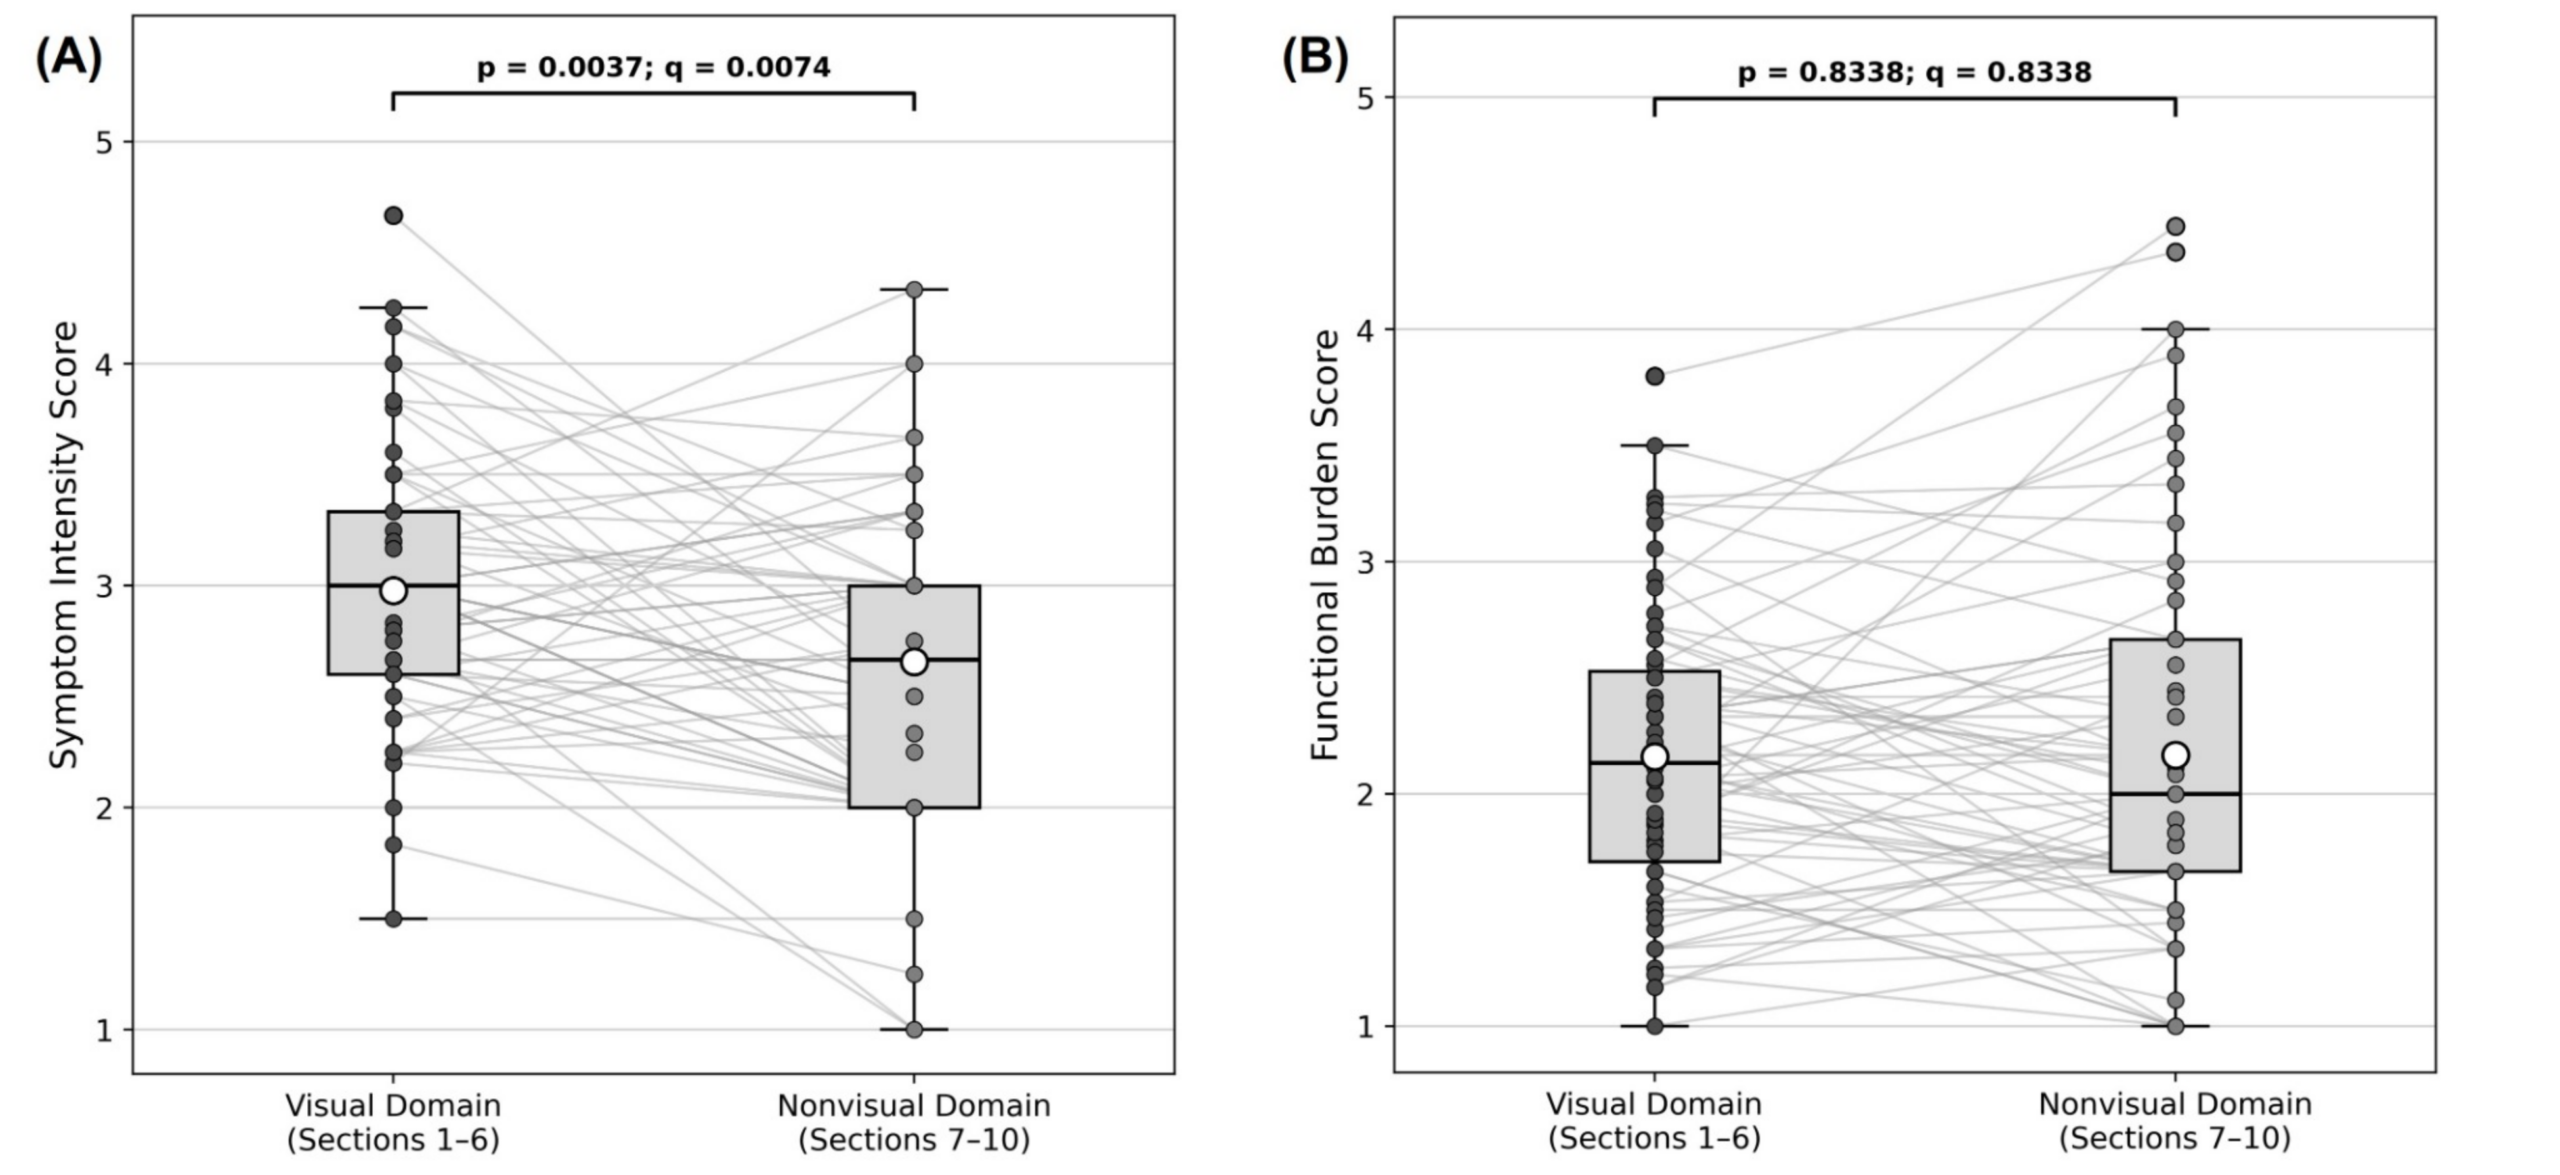
Among the 63 patients with at least one endorsed nonvisual symptom, visual composite intensity scores were significantly higher than nonvisual composite intensity scores (2.978 vs 2.656; p=0.0037, q=0.0074) (Figure 2A). In contrast, no statistically significant difference was detected between visual and nonvisual composite functional burden scores (2.161 vs 2.166; p=0.8338, q=0.8338) (Figure 2B).
Correlation Patterns and Clinical Associations
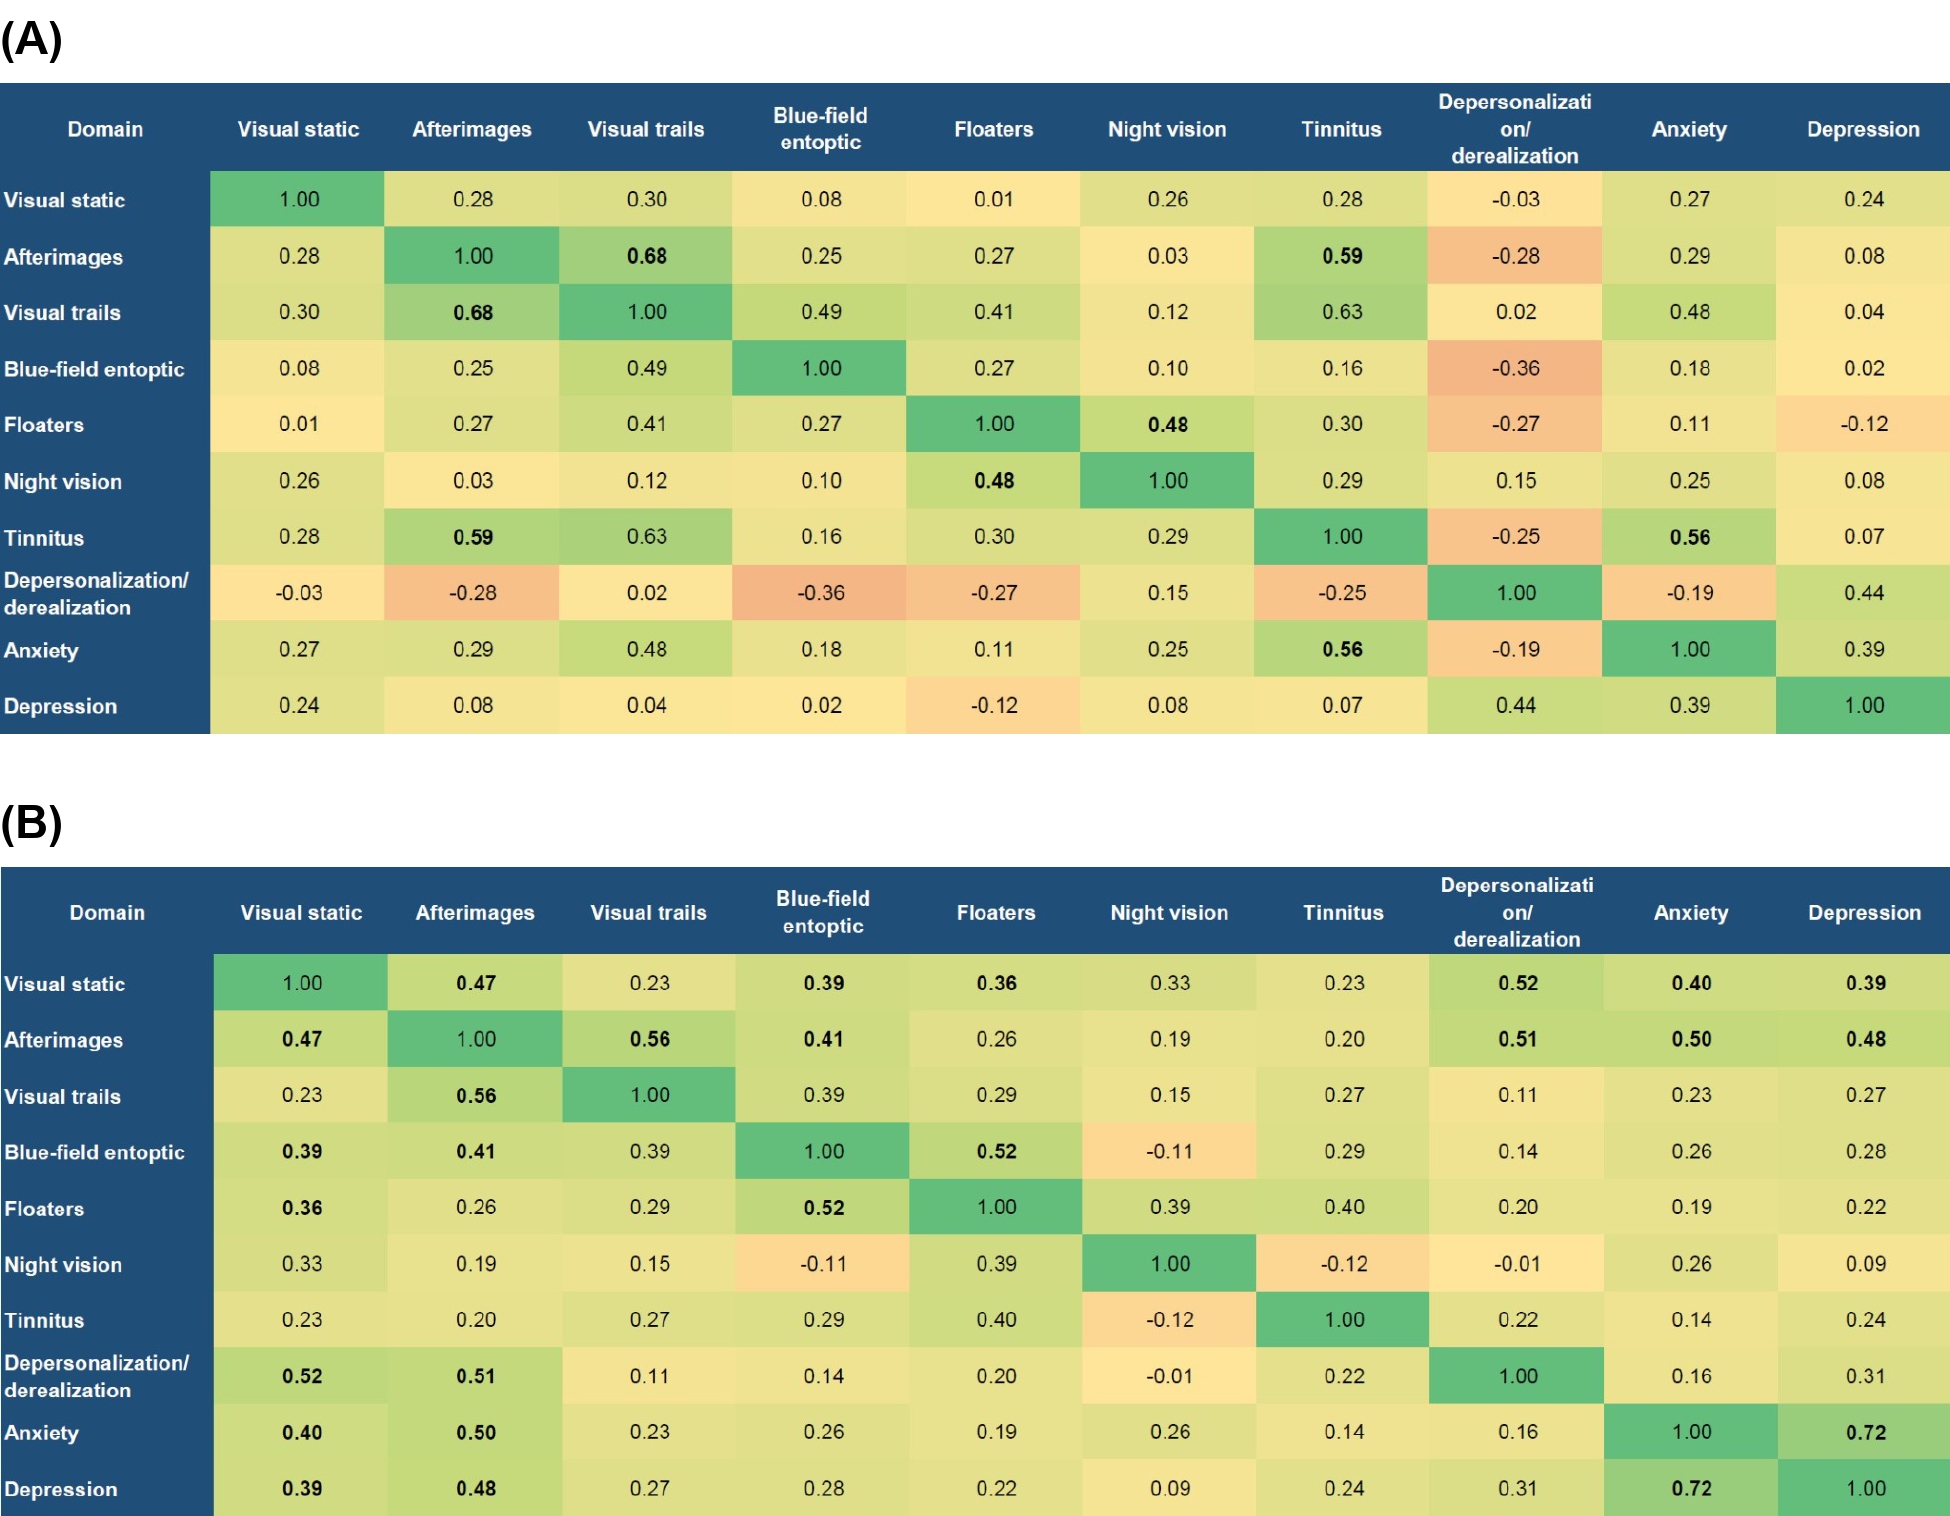
Correlation heatmap analysis demonstrated that inter-domain correlations were more extensive for functional burden than for symptom intensity. After FDR correction, significant correlations were observed in 13 of 45 domain pairs for burden compared with 4 of 45 pairs for intensity. The strongest intensity correlation was observed between afterimages and visual trails (ρ=0.676, q=0.013), whereas the strongest burden correlation was observed between anxiety and depression (ρ=0.715, q<0.001). Afterimages and visual trails were also significantly correlated for burden (ρ=0.556, q=0.027), and blue-field entoptic phenomenon and floaters showed a significant burden correlation (ρ=0.522, q=0.004). Overall, the median inter-domain correlation was higher for functional burden than for symptom intensity (ρ=0.273 [IQR 0.198–0.391] vs 0.241 [IQR 0.036–0.302]), and burden correlations were numerically higher in 30 of the 45 matched domain pairs (Figure 3A and B).
Age, age at onset, and symptom duration were not significantly associated with overall symptom intensity or functional burden, and no significant sex differences were detected. In particular, symptom duration was not significantly associated with overall functional burden (Spearman ρ=0.077, 95% CI −0.155 to 0.302; p=0.518).
Characteristics of the Upper Quartile Burden Subgroup
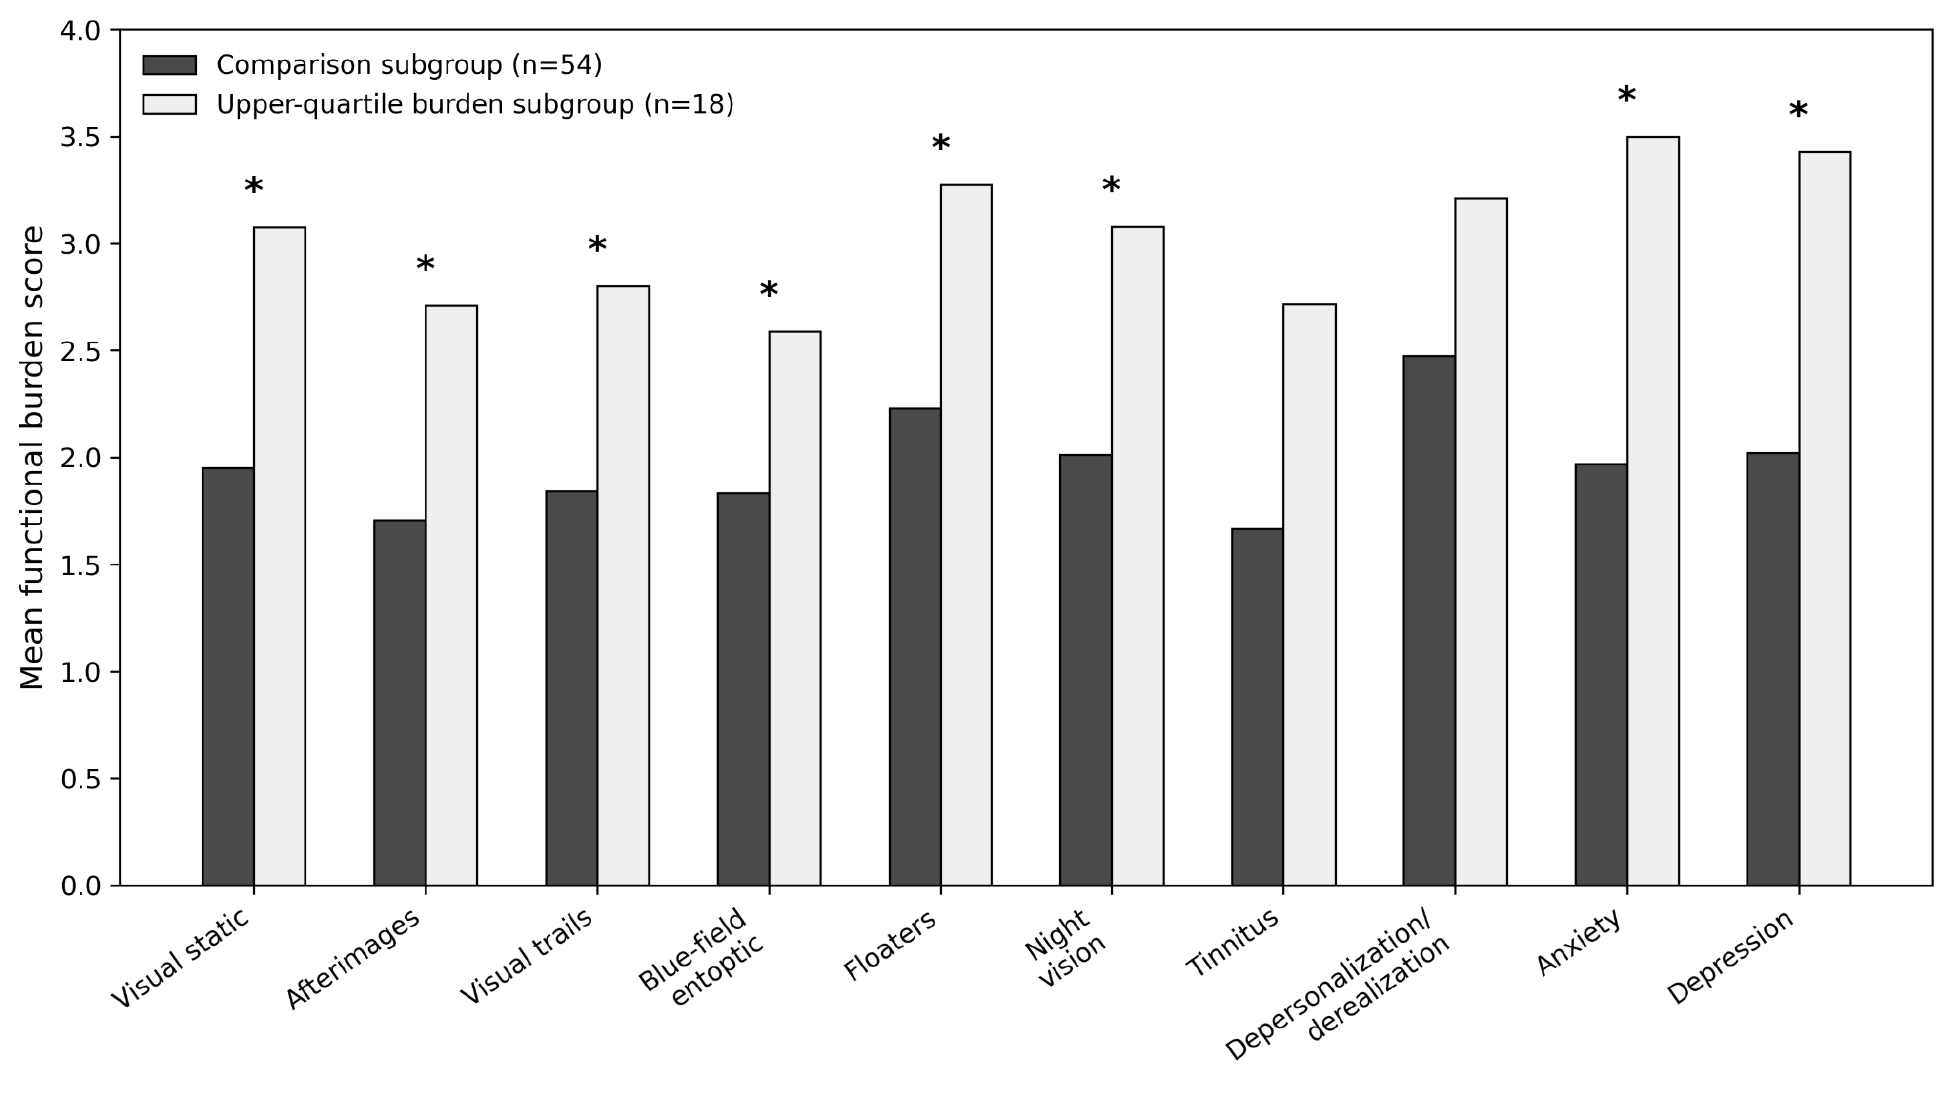
Using the mean functional burden across endorsed symptoms, the 75th-percentile cutoff was 2.509, identifying 18 patients in the upper quartile burden subgroup and 54 in the comparison group. There were no significant differences in sex, age, age at onset, or symptom duration between the groups. The upper quartile burden subgroup showed higher overall symptom intensity and higher visual intensity and burden scores; among patients with endorsed nonvisual symptoms, nonvisual intensity and burden scores were also higher (Table 4). At the individual-domain level, the largest mean burden differences were observed for anxiety, depression, visual static, and night vision problems. After FDR correction, between-group burden differences remained significant in eight of the ten domains, with tinnitus and depersonalization/derealization being the exceptions (Figure 4).
| Variable | Comparison Subgroup (n=54) | Upper quartile subgroup (n=18) | P value |
| Female, n (%) | 26 (48.1) | 9 (50.0) | 1.000 |
| Age, years | 27.19 ± 11.89 | 30.06 ± 11.77 | 0.494 |
| Onset age, years | 24.24 ± 11.87 | 24.83 ± 10.84 | 0.800 |
| Duration, months | 12 [6.0–37.5] | 12 [8.0–45.0] | 0.510 |
| Overall intensity | 2.68 ± 0.59 | 3.41 ± 0.39 | <0.001 |
| Overall burden | 1.89 ± 0.38 | 3.06 ± 0.38 | <0.001 |
| Visual intensity | 2.79 ± 0.68 | 3.42 ± 0.56 | <0.001 |
| Visual burden | 1.91 ± 0.45 | 2.92 ± 0.48 | <0.001 |
| Nonvisual intensity† | 2.47 ± 0.62 | 3.26 ± 0.60 | <0.001 |
| Nonvisual burden† | 1.84 ± 0.50 | 3.21 ± 0.85 | <0.001 |
Note. The upper quartile burden subgroup was defined as a patient-level mean functional burden score across endorsed symptoms at or above the 75th percentile (cutoff ≥2.509). Values are presented as mean ± SD, median [IQR], or n (%), as appropriate. †Nonvisual composite scores were calculated only among patients who endorsed at least one nonvisual symptom (comparison subgroup, n=48; upper quartile burden subgroup, n=15).
Discussion
In this study of 72 patients with VSS, symptom intensity and functional burden were positively correlated in nine of ten symptom domains. Floaters and blue-field entoptic phenomenon showed the largest differences between intensity and burden scores. Among patients reporting nonvisual symptoms, visual symptoms were rated as more intense, whereas visual and nonvisual burden scores did not differ significantly. Significant correlations between symptom domains were also more frequent for burden than for intensity. Together, these findings suggest that assessing both symptom intensity and its impact on daily activities may provide a more complete description of patients’ experiences with VSS.
Symptom intensity and functional burden should be assessed separately. In our cohort, floaters and blue-field entoptic phenomenon showed the largest differences between intensity and burden scores, with burden scores being lower. For afterimages, the intensity–burden correlation was weak and not statistically significant. One possible explanation is that burden reflects not only symptom intensity but also viewing conditions and coping strategies. A VSS diary study found that symptoms were worse under indoor and fluorescent lighting than under natural outdoor lighting13. A qualitative study of patients with vitreous floaters found that discomfort varied with lighting and eye movements, and patients reported adjusting screen settings to help them read17. Such adjustments may limit interference with daily activities even when symptoms are prominent. Some patients in our cohort also reported relief from floaters and blue-field entoptic phenomenon after using FL-41 tinted lenses. These observations were not analyzed, and we did not assess viewing conditions or coping strategies. Whether these factors explain the intensity–burden differences in VSS remains uncertain. Future studies should examine how these factors relate to daily burden.
Nonvisual symptoms should be assessed when evaluating the daily burden of VSS. When patients seek care for visual symptoms, the diagnostic interview may focus on their visual complaints. However, among patients reporting nonvisual symptoms in our cohort, visual symptoms were rated as more intense, whereas burden scores did not differ significantly between the two categories. Depersonalization/derealization was the least commonly reported symptom, yet its mean burden score among those reporting it was 2.80. This suggests that less common symptoms may still be important to the patients who experience them. Tinnitus, anxiety, and depression have been reported as comorbid conditions in patients with visual snow18,19. Solly et al. found that psychiatric symptoms, including anxiety, depression, and depersonalization, were associated with poorer quality of life20. More recently, Huang et al. reported higher depressive symptom scores and lower quality of life in patients with VSS than in controls21. A recent review suggests that psychiatric symptoms may be part of VSS itself, potentially sharing underlying neural mechanisms with visual symptoms22. Together with our findings, these reports support assessing the daily impact of nonvisual symptoms, even when they are less intense or less commonly reported.
When a patient with VSS reports substantial burden from one symptom, clinicians should ask whether other symptoms also interfere with daily life. In our study, significant correlations between symptom domains were more frequent for burden than for intensity (13 versus 4 of 45 pairs). Burden correlated between anxiety and depressive symptoms, afterimages and visual trails, and floaters and blue-field entoptic phenomenon. The exploratory upper-quartile burden subgroup also reported higher burden across several domains, with the largest differences from the remaining patients involving anxiety, depressive symptoms, visual static, and night vision problems. Differences remained significant in eight of ten domains after FDR correction. Clinical assessment can therefore begin with the main complaint and then explore other symptoms that affect activities the patient finds difficult. For example, patients who struggle with computer use or reading can be asked which symptoms, beyond their main complaint, interfere with these activities.
Long symptom duration should not be assumed to indicate low current burden. In our cohort, overall intensity and burden were not significantly associated with age, age at onset, or symptom duration, and neither differed significantly by sex. Previous studies found no significant association between duration and visual symptom count23, or differences in psychiatric symptom severity by sex or onset type20. However, Thompson et al. found that longer symptom duration was associated with lower Visual Snow Handicap Inventory scores24. These studies used different measures and do not establish how an individual’s burden changes over time. In a longitudinal study, Graber et al. found that the most bothersome symptom could change over time despite persistent visual snow25. Longitudinal assessments are therefore needed to distinguish differences between patients from changes in an individual’s burden and to explore possible habituation.
This study extends previous work on the CVSS 2.0 by examining symptom-specific relationships between intensity and functional burden in clinically diagnosed patients with VSS. Maione et al. measured both intensity and functional impact, focusing mainly on internal consistency and the ability to distinguish VSS from control groups14. Our analysis examined these relationships within the VSS cohort, including only patients who reported each symptom, to better describe their difficulties after diagnosis. This distinction matters because a symptom that helps distinguish VSS from controls may not be the one that most disrupts an individual patient’s life. An online qualitative study also documented difficulties with reading, driving, and digital device use among participants with self-reported VSS26. When reviewing survey responses, clinicians can therefore follow “How intense is the symptom?” with “Which activities does it interfere with, and which difficulty would you most like help with?” This approach may help guide the consultation toward activities that matter to the patient, such as reading or working, and identify their priorities for support.
This small, single-center, retrospective cross-sectional study has limited generalizability and cannot assess changes over time. Functional burden was self-reported and was not compared with independent measures of functioning. The burden score, calculated as the mean of items B–D, has not been independently validated, so numerical differences between intensity and burden should be interpreted cautiously. Visual and nonvisual domains also used different interference questions, limiting direct comparison. Sample sizes varied by symptom, and patients’ composite scores included different sets of reported symptoms. The upper-quartile burden subgroup was an exploratory, sample-dependent classification. Multicenter longitudinal studies with independent functional measures and repeated assessments are needed to confirm these findings and examine changes over time.
In patients with VSS, symptom intensity and functional burden were correlated in most CVSS 2.0 domains, but this relationship varied by symptom. Significant correlations between domains were more frequent for burden than for intensity. Among patients reporting nonvisual symptoms, visual symptoms were rated as more intense, whereas burden did not differ significantly between the two categories. Assessing both intensity and interference with daily activities across visual and nonvisual symptoms may provide a more complete picture of each patient’s difficulties.
Author Contributions: Y.S.: literature review, data curation, questionnaire score coding, figure and table preparation, preliminary data interpretation, and original manuscript drafting. H.J.S.: conceptualization, study design, clinical supervision, patient diagnosis and eligibility confirmation, ethics and data de-identification oversight, statistical interpretation, clinical interpretation, manuscript review and editing, and project supervision.
Data Availability Statement: The minimal anonymized dataset required to reproduce the findings of our study has been deposited in a public repository (Figshare) and is accessible via the following DOI: https://doi.org/10.6084/m9.figshare.34876923
Institutional Review Board Statement: The study was conducted in accordance with the Declaration of Helsinki and approved by the Institutional Review Board of Konkuk University Medical Center (approval No. KUMC IRB 2026-05-099).
Informed Consent Statement: Patient consent was waived because of the retrospective nature of the study and the use of anonymized clinical data.
Acknowledgments: The authors gratefully acknowledge Dr. Victoria S. Pelak of the University of Colorado for her permission to use the Colorado Visual Snow Survey 2.0 (CVSS 2.0) for symptom assessment in this study.
Conflicts of Interest: The authors declare no conflicts of interest.
Supplementary Material
References
- G. L. Traber, M. Piccirelli, L. Michels. Visual snow syndrome: a review on diagnosis, pathophysiology, and treatment. Curr Opin Neurol. Vol. 33, pg. 74-78, 2020, https://doi.org/10.1097/WCO.0000000000000768. [↩]
- C. L. Fraser. Visual snow: updates on pathology. Curr Neurol Neurosci Rep. Vol. 22, pg. 209-217, 2022, https://doi.org/10.1007/s11910-022-01182-x. [↩]
- S. A. Aeschlimann, A. Klein, C. J. Schankin. Visual snow syndrome: recent advances in understanding the pathophysiology and potential treatment approaches. Curr Opin Neurol. Vol. 37, pg. 283-288, 2024, https://doi.org/10.1097/WCO.0000000000001258. [↩]
- S. Braca, V. Santoro, G. Sebastianelli, C. J. Schankin, P. J. Goadsby, F. Puledda. Visual snow vs. migraine aura: debate summary and novel insights into the syndrome. Cephalalgia. Vol. 45, pg. 03331024251365908, 2025, https://doi.org/10.1177/03331024251365908. [↩]
- C. J. Schankin, F. H. Maniyar, K. B. Digre, P. J. Goadsby. ‘Visual snow’ – a disorder distinct from persistent migraine aura. Brain. Vol. 137, pg. 1419-1428, 2014, https://doi.org/10.1093/brain/awu050. [↩]
- P. Rusztyn, W. Stańska, A. Torbus, P. Maciejewicz. Visual snow: a review on pathophysiology and treatment. J Clin Med. Vol. 12, pg. 3868, 2023, https://doi.org/10.3390/jcm12123868. [↩]
- H. E. Park, H. J. Shin, A. G. Lee. Neuro-ophthalmic findings of visual snow syndrome in Korea. Jpn J Ophthalmol. Vol. 69, pg. 568-576, 2025, https://doi.org/10.1007/s10384-025-01196-1. [↩]
- P. Satgunam, K. Kannan, A. R. Hathibelagal. Understanding visual snow syndrome: a retrospective study from a tertiary eye care center. Indian J Ophthalmol. Vol. 72, pg. 211-216, 2024, https://doi.org/10.4103/IJO.IJO_2180_22. [↩]
- M. Strik, M. J. Clough, E. J. Solly, R. Glarin, O. B. White, S. C. Kolbe, J. Fielding. Altered functional connectivity strength between structurally and functionally affected brain regions in visual snow syndrome. Brain Commun. Vol. 7, pg. fcaf171, 2025, https://doi.org/10.1093/braincomms/fcaf171. [↩]
- A. Klein, C. J. Schankin. Visual snow syndrome as a network disorder: a systematic review. Front Neurol. Vol. 12, pg. 724072, 2021, https://doi.org/10.3389/fneur.2021.724072. [↩]
- F. Puledda, O. O’Daly, C. Schankin, D. Ffytche, S. C. R. Williams, P. J. Goadsby. Disrupted connectivity within visual, attentional and salience networks in the visual snow syndrome. Hum Brain Mapp. Vol. 42, pg. 2032-2044, 2021, https://doi.org/10.1002/hbm.25343. [↩]
- J. I. Stern, C. E. Robertson. Visual snow: updates and narrative review. Curr Pain Headache Rep. Vol. 28, pg. 55-63, 2024, https://doi.org/10.1007/s11916-023-01186-3. [↩]
- F. Puledda, N. Vandenbussche, D. Moreno-Ajona, O. Eren, C. Schankin, P. J. Goadsby. Evaluation of treatment response and symptom progression in 400 patients with visual snow syndrome. Br J Ophthalmol. Vol. 106, pg. 1318-1324, 2022, https://doi.org/10.1136/bjophthalmol-2020-318653. [↩] [↩]
- S. M. Maione, V. S. Pelak, P. Gerhardstein. Assessment of a novel patient reported outcome measure for visual snow syndrome: the Colorado visual snow survey 2.0. Front Neurol. Vol. 16, pg. 1664310, 2025, https://doi.org/10.3389/fneur.2025.1664310. [↩] [↩] [↩] [↩]
- Y. J. Yoo, H. K. Yang, J. Y. Choi, J. S. Kim, J. M. Hwang. Neuro-ophthalmologic findings in visual snow syndrome. J Clin Neurol. Vol. 16, pg. 646-652, 2020, https://doi.org/10.3988/jcn.2020.16.4.646. [↩]
- Headache Classification Committee of the International Headache Society (IHS). The International Classification of Headache Disorders, 3rd edition. Cephalalgia. Vol. 38, pg. 1-211, 2018, https://doi.org/10.1177/0333102417738202. [↩]
- J. E. Woudstra-de Jong, S. S. Manning-Charalampidou, J. H. R. Vingerling, S. J. F. Gerbrandy, K. Pesudovs, J. J. Busschbach. The impact of vitreous floaters on quality of life: a qualitative study. J Patient Rep Outcomes. Vol. 9, pg. 102, 2025, https://doi.org/10.1186/s41687-025-00934-w. [↩]
- S. N. Sampatakakis, L. Lymperopoulos, T. Mavridis, G. Karagiorgis, C. Papadopoulos, C. I. Deligianni, D. D. Mitsikostas. Visual snow: a systematic review and a case series. Cephalalgia. Vol. 42, pg. 1409-1419, 2022, https://doi.org/10.1177/03331024221118917. [↩]
- R. M. van Dongen, L. C. Waaijer, G. L. J. Onderwater, M. D. Ferrari, G. M. Terwindt. Treatment effects and comorbid diseases in 58 patients with visual snow. Neurology. Vol. 93, pg. e398-e403, 2019, https://doi.org/10.1212/WNL.0000000000007825. [↩]
- E. J. Solly, M. Clough, P. Foletta, O. B. White, J. Fielding. The psychiatric symptomology of visual snow syndrome. Front Neurol. Vol. 12, pg. 703006, 2021, https://doi.org/10.3389/fneur.2021.703006. [↩] [↩]
- Q. Huang, X. Yu, H. Gao, X. X. Lin, J. Wang, P. Su, X. Li, D. Chen, D. M. Hermann, Y. Liu. Self-efficacy and quality of life mediate self-reported mental health outcomes in visual snow syndrome. Sci Rep. Vol. 16, pg. 7107, 2026, https://doi.org/10.1038/s41598-026-36347-y. [↩]
- Q. Huang, J. Wang, L. Zhao, X. Yu, W. Wang, Z. Wang, Y. Liu. Visual snow syndrome as a neuropsychiatric network disorder: clinical features, mechanisms, and therapeutic perspectives. J Neurol. Vol. 273, pg. 610, 2026, https://doi.org/10.1007/s00415-026-14137-w. [↩]
- F. Puledda, C. Schankin, P. J. Goadsby. Visual snow syndrome: a clinical and phenotypical description of 1,100 cases. Neurology. Vol. 94, pg. e564-e574, 2020, https://doi.org/10.1212/WNL.0000000000008909. [↩]
- A. C. Thompson, P. T. Goodbourn, J. D. Forte. Perceived severity of visual snow syndrome is associated with visual allodynia. Headache. Vol. 63, pg. 494-505, 2023, https://doi.org/10.1111/head.14455. [↩]
- M. Graber, A. Scutelnic, A. Klein, F. Puledda, P. J. Goadsby, C. J. Schankin. Natural course of visual snow syndrome: a long-term follow-up study. Brain Commun. Vol. 4, pg. fcac230, 2022, https://doi.org/10.1093/braincomms/fcac230. [↩]
- A. C. Thompson, G. F. Caruana, J. M. Paul, O. Carter, J. D. Forte. “I feel like I’m in a dream”: a qualitative investigation of the lived experience of visual snow syndrome. Front Neurol. Vol. 17, pg. 1973126, 2026, https://doi.org/10.3389/fneur.2026.1973126. [↩]