

Abstract
IgA nephropathy (IgAN) causes an inflammation of the glomeruli by an accumulation of Immunoglobulin A antibodies, and there are many patient characteristics that have been found to highly correlate with and potentially further advance the pathogenesis of this disease. In this study, we built models studying whether IgAN patient characteristics such as Age, Sex, Weight, Proteinuria, and BMI could predict eGFR and therefore be correlated with decreased kidney function. We created three models called SAWP (n=19), SAW (n=38), SABMI (n=30). Using statistical modeling, we generated multiple models to determine which combination of patient characteristics best correlated with decreased eGFR. Out of the five factors tested, Age and Weight were found to be statistically significant factors associated with eGFR. Therefore, both Age and Weight may have a strong influence on IgAN patient outcome relative to other characteristics.
Keywprds: IgA Nephropathy, Kidney disease, Machine Learning, eGFR
Introduction and Literature Review
IgA Nephropathy: General Biology
IgA nephropathy(IgAN) is a primary form of glomerulonephritis; a disease that causes an inflammation of the glomeruli1. It is caused by a build up of galactose deficient IgA-1(Gd-IgA1), an immunoglobulin with abnormal sugar chains in the glomeruli. It is prominent in East and Pacific Asian communities as it is diagnosed in “40−50% of all kidney biopsies performed, compared with 10−20% in North America, up to 20% in Europe and <5% in Africa”2,3. It is also known as a “silent killer” disease as it requires a kidney biopsy to be diagnosed3.
Since IgAN causes inflammation in the kidneys, this compromises the organ’s ability to filter waste in the glomeruli. Its progression is typically measured by the decrease in estimated glomerular filtration rate (eGFR). eGFR has been typically calculated using a combination of Age, Sex, Weight, or blood serum creatinine4.
IgA Nephropathy: Patient Characteristics
IgAN in East Asia has a male to female ratio of <2:1, while Europe and the United States have a reported ratio of 6:15. Additionally, proteinuria (excess protein found in urine) has been found to be a reliable clinical indicator of chronic kidney disease progression because kidney inflammation causes protein leakage into the urine. As proteinuria increases, eGFR noticeably declines over time as patients age, resulting in eventual kidney failure in IgAN patients6. Finally, elevated BMI and weight increases likelihood for hypertension and chronic renal failure, which can be severely detrimental to IgAN patients7 . Recently, geriatric nutritional risk index (GNRI) has been shown to predict renal function in IgAN patients with greater success as it predicts end-stage renal disease more accurately8. While this metric was not used in this study due to lack of available data, more research has to be done in order to discern the relationship between GNRI and IgAN pathogenesis.
Currently, a blood test has to be done to measure serum creatinine in the blood to calculate eGFR, and thus infer the stage of IgAN progression. However, developing and deploying an accurate machine learning based model to predict eGFR and kidney function based on readily available, noninvasive patient data can help doctors and researchers more accurately identify at-risk patients, and catch it earlier to further advance IgAN treatment options and patient outcomes.
Methodology
In this study, we utilized multiple regression models, with data gathered from online clinical studies, to explore the relative influences of various patient characteristics (Age, Sex, Weight, Proteinuria, BMI) in IgAN, using eGFR as a measure of kidney function. Previous clinical studies have investigated these individual demographic and clinical factors associated with kidney function in IgAN3,5,6,7. For example, Sex is associated with different outcomes in IgAN patients as male patients have been found to have poorer outcomes than female9,10. Previous studies have found that extreme BMI is also a significant risk factor for IgAN progression9,11,12,13,14. In Japanese patients with IgAN, Shimamoto et.al compared patient groups with different BMIs (classified into lean, middle, and obese), and those with obesity (defined as 23.1-31.9 kg/m2) had significantly worse clinical outcomes than the other groups15. In contrast, Ouyang et.al found that underweight patients with IgAN had the highest risk of end-stage kidney disease compared to IgAN patients with BMIs of normal, overweight, and obese16. Reduction in Proteinuria over a long period of time is associated with improved IgAN patient outcomes17. Finally, literature on the effect of Age on kidney function in IgAN patients has been mixed on whether it is significant or not. For example, Pitcher et al. found it to be associated with decreased kidney function in IgAN patients, while Wen et.al asked for a longer follow up time with the patients to ensure the trend is accurate6,18. In our study, we examined the relationship of several highly relevant and previously verified patient characteristics at once since while there are many papers that study these factors, we are presenting an integrated approach to study the associations with eGFR.
We specifically anticipate Sex and Age to be the strongest factors of decreased eGFR as they are used to directly calculate this index (MDRD-eGFR equation). Additionally, BMI, Weight, and Proteinuria are relevant indicators of kidney function decline, so they can be used to compare the relationships and relative predictive power of other relevant patient characteristics as well5,6,7.
Methodology
By using digital data sets, research papers, and virtual collaboration, it was entirely feasible to conduct this study virtually. This research was conducted by using PubMed and Nephroseq (www.nephroseq.org), a database containing IgAN patient data from various clinical studies. Specifically, we used patient data from three existing clinical experiments to train several regression models19,20,21. All of these clinical experiments studied IgA Nephropathy and included the patient characteristics needed to run our models. Patient data was extracted from these three studies, and we included various patient metrics mentioned above such as Sex, Age, Weight (kg) , BMI (kg/m²), eGFR (mL/min/1.73 m²), and Proteinuria (g/24h). All of these characteristics have been found to independently correlate with IgAN progression and a decrease in eGFR, so they are good candidates for our predictors.
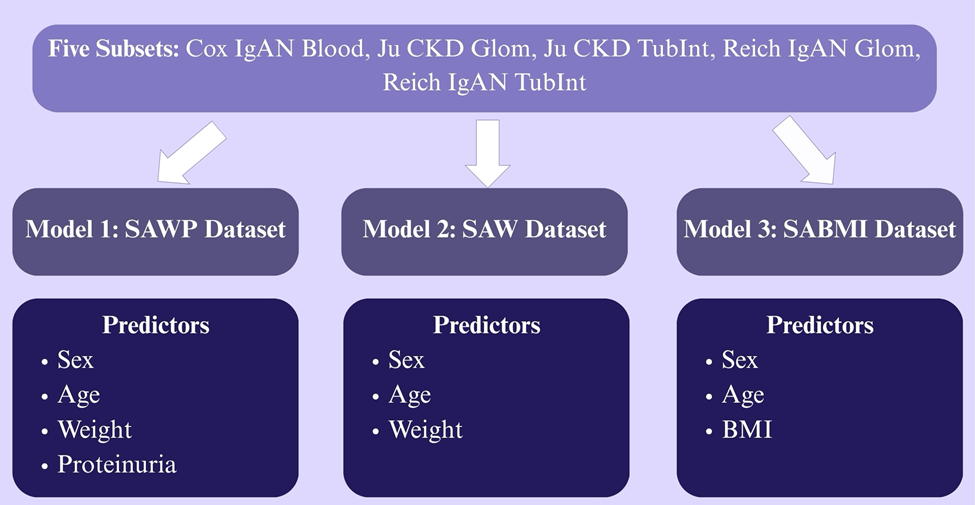
Since each of these clinical trials omitted Weight, BMI, or Proteinuria, as they were not reported consistently, three different datasets were created to equally study the effects of the predictors on eGFR: SAWP (Sex, Age, Weight, Proteinuria); SAW (Sex, Age, Weight); SABMI (Sex, Age, BMI) (for a breakdown of each dataset see Figure 1). Patients were included in each model if they had IgAN and the patient characteristics with each corresponding model. Excluded patients included those with IgM Nephropathy or who lacked any predictor required for a specific model. Sex and Age were included in every dataset as constants, to see how they would change when used in combination with other predictors to predict eGFR. Sex variables were converted into numeric values of Female=0 and Male=1. Additionally, all of the numeric variables, discounting Sex, were scaled using StandardScaler from sklearn.preprocessing to ensure that all the numeric predictors contributed equally to the models22.
We ran an ordinary least squares (OLS) regression using the Statsmodels package in Python23. Regression modeling was used to predict a patient’s kidney function, measured with eGFR, based on their various patient characteristics that have been found to be indicators of IgAN progression. Specifically, our regression models examined how patient Sex, Age (years), Weight (kg), Proteinuria at biopsy (g/24h), and Body Mass Index (kg/m²) were associated with decreased kidney function, measured by eGFR (calculated with the MDRD equation) at Biopsy (mL/min/1.73m²). We did not use a combined model of all patient characteristics as not all patients had Weight, BMI, and Proteinuria data consistently reported. Additionally, Weight and BMI are redundant as BMI is calculated with weight, so we wanted to avoid multicollinearity and instead chose to separate them to see which physical metric has a more significant effect in IgAN patients. Furthermore, a forest plot, partial regression, observed vs predicted eGFR plots were created to observe whether each of the predictors had a meaningful relationship with eGFR.
Finally, because we are using real patient data from actual experiments, the right attribution and confidentiality must be used. All of the data is public data that is available for anyone to use; however, it must be properly cited in order to give credit to the researchers. Furthermore, no personal patient data was disclosed as it violates the patient’s trust and integrity of this paper.
Results
| Model | 1 | 2 | 3 | ||||||||||
| Predictors | Intercept | Sex | Age | Weight | Proteinuria | Intercept | Sex | Age | Weight | Intercept | Sex | Age | BMI |
| R² | 0.332 | 0.332 | 0.332 | 0.332 | 0.332 | 0.243 | 0.243 | 0.243 | 0.243 | 0.131 | 0.131 | 0.131 | 0.131 |
| Adj. R² | 0.141 | 0.141 | 0.141 | 0.141 | 0.141 | 0.176 | 0.176 | 0.176 | 0.176 | 0.031 | 0.031 | 0.031 | 0.031 |
| F-statistic | 1.740 | 1.740 | 1.740 | 1.740 | 1.740 | 3.636 | 3.636 | 3.636 | 3.636 | 1.309 | 1.309 | 1.309 | 1.309 |
| Prob(F) | 0.197 | 0.197 | 0.197 | 0.197 | 0.197 | 0.0223 | 0.0223 | 0.0223 | 0.0223 | 0.293 | 0.293 | 0.293 | 0.293 |
| AIC | 186.9 | 186.9 | 186.9 | 186.9 | 186.9 | 376.2 | 376.2 | 376.2 | 376.2 | 305.2 | 305.2 | 305.2 | 305.2 |
| BIC | 191.6 | 191.6 | 191.6 | 191.6 | 191.6 | 382.8 | 382.8 | 382.8 | 382.8 | 310.8 | 310.8 | 310.8 | 310.8 |
| Coef | 72.0481 | 12.5266 | -7.3768 | -11.5377 | -7.3019 | 67.4775 | 6.2361 | -11.9323 | -12.6387 | 66.8915 | -0.6565 | -11.4014 | -5.9147 |
| Std Err | 13.797 | 17.551 | 7.716 | 7.758 | 7.303 | 12.301 | 14.563 | 5.715 | 5.778 | 17.029 | 19.560 | 7.872 | 6.788 |
| t | 5.222 | 0.714 | -0.956 | -1.487 | -1.000 | 5.485 | 0.428 | -2.088 | -2.187 | 3.928 | -0.034 | -1.448 | -0.871 |
| p | 0.000 | 0.487 | 0.355 | 0.159 | 0.334 | 0.000 | 0.671 | 0.044 | 0.036 | 0.001 | 0.973 | 0.159 | 0.392 |
| SAWP | N | Mean | SD | Median | Min | Max |
| eGFR | 19 | 80.62 | 31.95 | 82 | 15.87 | 134.65 |
| Age | 19 | 35.3 | 15.28 | 33.16 | 14.73 | 83.89 |
| Weight | 19 | 72.21 | 14.21 | 72 | 50 | 104 |
| Proteinuria | 19 | 1.67 | 1.45 | 0.91 | 0.19 | 4.2 |
| Sex | Count | Percent | ||||
| Male | 13 | 68.4 | ||||
| Female | 6 | 31.6 |
| SAW | N | Mean | SD | Median | Min | Max |
| eGFR | 38 | 72.24 | 35.82 | 77.46 | 7.59 | 135 |
| Age | 38 | 37.72 | 15.27 | 35.72 | 14.72 | 83.89 |
| Weight | 38 | 75.84 | 13.96 | 77 | 50 | 104 |
| Sex | Count | Percent | ||||
| Male | 29 | 76.3 | ||||
| Female | 9 | 23.7 |
| SABMI | N | Mean | SD | Median | Min | Max |
| eGFR | 30 | 66.37 | 37.37 | 66.22 | 7.59 | 135 |
| Age | 30 | 38.63 | 16.31 | 35.99 | 14.72 | 83.89 |
| BMI | 30 | 26.34 | 4.09 | 25.3 | 20.2 | 33 |
| Sex | Count | Percent | ||||
| Male | 24 | 80 | ||||
| Female | 6 | 20 |
| Model | Statistical Assumption | Assessment Type | Test Statistic | p-value | Conclusion |
| SAWP model | Normality of residuals | Shapiro-Wilk test | W=0.944 | p=0.317 | No evidence of departure from normality |
| SAWP model | Homoscedasticity | Breusch-Pagan test | LM=7.06 | p=0.133 | No evidence of heteroscedasticity |
| SAW model | Normality of residuals | Shapiro-Wilk test | W=0.914 | p=0.007 | Evidence of departure from normality |
| SAW model | Homoscedasticity | Breusch-Pagan test | LM=0.668 | p=0.881 | No evidence of heteroscedasticity |
| SABMI model | Normality of residuals | Shapiro-Wilk test | W=0.913 | p=0.018 | Evidence of departure from normality |
| SABMI model | Homoscedasticity | Breusch-Pagan test | LM=4.29 | p=0.232 | No evidence of heteroscedasticity |
Model 1: SAWP dataset
The SAWP model extracted the predictors of Sex, Age, Weight, and Proteinuria from a subset of all our data, with a sample size of 19 patients (Table 2A). It predicts 14.1% (adjusted R2) of eGFR variation in IgAN patients. Adjusted R2 values greater than 15% indicate that the models explain a modest but clinically meaningful proportion of the variability in the eGFR. This is consistent with clinical studies where variance is often modest as outcomes are influenced by many biological, behavioral, and environmental factors24. The p-value of 0.197 and the p-values for each predictor suggest that the model overall was not significant, implying these variables together and separately do not significantly predict eGFR (Table 1).
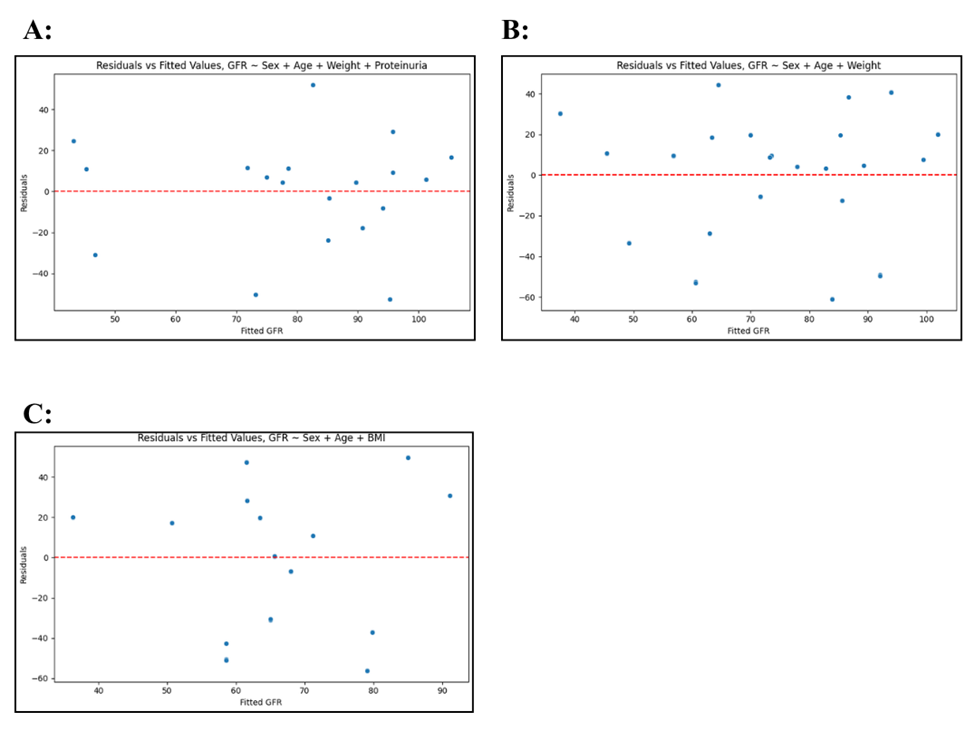
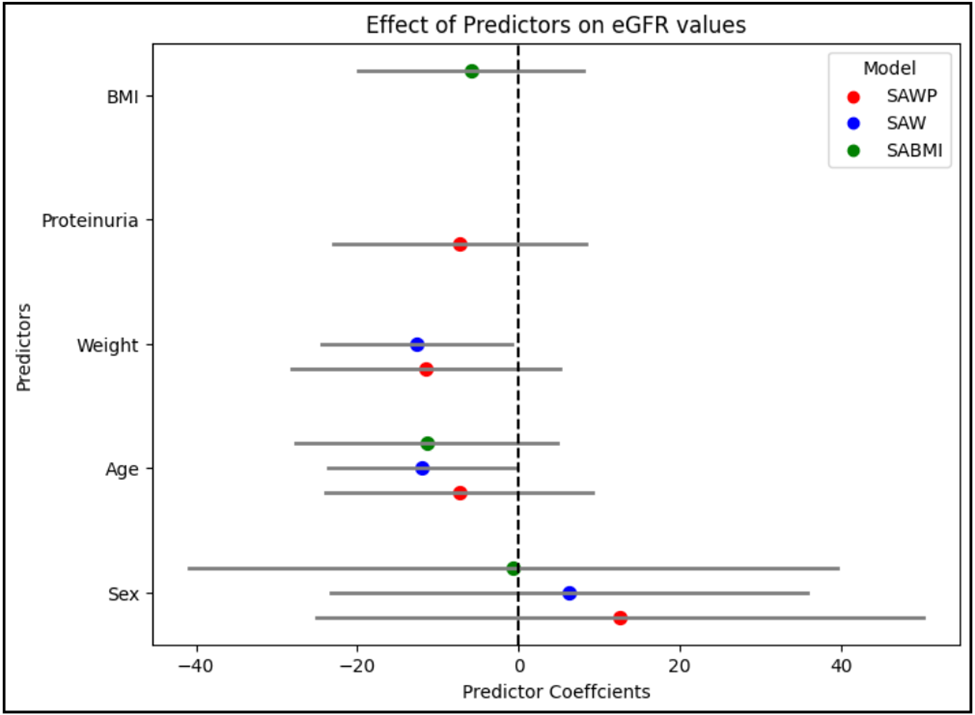
When analyzing the residual plot (Figure 2A), the points are skewed to the right, but most of them are clustered around the line of best fit, indicating some model fit. Additionally, in the forest plot (Figure 3), the confidence intervals for Proteinuria and Weight both cross the line of no effect at value 0, so they do not have a significant relationship with eGFR values .
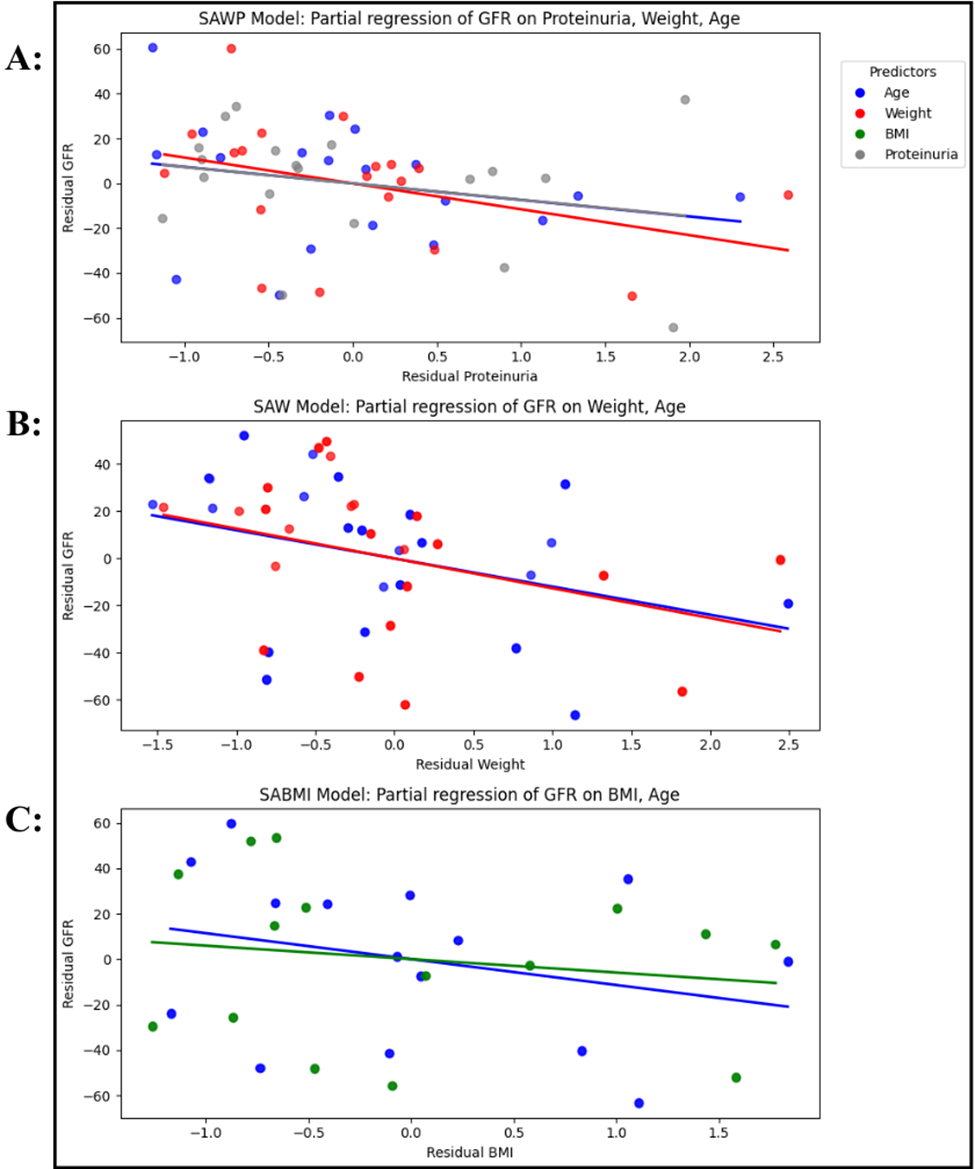
Across all models, all the predictors in the partial regression models have a negative relationship, which is to be expected as eGFR declines with the increase of each predictor. Interestingly, in the SAWP model’s partial regression (Figure 4A), the partial regression line of proteinuria on eGFR lies on top of the partial regression line for age, indicating that both Age and Proteinuria have similar negative associations with decreased eGFR.
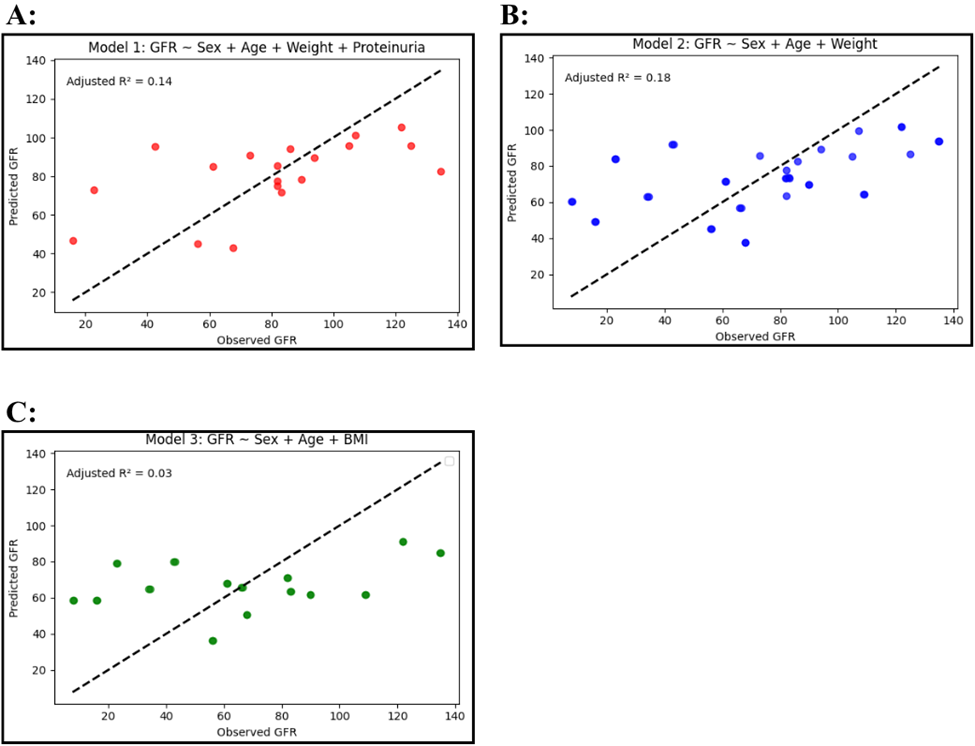
Furthermore, when plotting observed eGFR values against predicted eGFR values (Figure 5A), the SAWP model has some clustering around the 45 degree line, indicating that it can somewhat predict eGFR correctly in comparison to the actual values. The SAWP model’s adjusted R2 value of 0.141 is less than the SAW model’s adjusted R2 value (0.176) (Table 1). This is most likely caused by a limited sample size that does not allow us to test more values.
By using a model that includes Age, Sex, Weight, Proteinuria, and Age x Proteinuria, clinically plausible interaction terms were explored. The inclusion of the interaction did not improve model fit (adjusted R2: 0.141 to 0.102; AIC: 186.9 to 188.3), and the interaction term itself was not statistically significant (p=0.545). Therefore, we did not include the interaction terms in the final model.
Variance inflation factors (VIFs) were used to assess multicollinearity. All VIF values were below 5 (Sex=1.44, Age=1.29, Weight=1.30, Proteinuria=1.16) indicating no evidence of problematic multicollinearity. Additionally, to evaluate model generalization, 5-fold cross-validation was conducted. The SAWP model yielded a mean validation RMSE of 43.56±9.87, an MAE of 34.03±8.25, and a validation R2 of -3.55±4.58.
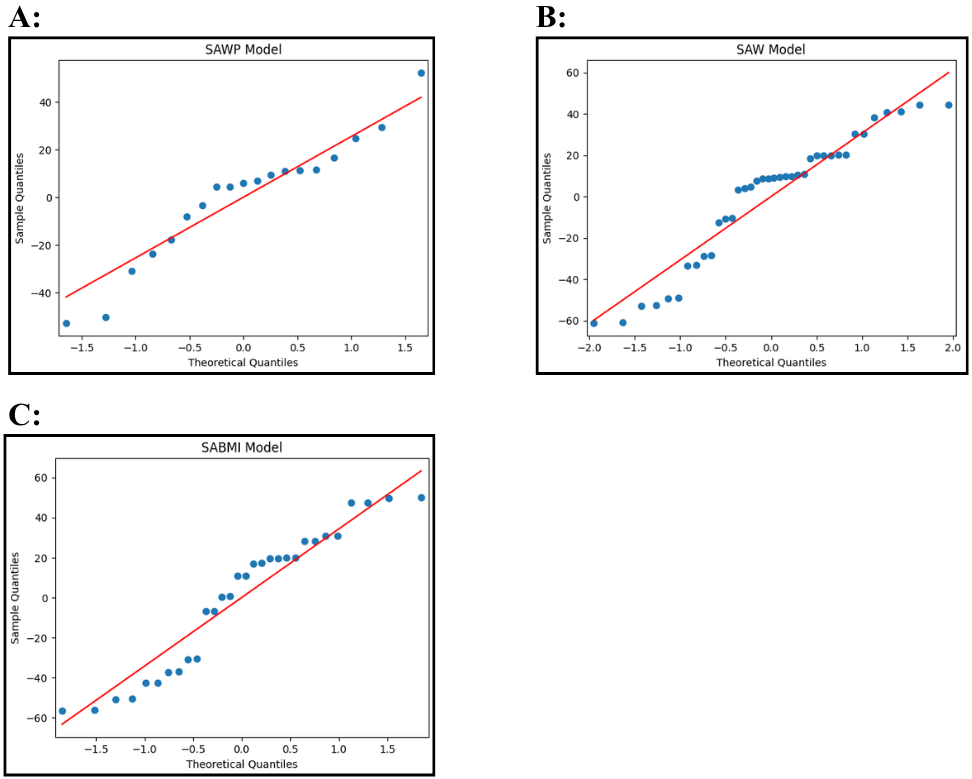
Shapiro-Wilk test was not statistically significant, indicating no evidence of departure from normality (W=0.944, p=0.317). Visual Q-Q plot supports this as it illustrates only slight deviations at the tail, suggesting minor departures from normality (Figure 6A). Breusch-Pagan test was not statistically significant (LM=7.06, p=0.133), so there was not enough evidence to say heteroscedasticity is present in the SAWP regression model (Table 3).
Model 2: SAW dataset
The SAW model used the predictors of Sex, Age, and Weight; and it contains the highest sample size of 38 patients (Table 2B). The model p-value 0.0223 indicates that, overall, this model is significantly correlated with eGFR. Specifically, Age and Weight, with p-values of 0.044 and 0.036, respectively, are shown to be the statistically significant predictors of eGFR as the model is a good fit for the data. Our model estimates that as Age increases by 1 standard deviation (scaled unit), eGFR will decrease by 11.9323 (mL/min/1.73m²). Similarly, as Weight increases by 1 standard deviation of Weight, eGFR will decrease by 12.6387 (mL/min/1.73m²) (Table 1).
In another aspect, compared to the other models’ Residuals vs Fitted values plots (Figure 2B), the SAW model is also the best fit for the data . Additionally, the forest plot (Figure 3) shows that, in the SAW model, Age and Weight are the most accurate predictors of eGFR values as the confidence intervals for each estimated coefficient do not cross the line of no effect, indicating that they have a meaningful correlation with eGFR. They were the only predictors to do so out of all the other models.
Similarly, when running a partial regression on the SAW model (Figure 4B), the Age and Weight lines are almost identical, indicating similar effects on eGFR. Finally, when plotting observed eGFR values against predicted eGFR values (Figure 5B), we observe some clustering of the data points around the 45 degree line, which represents perfect prediction. Additionally, the SAW model has the highest adjusted R2 value of all models (0.176), indicating that this model is most accurately associated with decreased eGFR and captures the most eGFR variation (Figure 5).
The interaction terms were evaluated by using the model including Age, Sex, Weight, and Age x Weight; however, the model fit was not improved (adjusted R2: 0.176 to 0.155; AIC: 376.2 to 378.0), and the interaction term itself was not significant (p=0.698). Therefore, the interaction term was not included in the final model.
All VIF values were below 5 (Sex=1.38, Age=1.17, Weight=1.20), indicating no evidence of problematic multicollinearity. Additionally, 5-fold cross-validation was conducted, and the SAW model demonstrated a mean validation RMSE of 32.69±7.09, an MAE of 27.09±6.11, and a validation R2 of -0.10±0.70.
The Shapiro-Wilk test was statistically significant, indicating evidence of departure from normality (W=0.914, p=0.007), yet the visual Q-Q plot mostly aligns with the diagonal line, demonstrating only minor departures from normality (Figure 6B). Breusch-Pagan test was not statistically significant (LM=0.668, p=0.881), so there was not enough evidence to say heteroscedasticity is present in the SAW regression model (Table 3).
Model 3: SABMI dataset
The SABMI model used the data set containing the predictors of Sex, Age, and BMI and has a sample size of 30 patients (Table 2C). The SABMI model predicts 3.1% of eGFR variation in IgAN patients (adjusted R2) which is considerably smaller than that of the other two models. The overall model p-value of 0.293 and the non-significant p-values for each individual predictor suggest that Model 3 and its predictors overall are not significantly correlated with decreased eGFR (Table 1). As in the SAWP model, the confidence intervals for the regression coefficients of each predictor in the SABMI model cross the line of no effect (Figure 3), indicating that none of Sex, Age, and BMI have a significant correlation with eGFR values in this model. When a partial regression plot was run on the SABMI model (Figure 4C), the points were scattered widely and far from the graphed line. This is again informative of a very loose association between the model’s predictors and eGFR values, indicating that the SABMI model does not predict eGFR values reliably. Finally, the observed vs predicted eGFR plot (Figure 5C) reveals similar patterns of low predictive power and weak model fit.
Interaction terms were explored in a model including Age, Sex, BMI, and Age x BMI. The Age x BMI interaction improved model fit (adjusted R2: 0.031 to 0.118; AIC: 305.2 to 303.2), yet the interaction term was not significant (0.071), so it was not included in the final model.
All VIF values were below 5 (Sex=1.36, Age=1.37, BMI=1.02), indicating no evidence of problematic multicollinearity. Additionally, 5-fold cross-validation was conducted, and the SABMI model produced a mean validation RMSE of 40.81±10.61, an MAE of 35.34±8.22, and a validation R2 of -0.43±1.04.
The Shapiro-Wilk test was statistically significant, indicating evidence of departure from normality (W=0.913, p=0.018), however the visual Q-Q plot only has minor deviations at the tail, suggesting residuals to be approximately normally distributed (Figure 6C). The Breusch-Pagan test was not statistically significant (LM=4.29, p=0.232), so there was not enough evidence to say heteroscedasticity is present in the SABMI regression model (Table 3).
Discussion
In this study, we wanted to determine which patient characteristics are most informative and correlated with decreased kidney function in IgAN patients, measured with eGFR. Age and Proteinuria are known as reliable predictors of eGFR decline because eGFR naturally declines with time, and increased proteinuria is often a common indicator of kidney disease6. Additionally, increased BMI and Weight were also anticipated to be significant factors of decreased eGFR as previous work found that patients with a higher BMI and weight were more at risk for having a decreased eGFR level7. This study found that our predicted Weight and Age in the SAW model were significantly associated with decreased eGFR outcomes and therefore kidney function in IgAN patients; however, Sex was found not to be significant in any of the models. This indicates that the regression models only partially confirmed our original prediction that components of the eGFR calculation formula would have greater predictive power of eGFR. Additionally, even though Age (p=0.044) and Weight (p=0.036) were found to be significant, the R2 value indicated the SAW model could only explain 17.6% of eGFR variation. However, the model itself was found to be significant (p=0.0223) and a low R2 value is normal and expected in clinical studies as the human body is influenced by innumerable biological variables that cannot be controlled.
For Age, it has been shown that a long-term decrease in eGFR caused by IgAN places patients most at risk of suffering from kidney failure as their kidney function decreases. In fact, a recent study showed that 50% of the patients in the IgAN cohort reached kidney failure or died during the 11 year study period6. Excessive body weight has also been implicated in decreasing chances of survival in IgAN patients as it increases risk of hypertension and therefore stress on the kidneys, so it plays a causative role in increased decline in eGFR and kidney function7. On the other hand, it was expected for Sex to be a significant predictor as IgAN is more commonly diagnosed in men than women5, however our study did not confirm this trend, and it is reflected in the high p-values across all the models. We included Proteinuria, BMI, and Weight as additional predictors to gauge their individual contributions to eGFR and IgAN, and to compare their importance with Age and Sex, which are already closely tied to how eGFR is calculated. However, Proteinuria and BMI were found not to be significantly correlated with decreased eGFR, which differs from findings in current literature as Proteinuria is a reliable indicator of kidney inflammation as seen in IgAN, and elevated BMI levels increase chances for hypertension, similar to Weight6,7. A possible explanation is that Proteinuria and BMI were assessed only once, which may not accurately reflect changes in eGFR as these values could have fluctuated throughout the studies. Additionally, a larger sample size for the SAWP and SABMI models could have helped detect a larger effect.
Limitations:
Sample Size
One large limitation of this study was the small sample size which could have reduced statistical power. For example, as there were fewer patients with reported Proteinuria information, patients with this information had to be combined into one dataset with the smallest sample size (n=19). On the other hand, the SAW model had the highest sample size of 38 patients, and had more significant results than the other two models. This study should be repeated on a larger sample size of patients to more accurately infer the true relationships between the variables and eGFR.
Cross-Validation
Although Age and Weight produced statistically significant associations with eGFR, the 5-fold cross-validation yielded a negative mean validation R2. Despite being meaningful population-level correlates, these basic clinical traits lack the standalone predictive power to accurately estimate eGFR in unseen individuals.
Batch Effects
Since this study combines patient data from three separate clinical studies, batch effects may have been introduced in the data, although we did compensate for this as we ensured that the measurements from each trial matched up with the others when running the regression. Nonetheless, it is not a complete guarantee.
eGFR Equation
This study uses eGFR values calculated with the MDRD (Modification of Diet in Renal Disease) equation, which is calculated using a race coefficient. This has been shown to compromise eGFR accuracy in African American populations, because eGFR is more often calculated incorrectly due to differences in socioeconomic status4. As of 2021, this model of calculating eGFR has been replaced with the CKD-EPI equation, which does not include the race coefficient and is now more widely used25.
Conclusion
By analyzing patient characteristics across three clinical datasets, we found that Age and Weight are significantly associated with decreased eGFR in IgA Nephropathy patients as Age is used to directly calculate eGFR, while the association with Weight may be because of clinically studied effects in IgAN patients. The SAW model demonstrated the strongest performance among the three models, which potentially could be because it had the largest sample size, and the clinical implications with Age and Weight. However, the adjusted R² (0.176) and negative mean cross-validation R² indicate limited out-of-sample predictive performance. These findings have the potential to be used as an initial screening tool by doctors and researchers to help identify at-risk patients, but more research has to be done. Future research should repeat this study on a larger sample size and with other patient characteristics such as geriatric nutritional risk index to confirm these associations and potentially discover new characteristics implicated in IgAN pathogenesis. More future work should uncover other potential phenomena and patient characteristics which may contribute to IgAN progression in order to potentially develop novel, specific treatments to better manage IgAN.
References
- J. C. Rodrigues, M. Haas, H. N. Reich. IgA nephropathy. Clinical Journal of the American Society of Nephrology.Vol. 12, pg. 677-686, 2017. [↩]
- A. Rajasekaran, B. A. Julian, D. V. Rizk. IgA Nephropathy: An interesting autoimmune kidney disease. The American Journal of the Medical Sciences. Vol. 361, pg. 176–194, 2021, https://doi.org/10.1016/j.amjms.2020.10.003. [↩]
- C. K. Cheung, S. Alexander, H. N. Reich, H. Selvaskandan, H. Zhang, J. Barratt. The pathogenesis of IgA nephropathy and implications for treatment. Nature reviews Nephrology. Vol. 21, pg. 9–23, 2025, https://doi.org/10.1038/s41581-024-00885-3. [↩] [↩] [↩]
- A. S. Levey, S. M. Titan, N. R. Powe, J. Coresh, L. A. Inker. Kidney disease, race, and GFR estimation. Clinical journal of the American Society of Nephrology : CJASN. Vol. 15, pg. 1203–1212, 2020, https://doi.org/10.2215/CJN.12791019. [↩] [↩]
- Y. Suzuki, R. C. Monteiro, R. Coppo, H. Suzuki. The phenotypic difference of IgA nephropathy and its race/gender-dependent molecular mechanisms. Kidney360. Vol. 2, pg. 1339–1348, 2021, https://doi.org/10.34067/KID.0002972021. [↩] [↩] [↩] [↩]
- D. Pitcher, F. Braddon, B. Hendry, A. Mercer, K. Osmaston, M. A. Saleem, R. Steenkamp, K. Wong, A. N. Turner, K. Wang, D. P. Gale, J. Barratt. Long-term outcomes in IgA nephropathy. Clinical journal of the American Society of Nephrology : CJASN. Vol. 18, pg. 727–738, 2023, https://doi.org/10.2215/CJN.0000000000000135. [↩] [↩] [↩] [↩] [↩] [↩] [↩]
- F. Bonnet, C. Deprele, A. Sassolas, P. Moulin, E. Alamartine, F. Berthezène, F. Berthoux. Excessive body weight as a new independent risk factor for clinical and pathological progression in primary IgA nephritis. American journal of kidney diseases : the official journal of the National Kidney Foundation. Vol. 37, pg. 720–727, 2001, https://doi.org/10.1016/s0272-6386(01)80120-7. [↩] [↩] [↩] [↩] [↩] [↩]
- C. Qian, H. Li, Y. Hou, W. Wang, M. Sun. Clinical implications of four different nutritional indexes in patients with IgA nephropathy. Frontiers in nutrition. Vol. 11, 1431910, 2024, https://doi.org/10.3389/fnut.2024.1431910. [↩]
- Y. Ariyasu, K. Torikoshi, T. Tsukamoto, T. Yasuda, Y. Yasuda, K. Matsuzaki, K. Hirano, T. Kawamura, T. Yokoo, S. Maruyama, Y. Suzuki, E. Muso. Analysis of the impact of obesity on the prognosis of IgA nephropathy according to renal function and sex. Clinical and Experimental Nephrology.Vol. 28, pg. 1155-1167, 2024, https://doi.org/10.1007/s10157-024-02519-1. [↩] [↩]
- D. Wen, Y. Tang, L. Tan, J. Tan, D. Chen, Y. Zhang, W. Qin. Sex disparities in IgA nephropathy: a retrospective study in chinese patients. International Urology and Nephrology. Vol. 53, pg. 315-323, 2021, https://doi.org/10.1007/s11255-020-02631-7. [↩]
- Y. A. Hong, J. W. Min, M. A. Ha, E. S. Koh, H. D. Kim, T. H. Ban, Y. S. Kim, Y. K. Kim, D. Kim, S. J. Shin, W. J. Choi, Y. K. Chang, S. Y. Kim, C. W. Park, Y. O. Kim, C. W. Yang, H. E. Yoon. The impact of obesity on the severity of clinicopathologic parameters in patients with IgA nephropathy. Journal of Clinical Medicine.Vol. 9, 2824, 2020, https://doi.org/10.3390/jcm9092824. [↩]
- S. Wang, A. Qin, L. Dong, J. Tan, X. Zhou, W. Qin. Association of obesity with the development of end stage renal disease in IgA nephropathy patients. Frontiers in Endocrinology. Vol. 14, 1094534, 2023, https://doi.org/10.3389/fendo.2023.1094534. [↩]
- H. Kataoka, M. Ohara, K. Shibui, M. Sato, T. Suzuki, N. Amemiya, Y. Watanabe, K. Honda, T. Mochizuki, K. Nitta. Overweight and obesity accelerate the progression of IgA nephropathy: prognostic utility of a combination of BMI and histopathological parameters. Clinical and Experimental Nephrology. Vol. 16, 706-712, 2012, https://doi.org/10.1007/s10157-012-0613-7. [↩]
- F. Berthoux, C. Mariat, N. Maillard. Overweight/obesity revisited as a predictive risk factor in primary IgA nephropathy. Nephrology Dialysis Transplantation. Vol. 28, pg. iv160-iv166, 2013, https://doi.org/10.1093/ndt/gft286. [↩]
- M. Shimamoto, I. Ohsawa, H. Suzuki, A. Hisada, S. Nagamachi, D. Honda, H. Inoshita, Y. Shimizu, S. Horikoshi, Y. Tomino. Impact of body mass index on progression of IgA nephropathy among japanese patients. Journal of Clinical Laboratory Analysis. Vol. 29, pg. 353-360, 2014, https://doi.org/10.1002/jcla.21778. [↩]
- Y. Ouyang, J. Xie, M. Yang, X. Zhang, H. Ren, W. Wang, N. Chen. Underweight is an independent risk factor for renal function deterioration in patients with IgA nephropathy. PloS one. 11(9), e0162044, 2016, https://doi.org/10.1371/journal.pone.0162044. [↩]
- M. Canney, S. J. Barbour, Y. Zheng, R. Coppo, H. Zhang, Z. Liu, K. Matsuzaki, Y. Suzuki, R. Katafuchi, H. N. Reich, D. Cattran. Quantifying duration of proteinuria remission and association with clinical outcome in IgA nephropathy. Journal of the American Society of Nephrology. Vol. 32, pg. 436-447, 2020, https://doi.org/10.1681/ASN.2020030349. [↩]
- Q. Wen, R. Rong, Q. Zhou, X. Tang, Q. Yang, W. Chen, X. Yu. Clinical, pathological characteristics and outcomes of immunoglobulin A nephropathy patients with different ages. Nephrology. Vol. 25, pg. 906-912, 2020, https://doi.org/10.1111/nep.13667. [↩]
- S. N. Cox, G. Serino, F. Sallustio, A. Blasi, M. Rossini, F. Pesce, F. P. Schena. Altered monocyte expression and expansion of non-classical monocyte subset in IgA nephropathy patients. Nephrology, dialysis, transplantation : official publication of the European Dialysis and Transplant Association – European Renal Association. Vol. 30, pg. 1122–1232, 2015, https://doi.org/10.1093/ndt/gfv017. [↩]
- W. Ju, C. S. Greene, F. Eichinger, V. Nair, J. B. Hodgin, M. Bitzer, Y. S. Lee, Q. Zhu, M. Kehata, M. Li, S. Jiang, M. P. Rastaldi, C. D. Cohen, O. G. Troyanskaya, M. Kretzler. Defining cell-type specificity at the transcriptional level in human disease. Genome research. Vol. 23, pg. 1862–1873, 2013, https://doi.org/10.1101/gr.155697.113. [↩]
- H. N. Reich, D. Tritchler, D. C. Cattran, A. M. Herzenberg, F. Eichinger, A. Boucherot, A. Henger, C. C. Berthier, V. Nair, C. D. Cohen, J. W. Scholey, M. Kretzler. A molecular signature of proteinuria in glomerulonephritis. PloS one. 5(10), e13451, 2010, https://doi.org/10.1371/journal.pone.0013451. [↩]
- F. Pedregosa, G. Varoquaux, A. Gramfort, V. Michel, B. Thirion, O. Grisel, M. Blondel, P. Prettenhofer, R. Weiss, V. Dubourg, J. Vanderplas, A. Passos, D. Cournapeau, M. Brucher, M. Perrot, É Duchesnay. Scikit-learn: machine learning in python. The Journal of Machine Learning research. Vol. 12, pg. 2825-2830, 2011. [↩]
- S. Seabold, J. Perktold. Statsmodels: econometric and statistical modeling with python. 9th Python in Science Conference. pg. 57-61, 2010. [↩]
- A. Gupta, T. S. Stead, L. Ganti. Determining a meaningful r-squared value in clinical medicine. Academic Medicine & Surgery. 2024, https://doi.org/10.62186/001c.125154. [↩]
- C. Delgado, M. Baweja, D. C. Crews, N. D. Eneanya, C. A. Gadegbeku, L. A. Inker, M. L. Mendu, W. G. Miller, M. M. Moxey-Mims, G. V. Roberts, W. L. St Peter, C. Warfield, N. R. Powe. A unifying approach for GFR estimation: recommendations of the NKF-ASN task force on reassessing the inclusion of race in diagnosing kidney disease. Journal of the American Society of Nephrology. Vol. 32, pg. 2994-3015, 2021. [↩]