Abstract
Breast cancer survival depends strongly on stage at diagnosis, yet mammographic screening remains constrained at the population level by cost, participation, and access. We examined whether embeddings from routinely acquired chest radiographs carry information about a subsequent suspicious breast imaging assessment, and whether any such information is independent of readily available clinical variables. Chest radiographs and linked breast imaging records were collected retrospectively from an academic medical center (internal cohort, 4,637 women) and a community hospital (external cohort, 6,059 women). Embeddings were extracted using a frozen chest radiograph foundation model, and an elastic-net logistic probe was fitted using a breast imaging assessment of BI-RADS ≥4A as the reference outcome. The imaging model achieved an area under the receiver operating characteristic curve of 0.593 (95% CI 0.571–0.615) internally and 0.626 (0.605–0.647) externally. Age alone did not discriminate (0.492 and 0.494), and discrimination was unchanged within five-year age bands (0.591 and 0.617). Age together with nine comorbidities achieved 0.592 (0.571–0.613) and 0.616 (0.596–0.636), statistically indistinguishable from the imaging model (DeLong p = 0.91 and 0.47), while a model combining both reached 0.629 and 0.660, exceeding the clinical baseline by +0.037 and +0.044 (both p < 0.001). Model output was strongly associated with all-cause mortality (adjusted hazard ratio 3.05, 95% CI 2.13–4.36 internally; 2.52, 1.83–3.47 externally), but discrimination for the imaging outcome did not depend on that axis: residualising the imaging score against a mortality score reduced AUC only from 0.593 to 0.587 and from 0.626 to 0.617. Decision curve analysis showed net benefit above default strategies over threshold probabilities bracketing prevalence. Chest radiograph embeddings therefore carry information about the subsequent breast imaging pathway that is matched by a simple comorbidity baseline, yet is not reducible to a general mortality signal. The independent contribution is small, its anatomical origin is unestablished, and these findings do not support use as a pre-screening tool.
Keywords: Breast imaging; BI-RADS; Chest radiography; Deep learning; Confounding; Opportunistic imaging
Introduction
Breast cancer is among the most common malignancies affecting women worldwide, and survival is strongly associated with stage at diagnosis1. Early detection therefore remains central to reducing mortality. Population screening currently relies primarily on mammography, which is recommended on the basis of randomized and observational evidence of mortality benefit2,3,4. That benefit is nonetheless accompanied by well-documented trade-offs, including false-positive recall and overdiagnosis3. Participation is further limited by the examination itself: breast compression causes pain and discomfort that measurably reduces willingness to attend repeat screening5, and knowledge, cultural, and logistic barriers depress uptake even where programs are established6. Equipment cost and limited accessibility further restrict availability in resource-limited settings and for some populations within well-funded systems7. Cost-effectiveness of organized programs varies considerably with participation and program design8, and screening guidelines concentrate resources on defined age bands and higher-risk groups9,10, so that individuals outside those bands typically enter breast imaging only after clinical suspicion arises. Deep learning models applied to the mammogram itself can improve risk prediction and screen reading11,12,13,14,15, but they depend on a mammogram having been obtained.
Chest radiography is the most commonly performed diagnostic imaging examination in medicine16, and its use continues alongside the growth of cross-sectional and molecular imaging17. Chest radiographs are not obtained for breast assessment and do not contain the projections or contrast resolution required for breast-specific interpretation. Whether they nonetheless encode information statistically associated with breast disease has not been established.
A growing body of work has shown that deep learning models can extract prognostic information from routine images that is not apparent on visual inspection. Retinal photographs encode cardiovascular risk factors18, and electrocardiograms encode ventricular dysfunction19. Within chest radiography specifically, CXR-risk predicts twelve-year all-cause mortality from a single radiograph independently of radiologist findings and standard risk factors16, CXR-Lung-Risk estimates lung-disease mortality20, CXR-CV-Risk estimates cardiovascular risk21, related models identify high-risk smokers for lung cancer screening22, and chest radiograph models have been applied to acute triage23. The same principle has been demonstrated outside oncology, in opportunistic osteoporosis screening from chest radiographs with external validation24, and within breast assessment, in opportunistic breast density estimation from low-dose chest computed tomography25. These studies establish that a chest radiograph carries a broad and powerful signal of general health status and longevity. This is directly relevant to the present work, because any model trained on a chest radiograph to predict a downstream clinical event may recover that general signal rather than anything specific to the target disease.
Self-supervised vision-language pretraining has made such representations widely accessible. Contrastive image-text pretraining26 has been adapted to chest radiography in models including CheXzero27, MedCLIP28, and BiomedCLIP29, each trained on large radiograph-report corpora30,31. Linear probing of these embeddings permits classifier development from comparatively small labeled datasets32, which is the approach adopted here.
A well-described failure mode of chest radiograph models must be considered alongside these capabilities. Models readily exploit shortcuts, including site-specific acquisition characteristics, burned-in markers, and patient attributes recoverable from the image, and such models can appear accurate while generalizing poorly33,34,35. Chest radiograph models can recover patient race36, and hidden stratification and subgroup performance gaps are common37,38. Any claim that a chest radiograph model has learned disease-specific information therefore requires explicit evidence that it has not simply learned a proxy for general health, body habitus, or acquisition setting.
In this study we asked whether embeddings from a chest radiograph foundation model can discriminate patients who receive a subsequent suspicious breast imaging assessment from those who do not, within a population in which breast imaging was performed. We evaluated this discrimination against clinical baseline models built from age and comorbidity, examined whether it persists after accounting for the model’s association with mortality, and interpret the results in the light of the opportunistic risk-prediction literature described above.
Methods
Study Design and Data Collection
This retrospective study used chest radiographs and linked breast imaging records from two institutions. The internal dataset comprised 15,451 women who attended the Neihu site of Tri-Service General Hospital, an academic medical center, between January 2011 and February 2022 with at least one chest radiograph and at least one breast imaging report. The external validation dataset comprised 6,059 women who attended Tingzhou Branch Hospital, a geographically distinct community hospital, over the same period and under the same criteria.
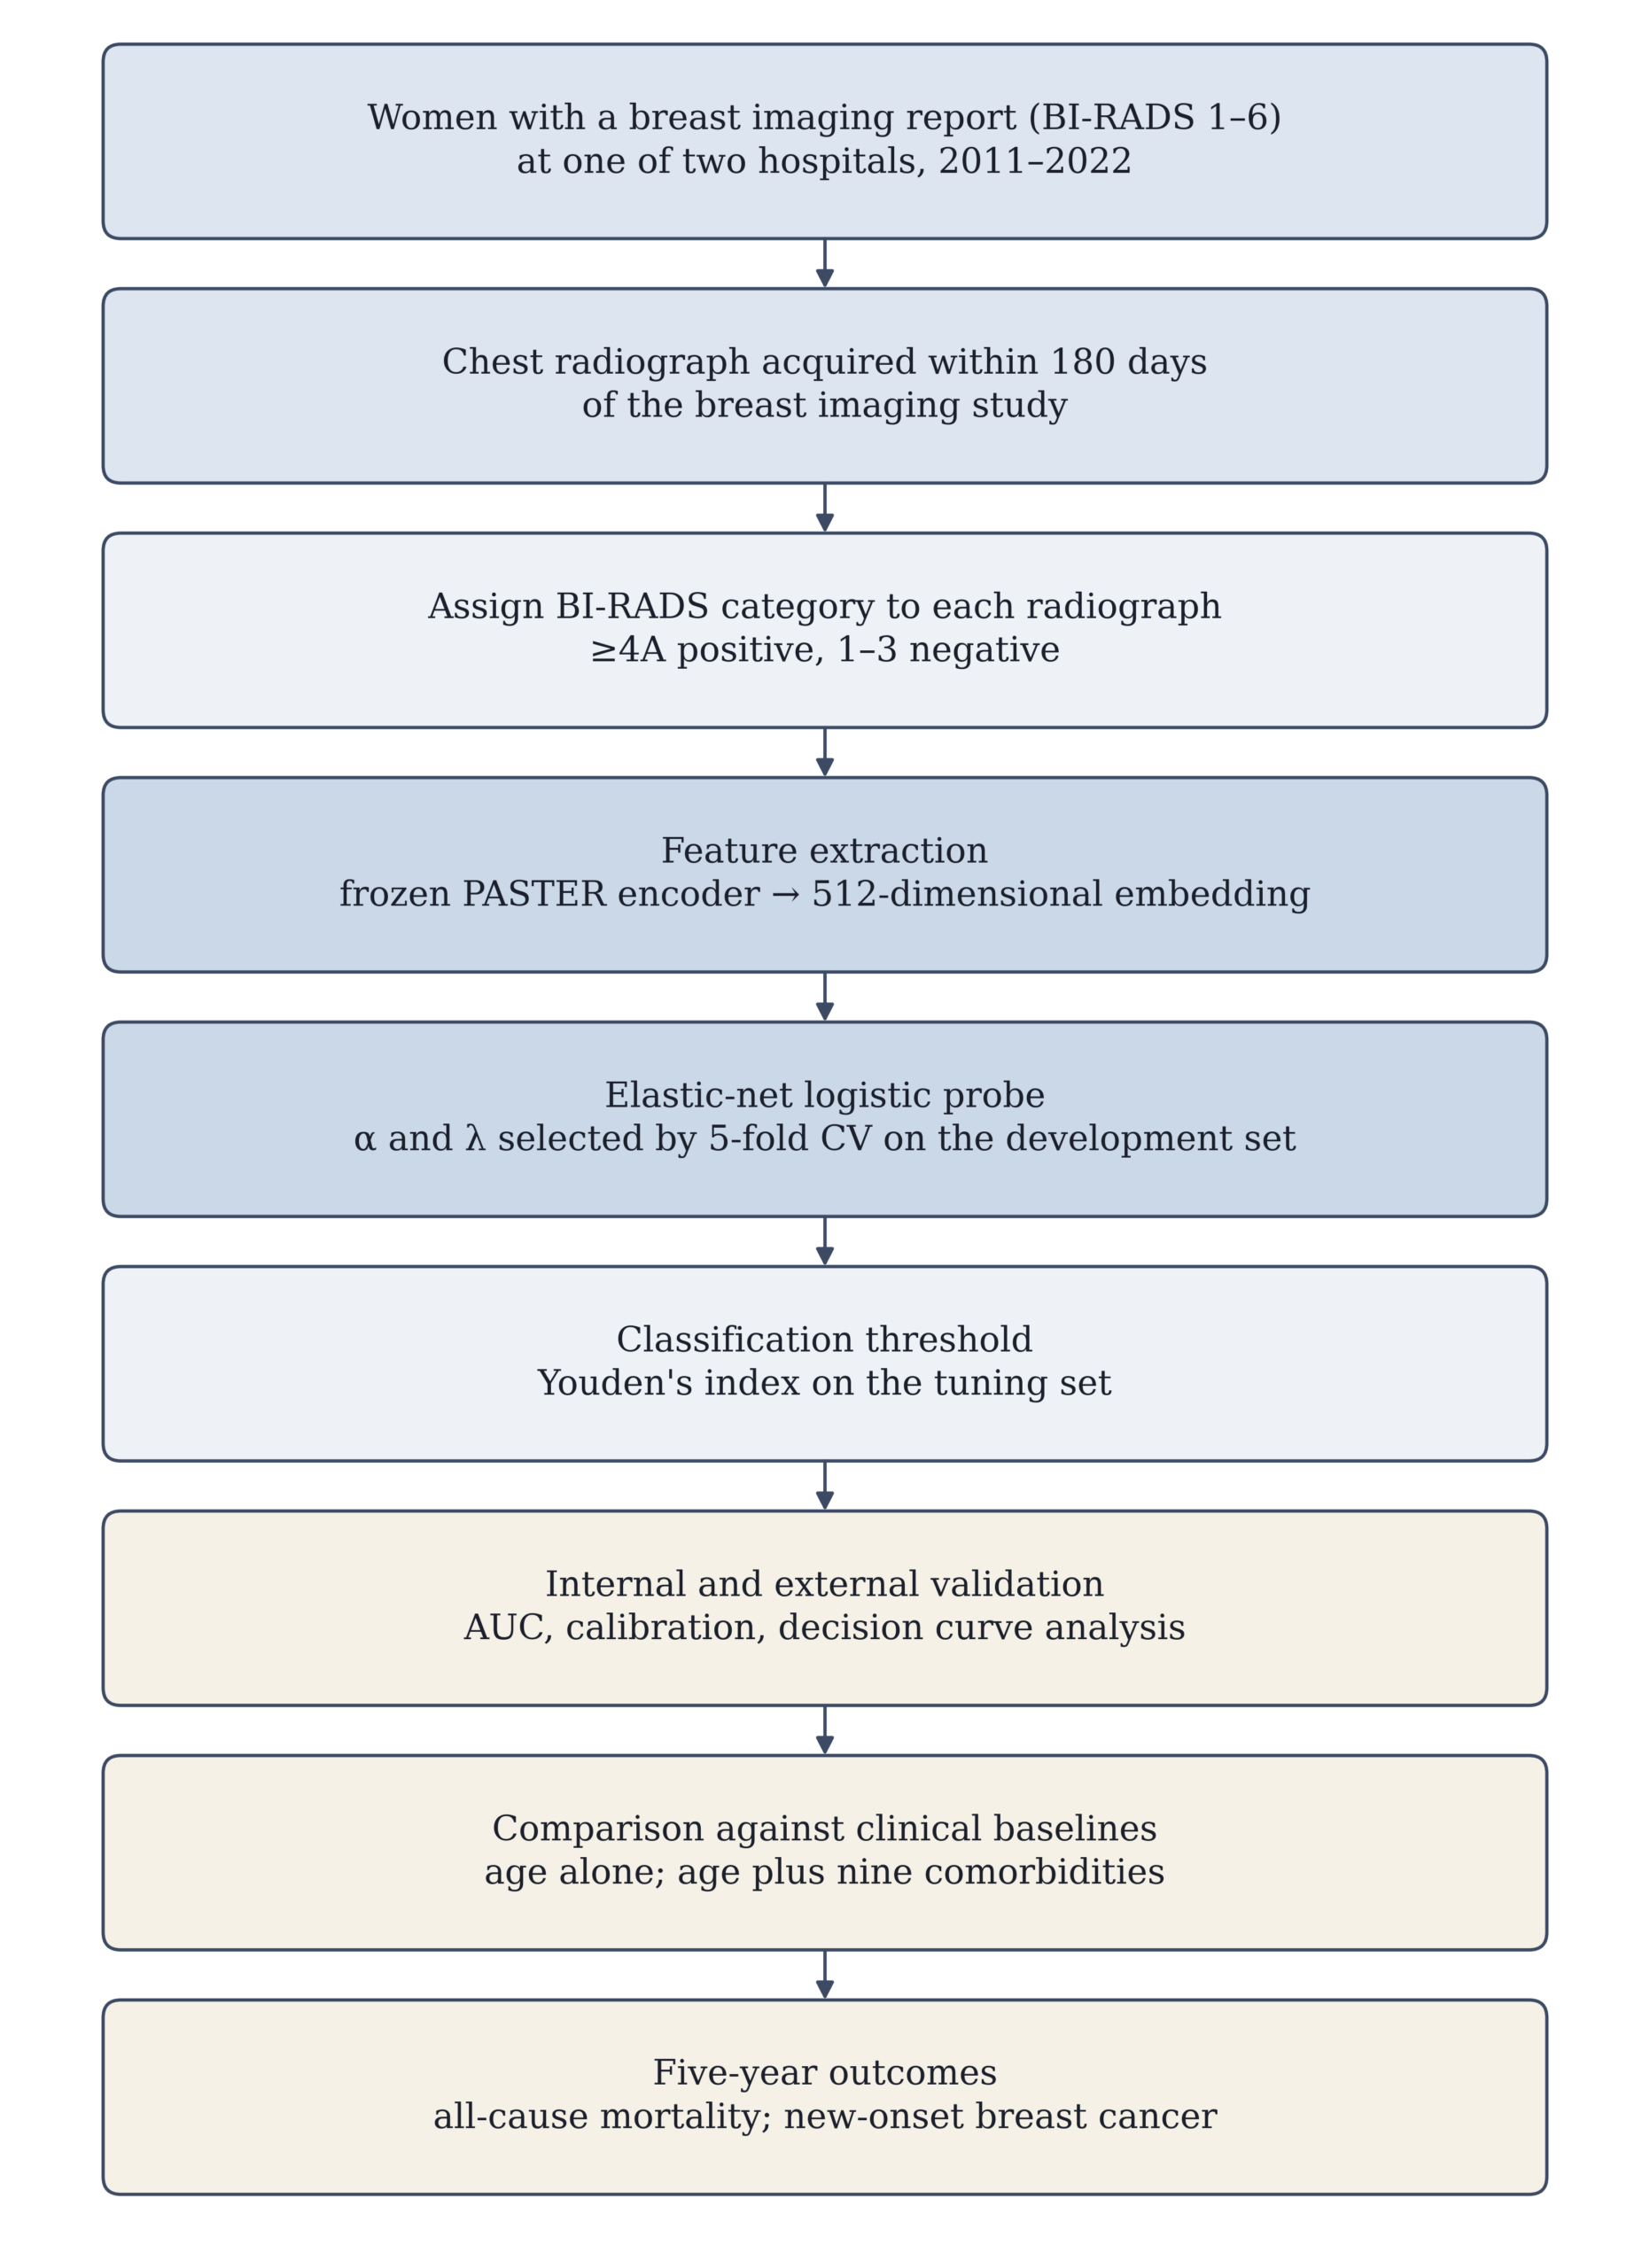
Analysis was restricted to women. Cohort assembly began from breast imaging records: patients with a BI-RADS report were identified first, and their medical record numbers were used to retrieve chest radiographs acquired within 180 days of that report. For each radiograph the nearest breast imaging assessment in absolute time was assigned, in either temporal direction.Because this window is bidirectional, a substantial minority of radiographs were acquired after rather than before the breast study: 42.8% of the internal cohort and 41.7% of the external cohort. Radiographs postdating the breast assessment may capture post-diagnostic or post-treatment change rather than antecedent risk, so results are reported separately by temporal direction.Where a patient contributed more than one eligible radiograph, one was retained at random for the tuning and validation sets, so that patients undergoing repeated imaging could not exert disproportionate influence. Because each radiograph is matched to its own nearest breast assessment, the assigned BI-RADS category is not constant within a patient: 6,569 of 21,510 patients had more than one distinct assigned category across their radiographs. Reported metrics therefore vary with the random draw, and results are presented across ten draws. All reported values use the pre-3.6.0 R sampling convention (RNGkind(sample.kind = ‘Rounding’)) under which the analysis was originally performed; this is stated because the default changed in R 3.6.0 and the two conventions give different patient draws. The overall study workflow is summarized in Figure 1 and the cohort derivation in Figure 2.
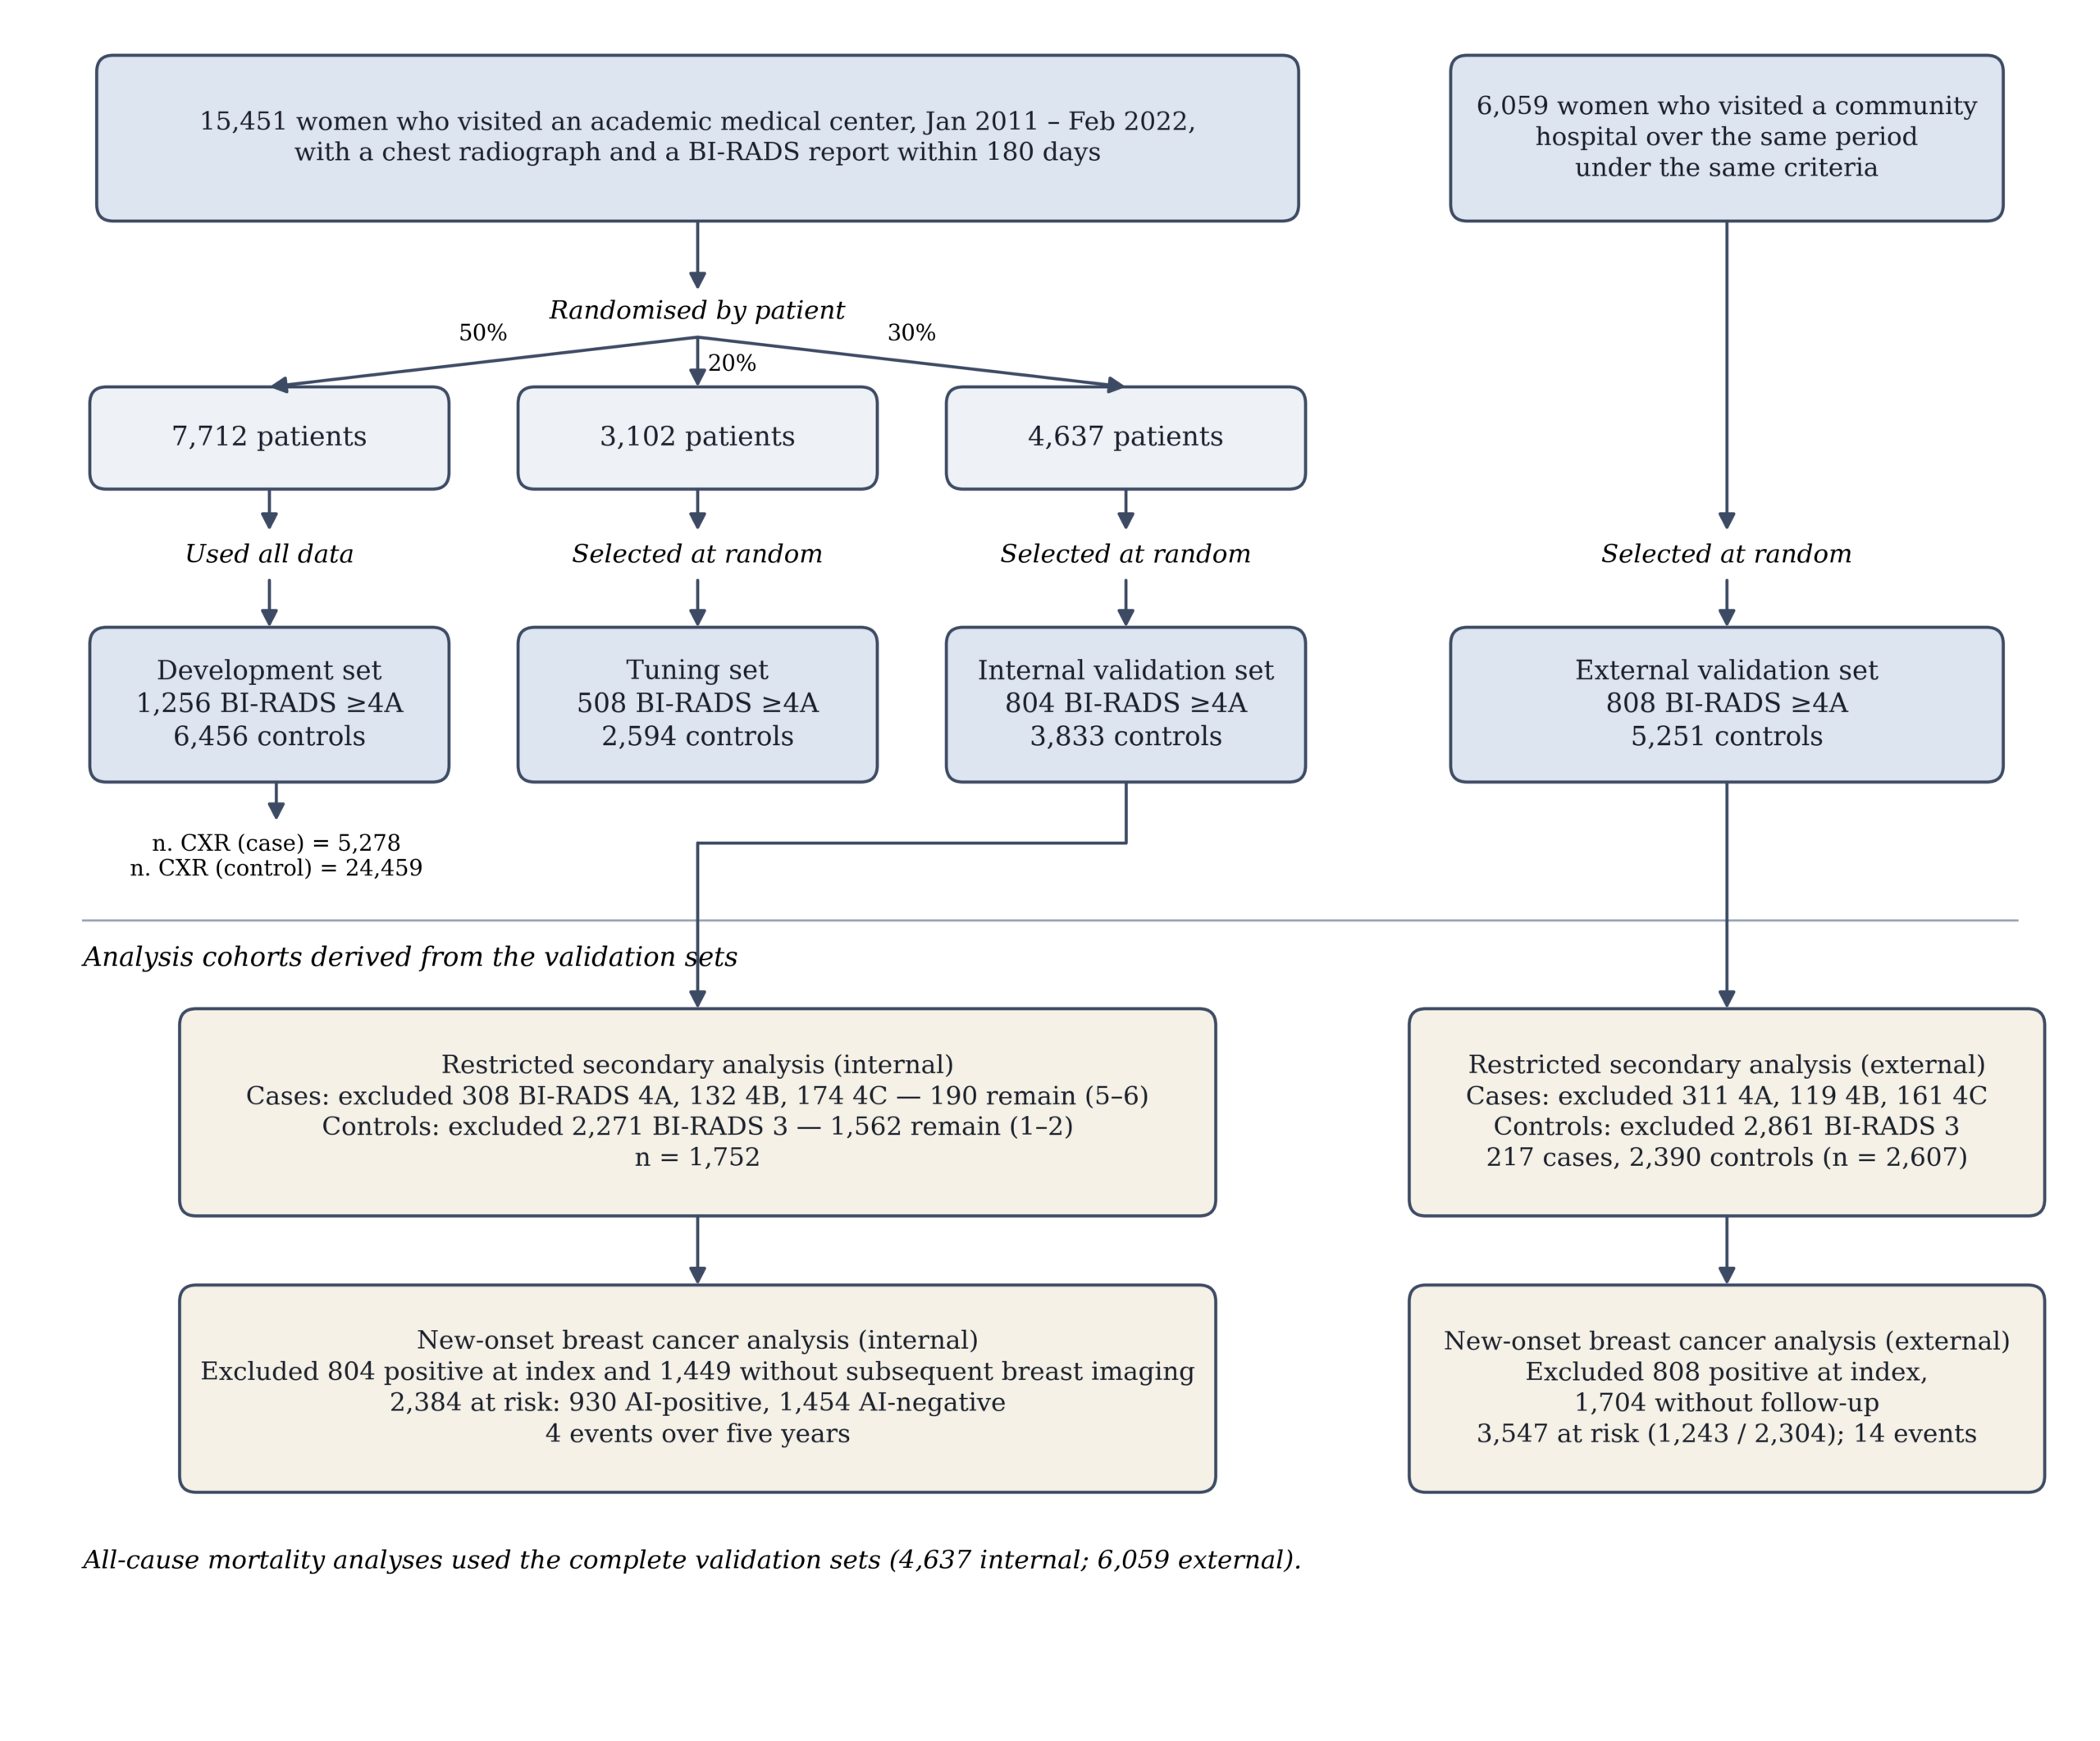
The internal cohort was partitioned by patient into a development set (7,712 patients; 50%), a tuning set (3,102 patients; 20%), and an internal validation set (4,637 patients; 30%). All images from a given patient were assigned to exactly one partition, and no patient identifier appears in more than one partition. No patient appears in both the internal and external cohorts; the two sites are separate hospitals within one health system sharing a single medical record numbering scheme, so cross-site duplication was excluded by identifier comparison39. The development set contributed 5,278 case images and 24,459 control images. Validation sets were constructed at the patient level, with one image per patient, to avoid dependence between observations.
Clinical indication for the chest radiograph and radiographic projection were not available in the de-identified extract used for this analysis. The possibility that some radiographs were obtained in a context already related to breast disease therefore cannot be excluded, and is addressed in the Discussion.
Outcome Definition
The reference outcome was a breast imaging assessment of BI-RADS ≥4A on the index breast study40. Assessments of BI-RADS 1, 2, and 3 were classified as negative, and assessments of 4A, 4B, 4C, 5, and 6 were classified as positive. BI-RADS is a management category expressing the level of radiological suspicion, not a pathological diagnosis. Under the fifth-edition definitions, category 4A denotes a low likelihood of malignancy (greater than 2% and up to 10%), so the majority of 4A assessments are benign on biopsy41. Category 6 denotes malignancy already proven by biopsy before the imaging study. The outcome is therefore described throughout this manuscript as a suspicious breast imaging assessment rather than as breast cancer, and the model is described as predicting that assessment rather than predicting cancer, risk, or screening outcome.
The distribution of positive cases across BI-RADS 4A, 4B, 4C, 5, and 6, together with breast imaging modality, examination indication, availability of pathological confirmation, invasive versus in situ disease among confirmed cases, and benign biopsy results, is reported in Table 2. Studies assessed as BI-RADS 0, denoting an incomplete assessment requiring additional imaging, were excluded. Studies assessed as BI-RADS 3 were classified as negative for the primary outcome and excluded from the secondary analysis. A secondary outcome restricted the positive class to BI-RADS 5 and 6 and the negative class to BI-RADS 1 and 2. Categories 3, 4A, 4B, and 4C were set to missing and excluded from that analysis entirely, on the basis that the intermediate categories carry the least reliable labels. This restriction removes patients from both classes and is not a measure of early-stage detection; the resulting cohort comprises 1,752 internal and 2,607 external patients rather than the full validation sets.Because BI-RADS 6 denotes malignancy proven by biopsy before the index radiograph, and because category 6 constitutes 44% of the internal and 45% of the external positive class in this secondary analysis, performance in that setting partly reflects disease already diagnosed and under treatment. A sensitivity analysis excluding category 6 is reported.
| Category | Internal, n (%) | External, n (%) | Enters secondary analysis |
| BI-RADS 4A | 308 (38.3) | 311 (38.5) | No — excluded |
| BI-RADS 4B | 132 (16.4) | 119 (14.7) | No — excluded |
| BI-RADS 4C | 174 (21.6) | 161 (19.9) | No — excluded |
| BI-RADS 5 | 106 (13.2) | 119 (14.7) | Yes — positive |
| BI-RADS 6 | 84 (10.4) | 98 (12.1) | Yes — positive |
| Total positive (BI-RADS ≥4A) | 804 (100) | 808 (100) | — |
Image Preprocessing
Source radiographs were stored in DICOM format at approximately 2,000 to 3,000 pixels in the long axis. Images were converted directly to 8-bit grayscale PNG and resized to 224 × 224 pixels, the input resolution of the encoder. No windowing, VOI LUT application, photometric inversion, cropping, or intensity normalization was applied, and no vendor-specific post-processing was reversed. Because no preprocessing statistics were estimated from any dataset, preprocessing leakage between partitions is excluded by construction. Both posteroanterior and anteroposterior projections were included. No manual annotation, region selection, or lesion labeling was performed.
Because burned-in text and laterality markers are an established shortcut for chest radiograph models34, a sensitivity analysis was performed in which peripheral image regions containing such annotations were masked before feature extraction, and performance was recomputed.
Feature Extraction
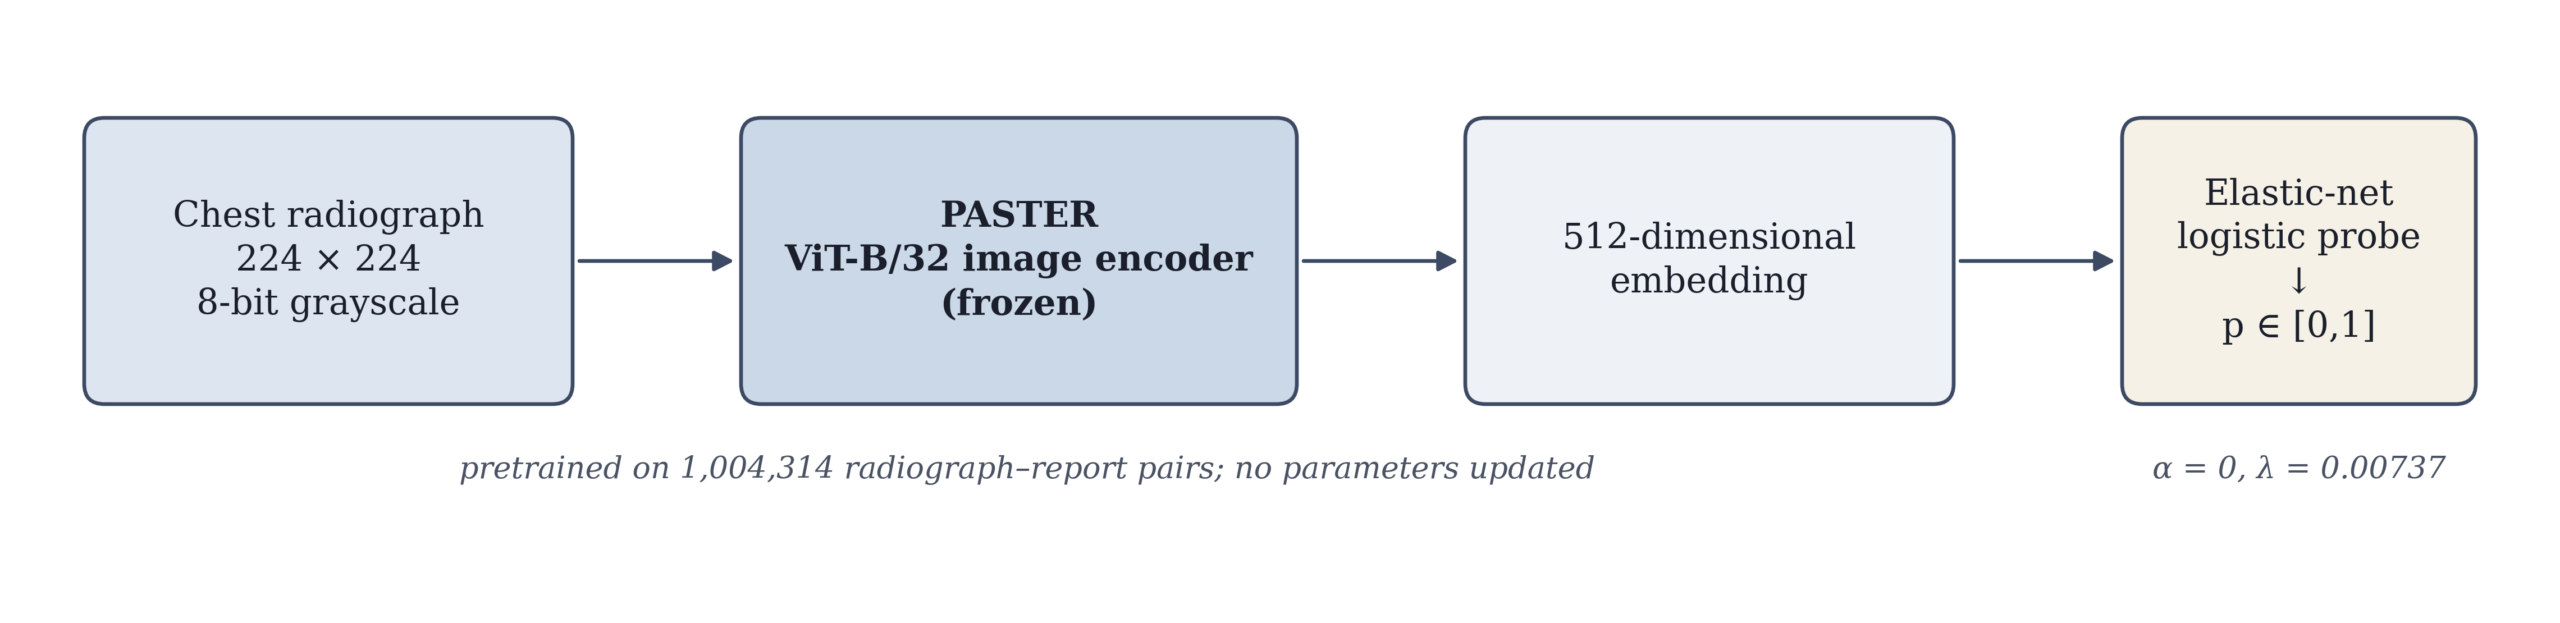
Features were extracted using PASTER (Pretraining Approach for Small-sample Training Employing Radiographs), a contrastively pretrained multimodal transformer42. The image encoder is a ViT-B/32 vision transformer and the text encoder a 12-layer transformer; both project into a shared 512-dimensional embedding space. Pretraining used 1,004,314 chest radiograph and free-text report pairs with a softmax-normalized contrastive objective and temperature scaling, for 50 epochs, with the checkpoint at lowest validation loss on a held-out 10% subset selected as final42. Each radiograph in the present study was encoded into a 512-dimensional embedding, and all encoder parameters remained frozen; no fine-tuning was performed. Only one version of PASTER exists and its weights are not publicly distributed under licensing constraints; access may be requested under a data use and collaboration agreement.
The PASTER pretraining corpus was drawn from the same academic medical center as the present internal cohort, over an overlapping period. Patient-level partitioning is however consistent between pretraining and all downstream tasks: a patient assigned to the development partition during pretraining remains in the development partition downstream, and correspondingly for the held-out partitions39. Radiographs from the internal validation and external validation sets used here were therefore not seen during pretraining, and representation leakage into the reported results is excluded. Development and tuning set images were included in the pretraining corpus, which is standard for linear probing on a frozen encoder and does not affect out-of-sample evaluation.
Model Training and Selection
A linear probing approach was used. An elastic-net-regularized logistic regression was fitted on the 512-dimensional frozen embeddings to predict the reference outcome:
p = σ( Σⱼ₌₁⁵¹² wⱼ xⱼ + b )
where xⱼ is the j-th element of the embedding x, wⱼ the corresponding coefficient, b the intercept, and σ the logistic function. The objective combines the binomial deviance with an elastic net penalty43:
L = deviance + λ [ α Σⱼ |wⱼ| + (1 − α)/2 · Σⱼ wⱼ² ]
The mixing parameter α and the regularization strength λ were selected by five-fold cross-validation within the development set, maximizing cross-validated AUC43. The intercept is not penalized under this parameterization. The selected values were α = 0.0, corresponding to a pure ridge penalty, and λ = 0.00737, with a cross-validated AUC of 0.693. Discrimination was insensitive to α: cross-validated AUC ranged only from 0.6917 to 0.6928 across the full grid from 0 to 1, and all 512 coefficients were retained at the selected value, indicating that the predictive signal is distributed diffusely across the embedding rather than concentrated in a small number of dimensions. The fitted intercept was −0.5026. The resulting coefficient vector was applied without modification to the tuning set; no refitting or recalibration was performed on any validation dataset.
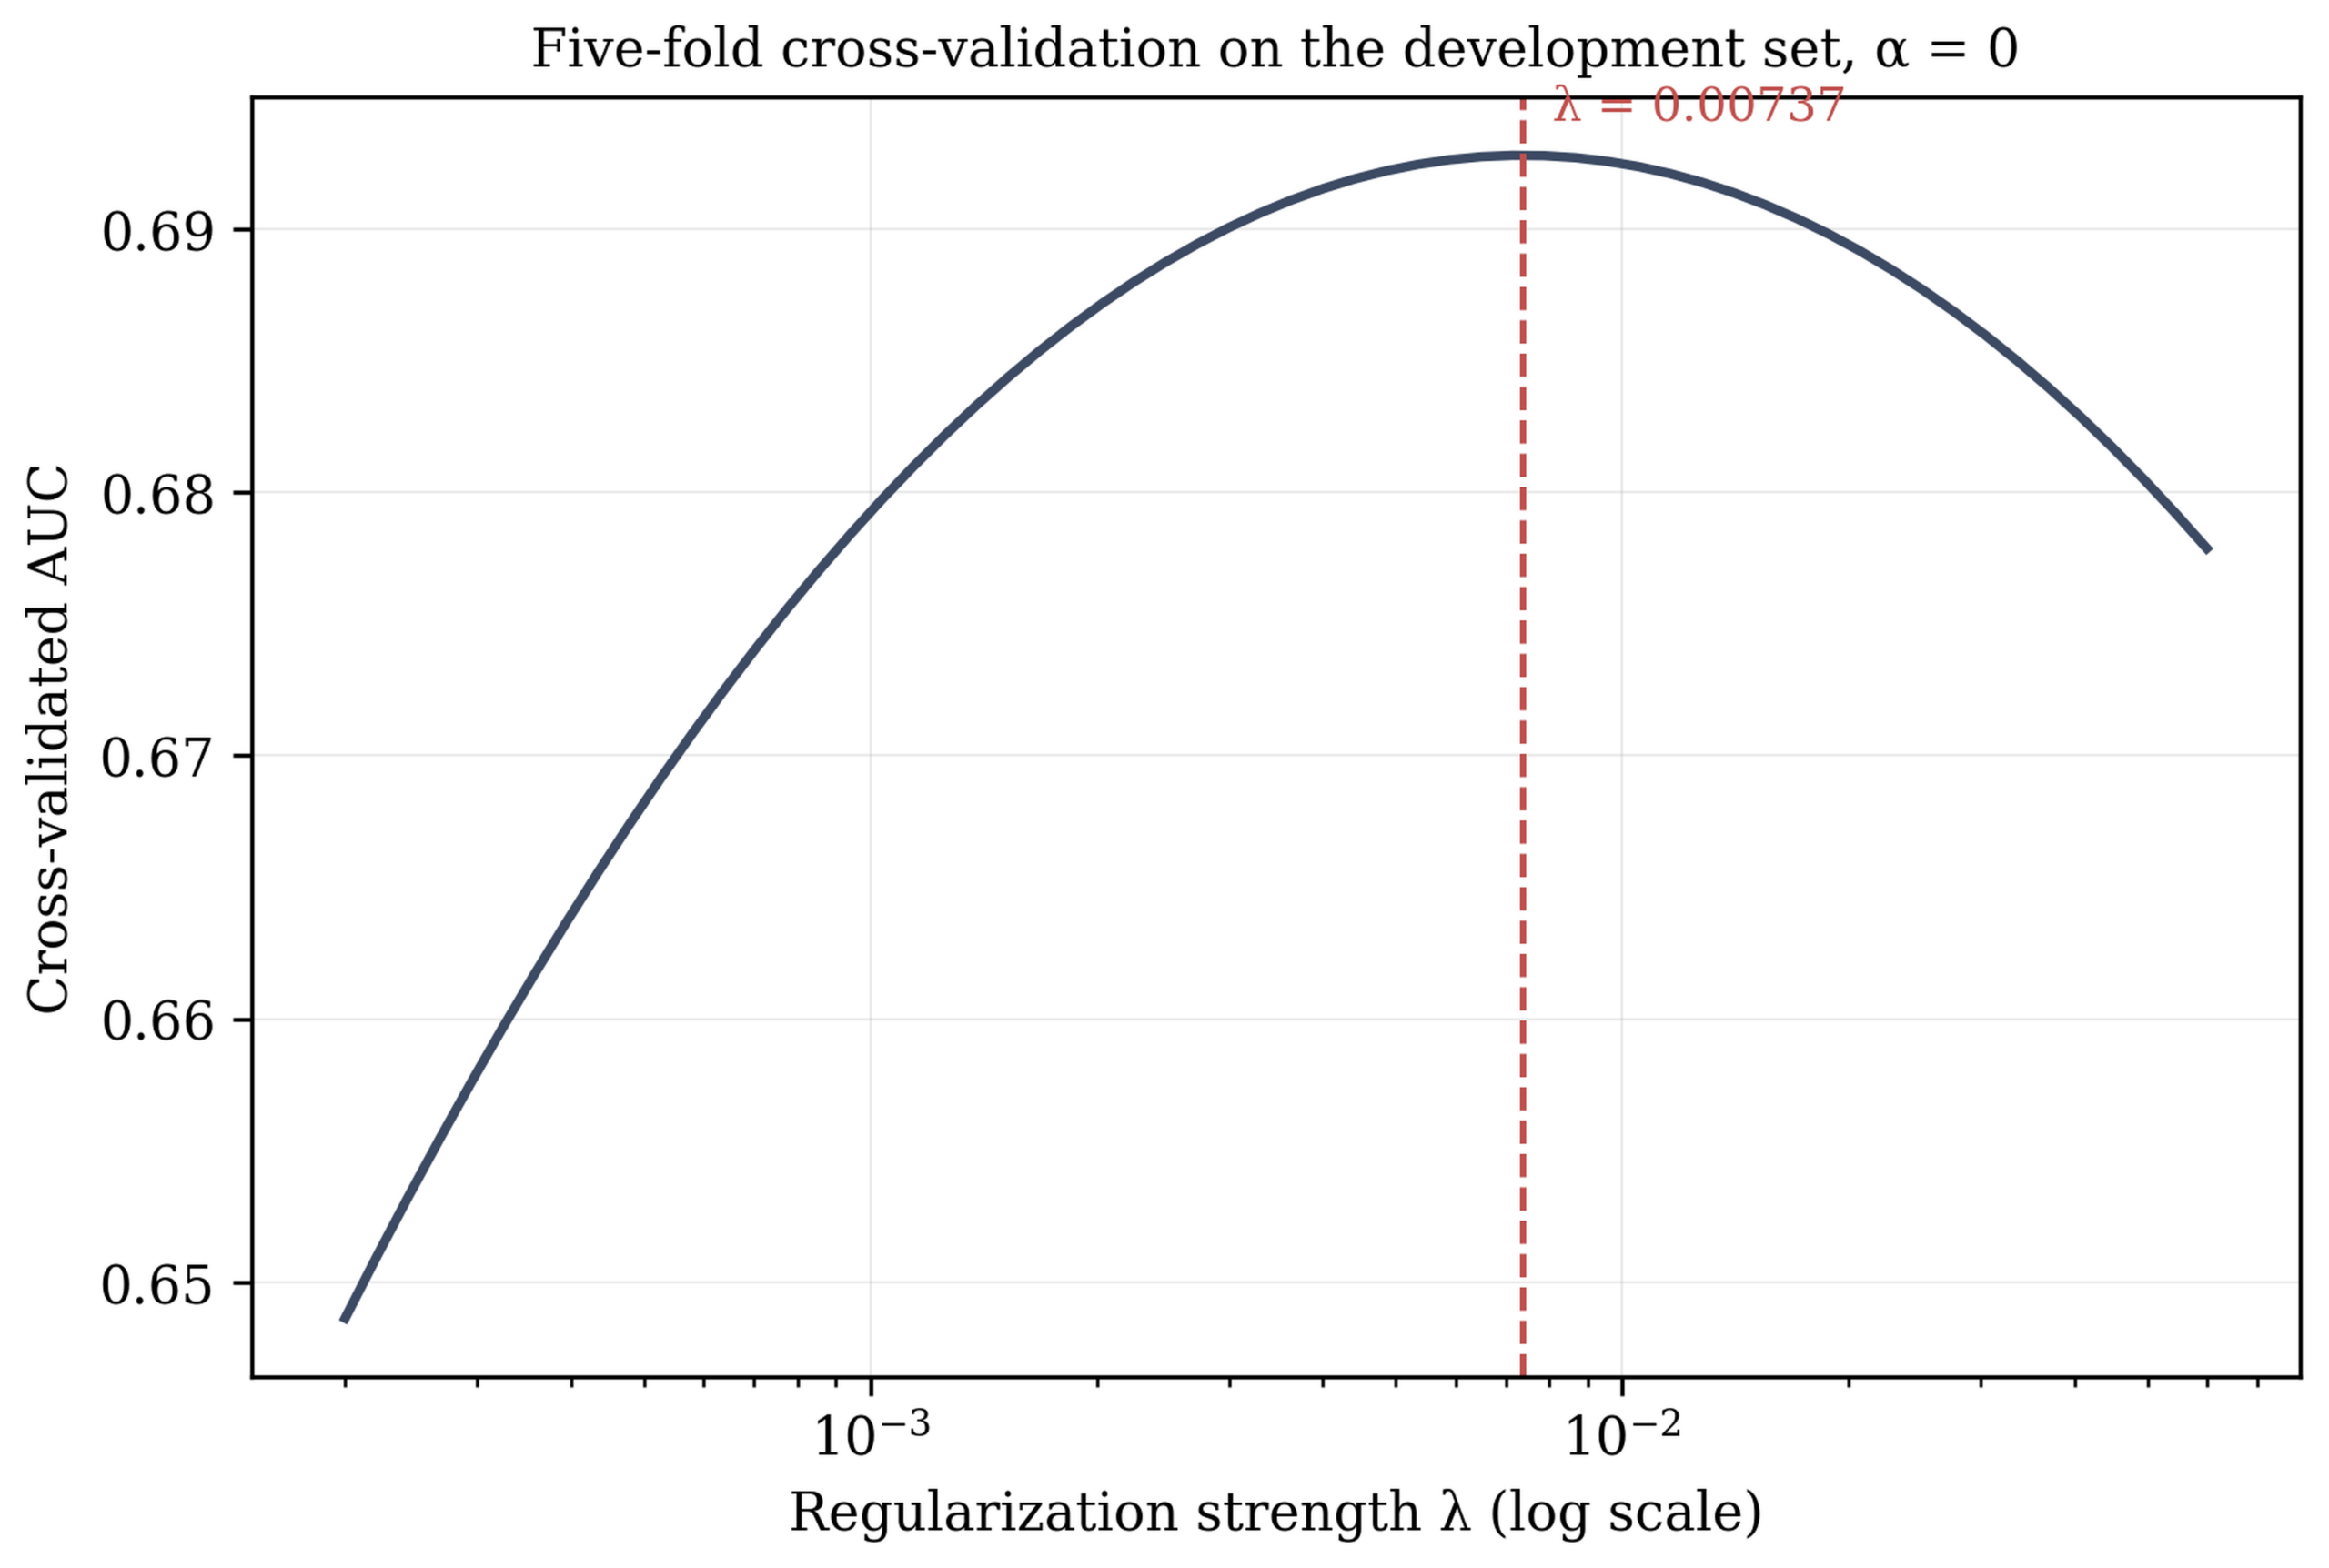
| Parameter | Value |
| Encoder | PASTER, ViT-B/32 image branch |
| Pretraining corpus | 1,004,314 CXR–report pairs |
| Encoder state | Frozen; no fine-tuning |
| Input resolution | 224 × 224, 8-bit grayscale |
| Preprocessing | Direct DICOM→PNG resize; no normalization |
| Embedding dimension | 512 |
| Probe | Elastic-net logistic regression |
| α (mixing parameter) | 0.0 (pure ridge) |
| λ (penalty strength) | 0.00737 |
| Selection of α and λ | 5-fold CV on development set, max AUC (0.693) |
| Intercept penalized | Not penalized; fitted value −0.5026 |
| Classification threshold | 0.181 (Youden’s index, tuning set) |
| Single-radiograph draw | set.seed(0), sample.kind = Rounding |
| Non-zero coefficients | 512 of 512 |
The probe that generated the predictions reported here was fitted during the original analysis, and the inference-stage embeddings for the internal and external validation cohorts were not recoverable for this revision. Reported discrimination therefore derives from the original model output. To establish that the specification above reproduces that model, the probe was refitted from the development-set embeddings and evaluated on the tuning set, where embeddings were available for 11,901 of 12,188 images. The refitted probe achieved an AUC of 0.656 (95% CI 0.643–0.669) against 0.648 for the original model on the same images, a difference of 0.008, indicating close agreement between the refitted specification and the model underlying the reported results.
The three internal partitions had distinct and non-overlapping roles. The development set was used to fit the probe and to select α and λ by cross-validation. The tuning set was used to select the classification threshold. The internal validation set was withheld from every selection decision and reserved for final analysis, as was the external validation set.
The classification threshold was selected by maximizing Youden’s index on the tuning set, giving a cut-point of 0.181. Predictions at or above this value are designated AI-positive and those below it AI-negative. The same cut-point was applied unchanged to the secondary outcome and to both validation cohorts, so the operating point is not optimized for any reported analysis.
Training used all available radiographs, whereas the tuning and validation sets used a single randomly selected radiograph per patient, so that patients undergoing repeated imaging — who are systematically sicker — could not exert disproportionate influence on the reported metrics. The same protection does not apply during fitting: the development set contains 29,737 images from 7,712 patients, a mean of 3.9 per patient, and no patient-level weighting was applied. The distribution of images per patient in the positive and negative development groups is reported in Table 1, and this asymmetry is considered in the Discussion.
| Characteristic | Development | Tuning | Internal val. | External val. |
| Patients, n | 7,712 | 3,102 | 4,637 | 6,059 |
| BI-RADS ≥4A, n (%) | 1,256 (16.3) | 508 (16.4) | 804 (17.3) | 808 (13.3) |
| Age, mean (SD) | 53.5 (13.1) | 53.5 (13.4) | 53.5 (13.0) | 56.0 (13.1) |
| Female, n (%) | 7,712 (100) | 3,102 (100) | 4,637 (100) | 6,059 (100) |
| Diabetes mellitus, n (%) | 909 (11.8) | 385 (12.4) | 532 (11.5) | 1,080 (17.8) |
| Hypertension, n (%) | 223 (2.9) | 86 (2.8) | 129 (2.8) | 244 (4.0) |
| Hyperlipidemia, n (%) | 2,109 (27.3) | 824 (26.6) | 1,216 (26.2) | 2,477 (40.9) |
| Chronic kidney disease, n (%) | 301 (3.9) | 129 (4.2) | 192 (4.1) | 319 (5.3) |
| Coronary artery disease, n (%) | 768 (10.0) | 312 (10.1) | 391 (8.4) | 861 (14.2) |
| COPD, n (%) | 910 (11.8) | 338 (10.9) | 532 (11.5) | 1,259 (20.8) |
| Heart failure, n (%) | 134 (1.7) | 60 (1.9) | 78 (1.7) | 205 (3.4) |
| Atrial fibrillation, n (%) | 68 (0.9) | 21 (0.7) | 38 (0.8) | 85 (1.4) |
| Stroke, n (%) | 405 (5.3) | 139 (4.5) | 221 (4.8) | 466 (7.7) |
| Care setting (ED/IPD/OPD), % | 12.8 / 28.3 / 59.0 | 13.4 / 28.0 / 58.6 | 12.7 / 27.4 / 60.0 | 10.6 / 24.1 / 65.2 |
| Projection (PA/AP), % | Not recorded | Not recorded | Not recorded | Not recorded |
| CXR indication, top categories | Not recorded | Not recorded | Not recorded | Not recorded |
| Images per patient, mean | 3.9 | 1.0 | 1.0 | 1.0 |
Baseline Models
Two clinical baseline models were fitted on the development set and evaluated, without refitting, on the internal and external validation sets. The first was a logistic regression using age alone. The second used age together with the nine comorbidities available in the dataset: diabetes mellitus, hypertension, hyperlipidemia, chronic kidney disease, stroke, coronary artery disease, atrial fibrillation, heart failure, and chronic obstructive pulmonary disease. Because the shared prediction file does not store model output for the development set, the combined model was fitted on the tuning set; both clinical baselines were fitted on the development set. All three were evaluated without refitting on the internal and external validation sets. A third model combined the imaging embeddings with these clinical variables. AUCs were compared using the DeLong test for correlated receiver operating characteristic curves44, and the incremental discrimination of the imaging embeddings over the clinical baselines is reported with a confidence interval.
Performance Evaluation
Discrimination was assessed by receiver operating characteristic analysis with AUC reported alongside 95% confidence intervals for every reported value. Calibration was assessed using a calibration plot with the Brier score45. Sensitivity, specificity, positive and negative predictive value, and positive and negative likelihood ratios are reported at the locked threshold. Clinical utility was assessed by decision curve analysis across a range of threshold probabilities46, together with the number needed to image at the operating point.
Secondary Analysis Restricted to High-Suspicion Assessments
A secondary analysis was performed after restricting the positive class to assessments of BI-RADS 5 and 6, excluding categories 4A, 4B, and 4C, and restricting the negative class to categories 1 and 2, excluding category 3. This removes the ambiguous middle of the scale from both classes: categories 4A to 4C carry a low to intermediate likelihood of malignancy and are frequently benign on biopsy, while category 3 denotes a probably benign finding warranting short-interval follow-up. The analysis is therefore a comparison of clearly benign against clearly malignant assessments, and is not a measure of early-stage detection. Of 804 internal positive patients, 308 were assessed as 4A, 132 as 4B, and 174 as 4C, leaving 190; of 3,833 internal negatives, 2,271 were assessed as category 3, leaving 1,562. The corresponding external counts were 311, 119, and 161 of 808 positives, leaving 217, and 2,861 of 5,251 negatives, leaving 2,390. These counts are shown in Figure 2.
Subgroup Analysis
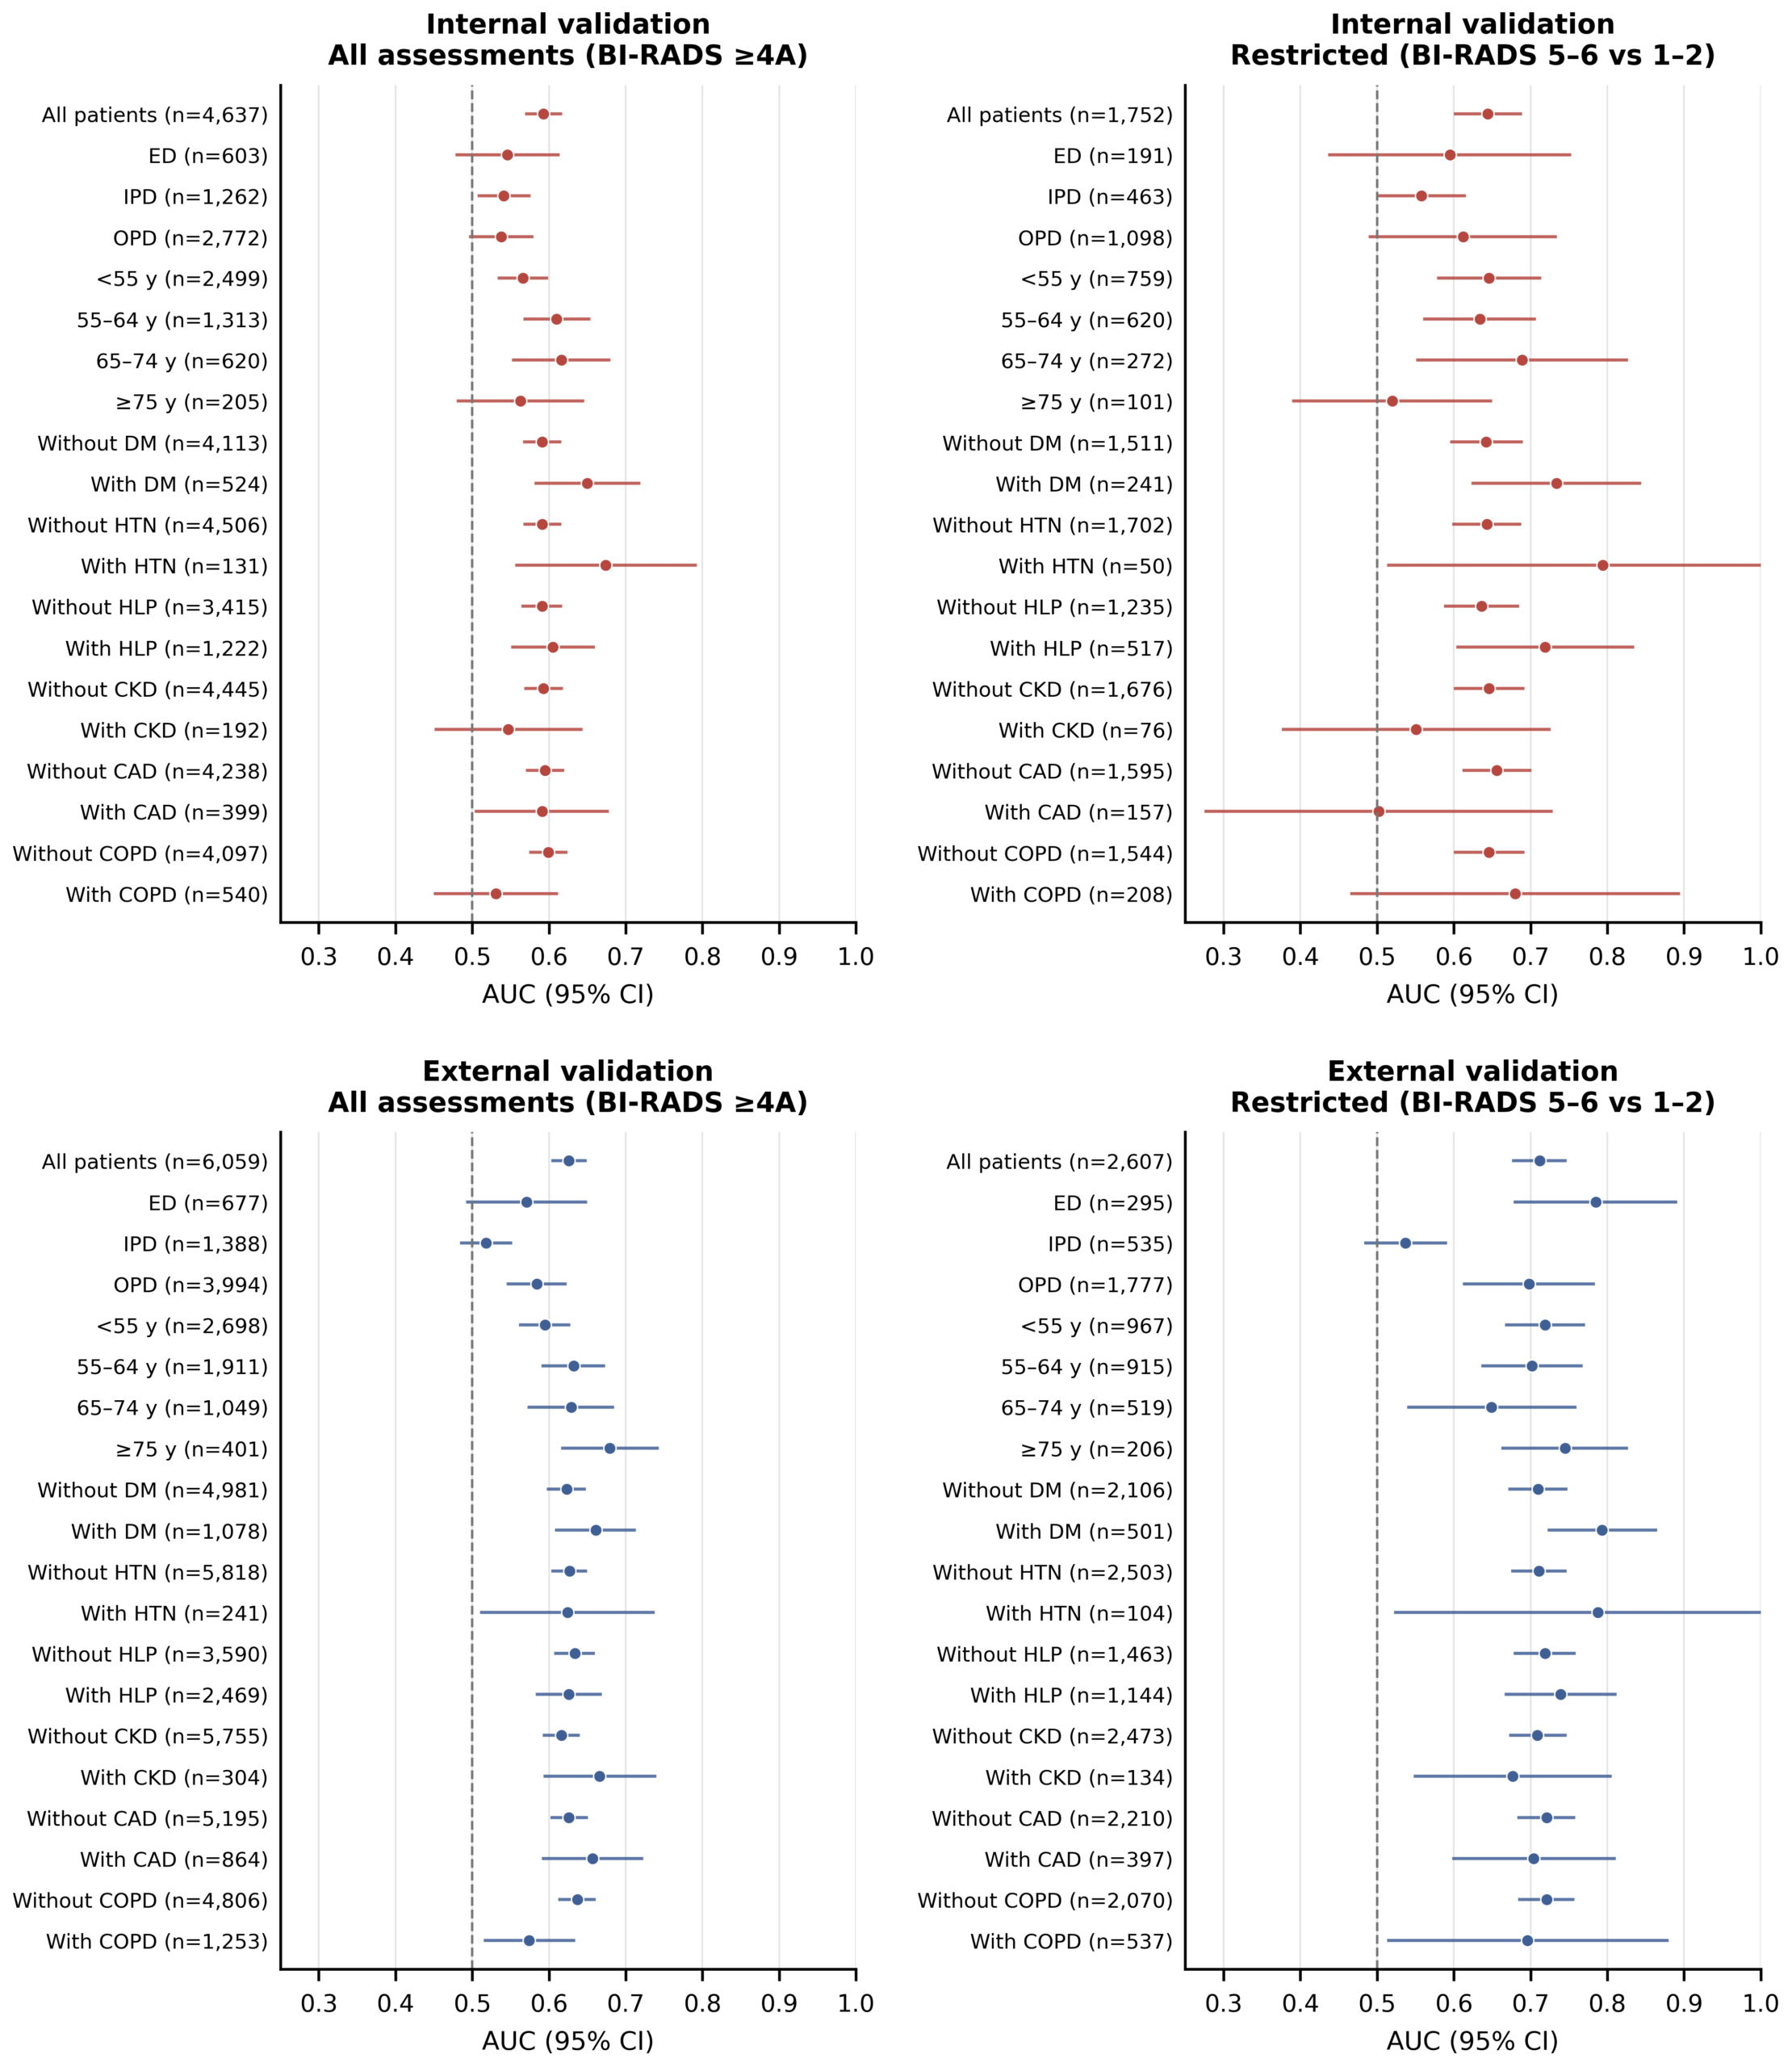
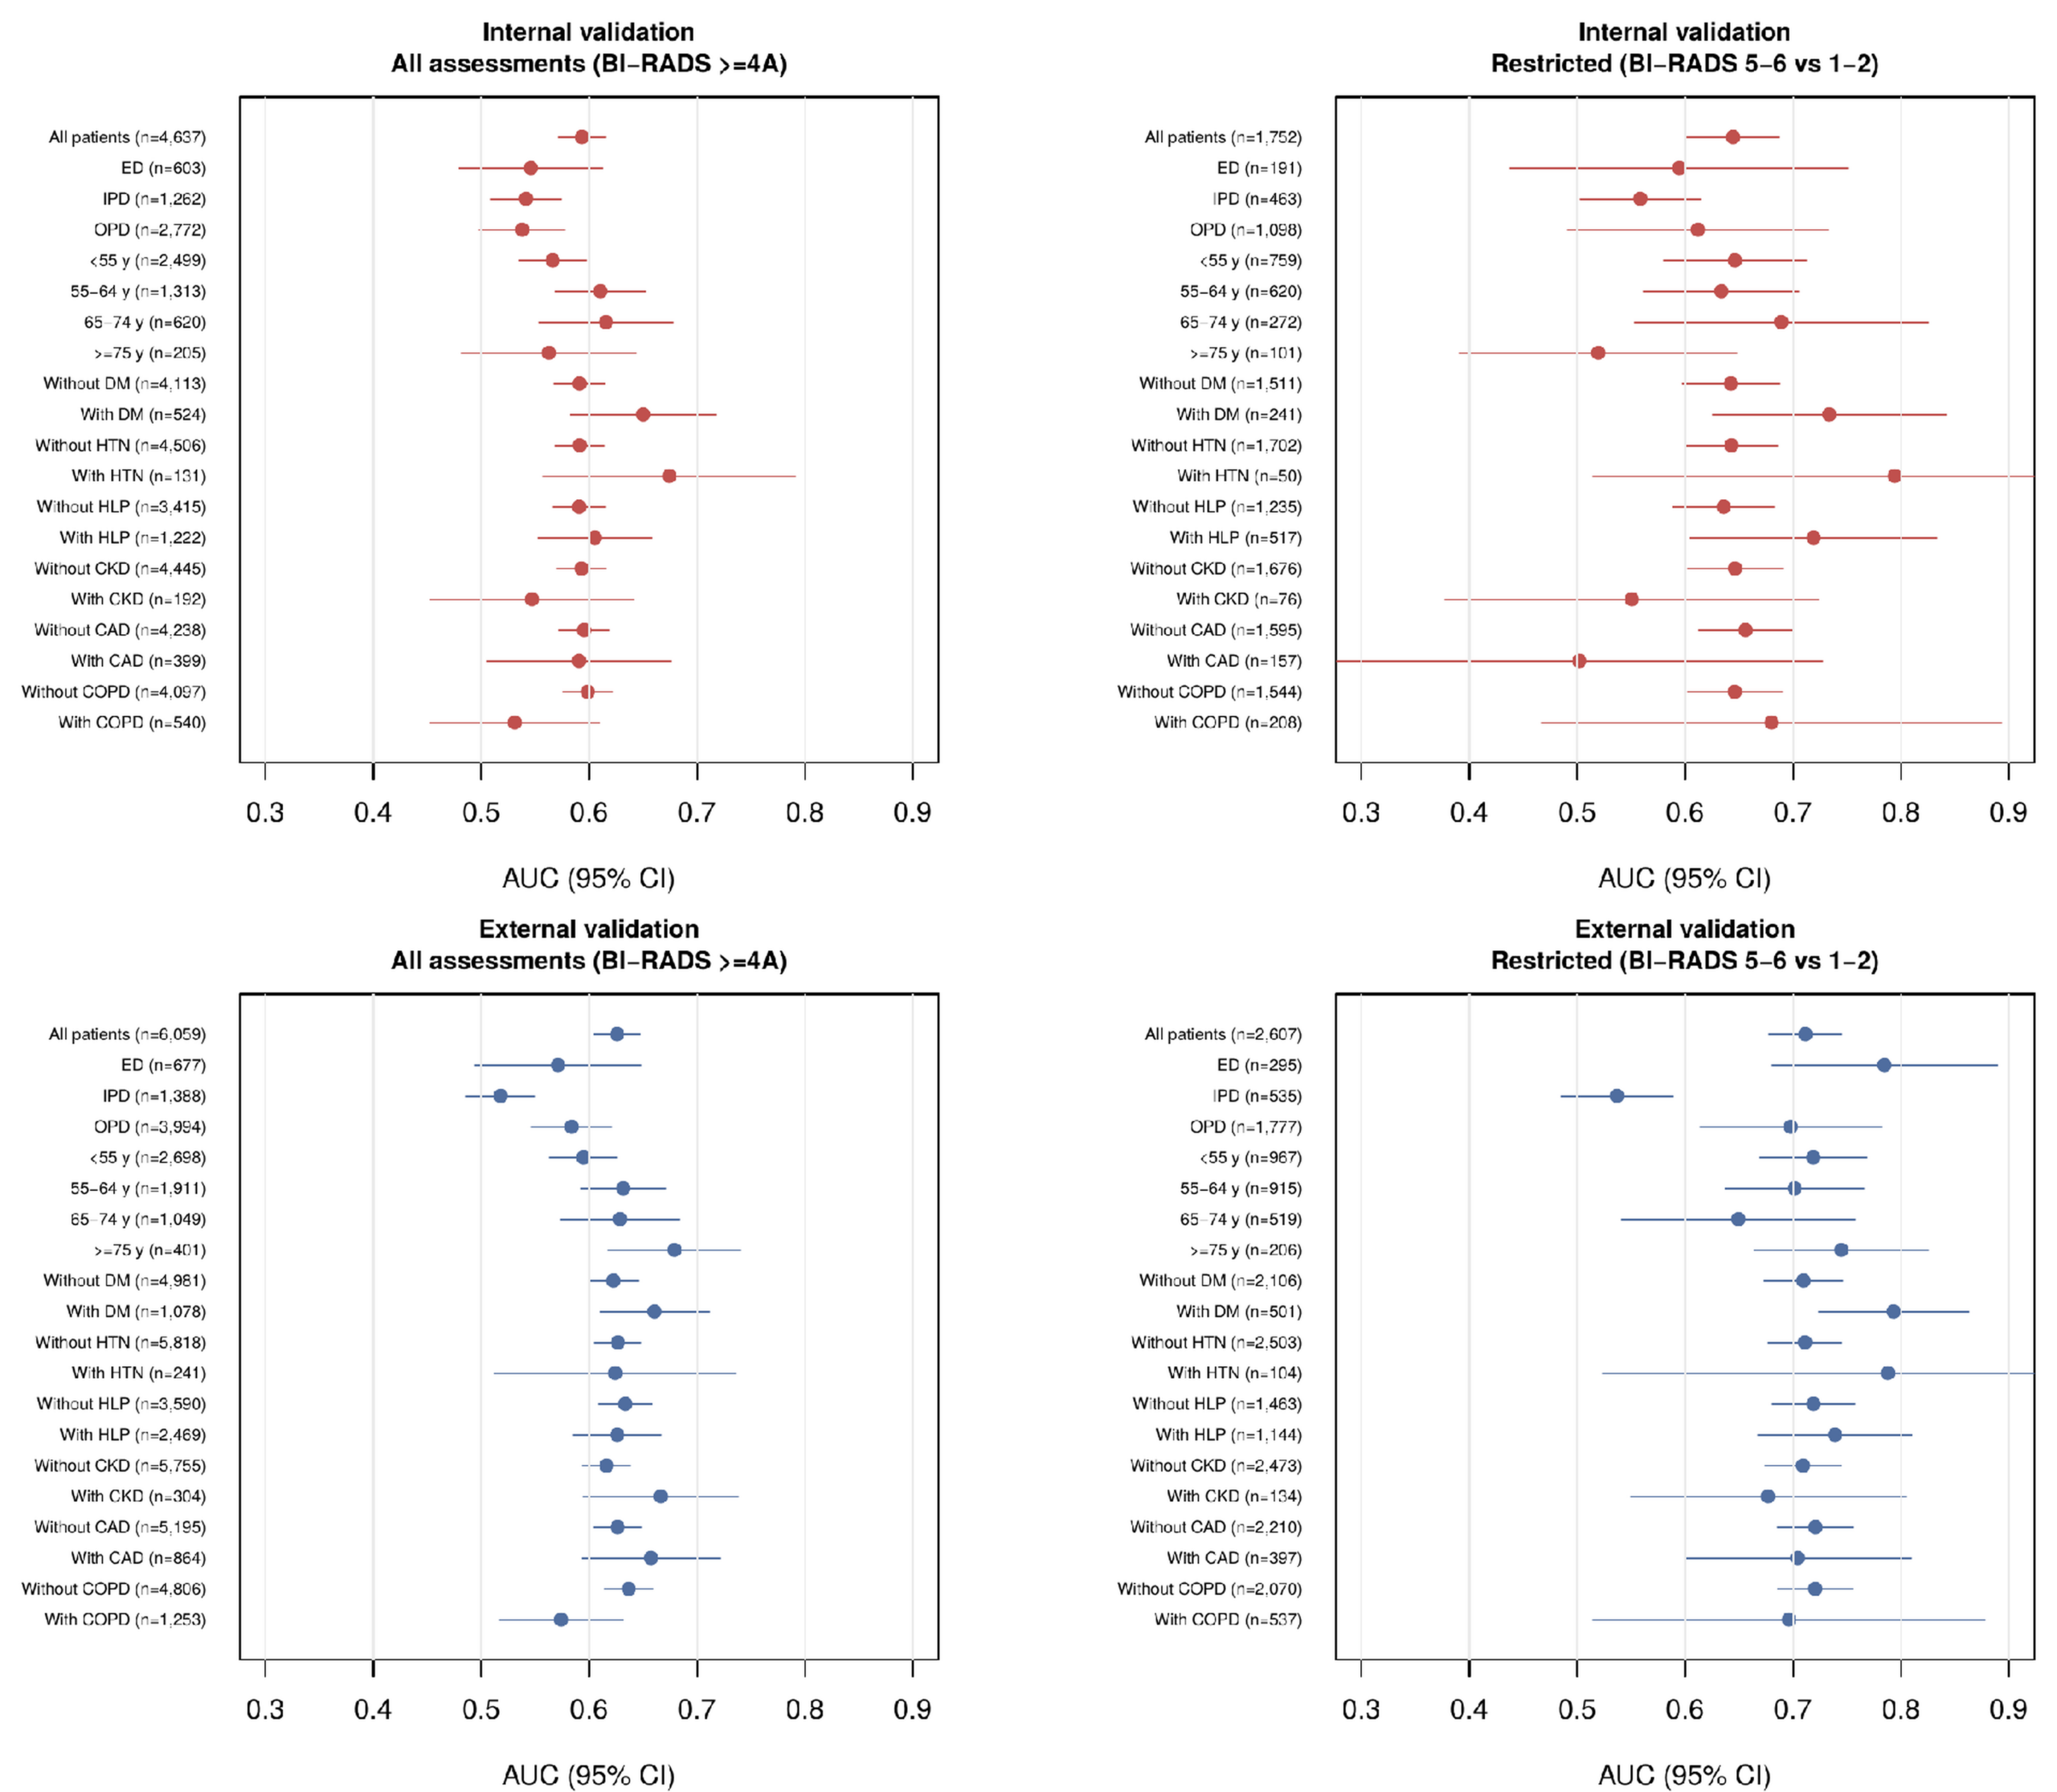
Subgroup analyses were performed by age band, by care setting (emergency department, ED; inpatient department, IPD; outpatient department, OPD), and by comorbidity status for diabetes mellitus, hypertension, hyperlipidemia (HLP), chronic kidney disease, coronary artery disease, and chronic obstructive pulmonary disease. AUC with 95% confidence intervals is reported for every subgroup in Table 4 and plotted in Figure 6. Heterogeneity across subgroups was assessed by inspection of overlap between subgroup confidence intervals and by comparison with the chance level of 0.5; no formal test of interaction was performed, and subgroup results are presented as descriptive. Discrimination is additionally reported stratified by radiographic projection and in an age-matched analysis.
| Subgroup | Internal, primary | Internal, restricted | External, primary | External, restricted |
| All patients | 0.593 (0.571–0.615), n=4,637 | 0.644 (0.602–0.687), n=1,752 | 0.626 (0.605–0.647), n=6,059 | 0.712 (0.678–0.745), n=2,607 |
| ED | 0.546 (0.480–0.612), n=603 | 0.595 (0.438–0.751), n=191 | 0.571 (0.494–0.648), n=677 | 0.785 (0.680–0.889), n=295 |
| IPD | 0.541 (0.509–0.574), n=1,262 | 0.558 (0.503–0.614), n=463 | 0.518 (0.486–0.550), n=1,388 | 0.537 (0.485–0.589), n=535 |
| OPD | 0.538 (0.498–0.578), n=2,772 | 0.612 (0.491–0.732), n=1,098 | 0.584 (0.547–0.621), n=3,994 | 0.698 (0.614–0.782), n=1,777 |
| <55 y | 0.566 (0.535–0.597), n=2,499 | 0.646 (0.580–0.712), n=759 | 0.595 (0.563–0.626), n=2,698 | 0.719 (0.669–0.769), n=967 |
| 55–64 y | 0.610 (0.569–0.652), n=1,313 | 0.634 (0.562–0.705), n=620 | 0.632 (0.592–0.671), n=1,911 | 0.702 (0.638–0.766), n=915 |
| 65–74 y | 0.616 (0.554–0.678), n=620 | 0.689 (0.553–0.825), n=272 | 0.629 (0.574–0.683), n=1,049 | 0.649 (0.541–0.758), n=519 |
| ≥75 y | 0.563 (0.482–0.644), n=205 | 0.520 (0.391–0.648), n=101 | 0.679 (0.618–0.741), n=401 | 0.745 (0.664–0.825), n=206 |
| Without DM | 0.591 (0.568–0.614), n=4,113 | 0.642 (0.597–0.688), n=1,511 | 0.623 (0.599–0.646), n=4,981 | 0.710 (0.673–0.746), n=2,106 |
| With DM | 0.650 (0.583–0.717), n=524 | 0.734 (0.625–0.842), n=241 | 0.661 (0.610–0.711), n=1,078 | 0.793 (0.724–0.863), n=501 |
| Without HTN | 0.591 (0.569–0.614), n=4,506 | 0.643 (0.600–0.686), n=1,702 | 0.627 (0.605–0.648), n=5,818 | 0.711 (0.677–0.745), n=2,503 |
| With HTN | 0.674 (0.558–0.791), n=131 | 0.794 (0.515–1.000), n=50 | 0.624 (0.512–0.736), n=241 | 0.788 (0.524–1.000), n=104 |
| Without HLP | 0.591 (0.566–0.615), n=3,415 | 0.636 (0.589–0.683), n=1,235 | 0.634 (0.609–0.658), n=3,590 | 0.719 (0.680–0.757), n=1,463 |
| With HLP | 0.605 (0.553–0.658), n=1,222 | 0.719 (0.605–0.833), n=517 | 0.626 (0.585–0.667), n=2,469 | 0.739 (0.668–0.810), n=1,144 |
| Without CKD | 0.593 (0.570–0.616), n=4,445 | 0.646 (0.602–0.690), n=1,676 | 0.616 (0.594–0.638), n=5,755 | 0.709 (0.674–0.745), n=2,473 |
| With CKD | 0.547 (0.453–0.642), n=192 | 0.551 (0.378–0.724), n=76 | 0.666 (0.595–0.738), n=304 | 0.677 (0.550–0.804), n=134 |
| Without CAD | 0.595 (0.572–0.618), n=4,238 | 0.656 (0.613–0.699), n=1,595 | 0.626 (0.604–0.649), n=5,195 | 0.721 (0.685–0.756), n=2,210 |
| With CAD | 0.591 (0.505–0.676), n=399 | 0.502 (0.277–0.727), n=157 | 0.657 (0.593–0.721), n=864 | 0.704 (0.600–0.809), n=397 |
| Without COPD | 0.599 (0.576–0.622), n=4,097 | 0.646 (0.602–0.690), n=1,544 | 0.637 (0.614–0.659), n=4,806 | 0.721 (0.686–0.755), n=2,070 |
| With COPD | 0.531 (0.452–0.610), n=540 | 0.680 (0.467–0.893), n=208 | 0.574 (0.517–0.632), n=1,253 | 0.696 (0.515–0.878), n=537 |
Long-term Outcome Analysis
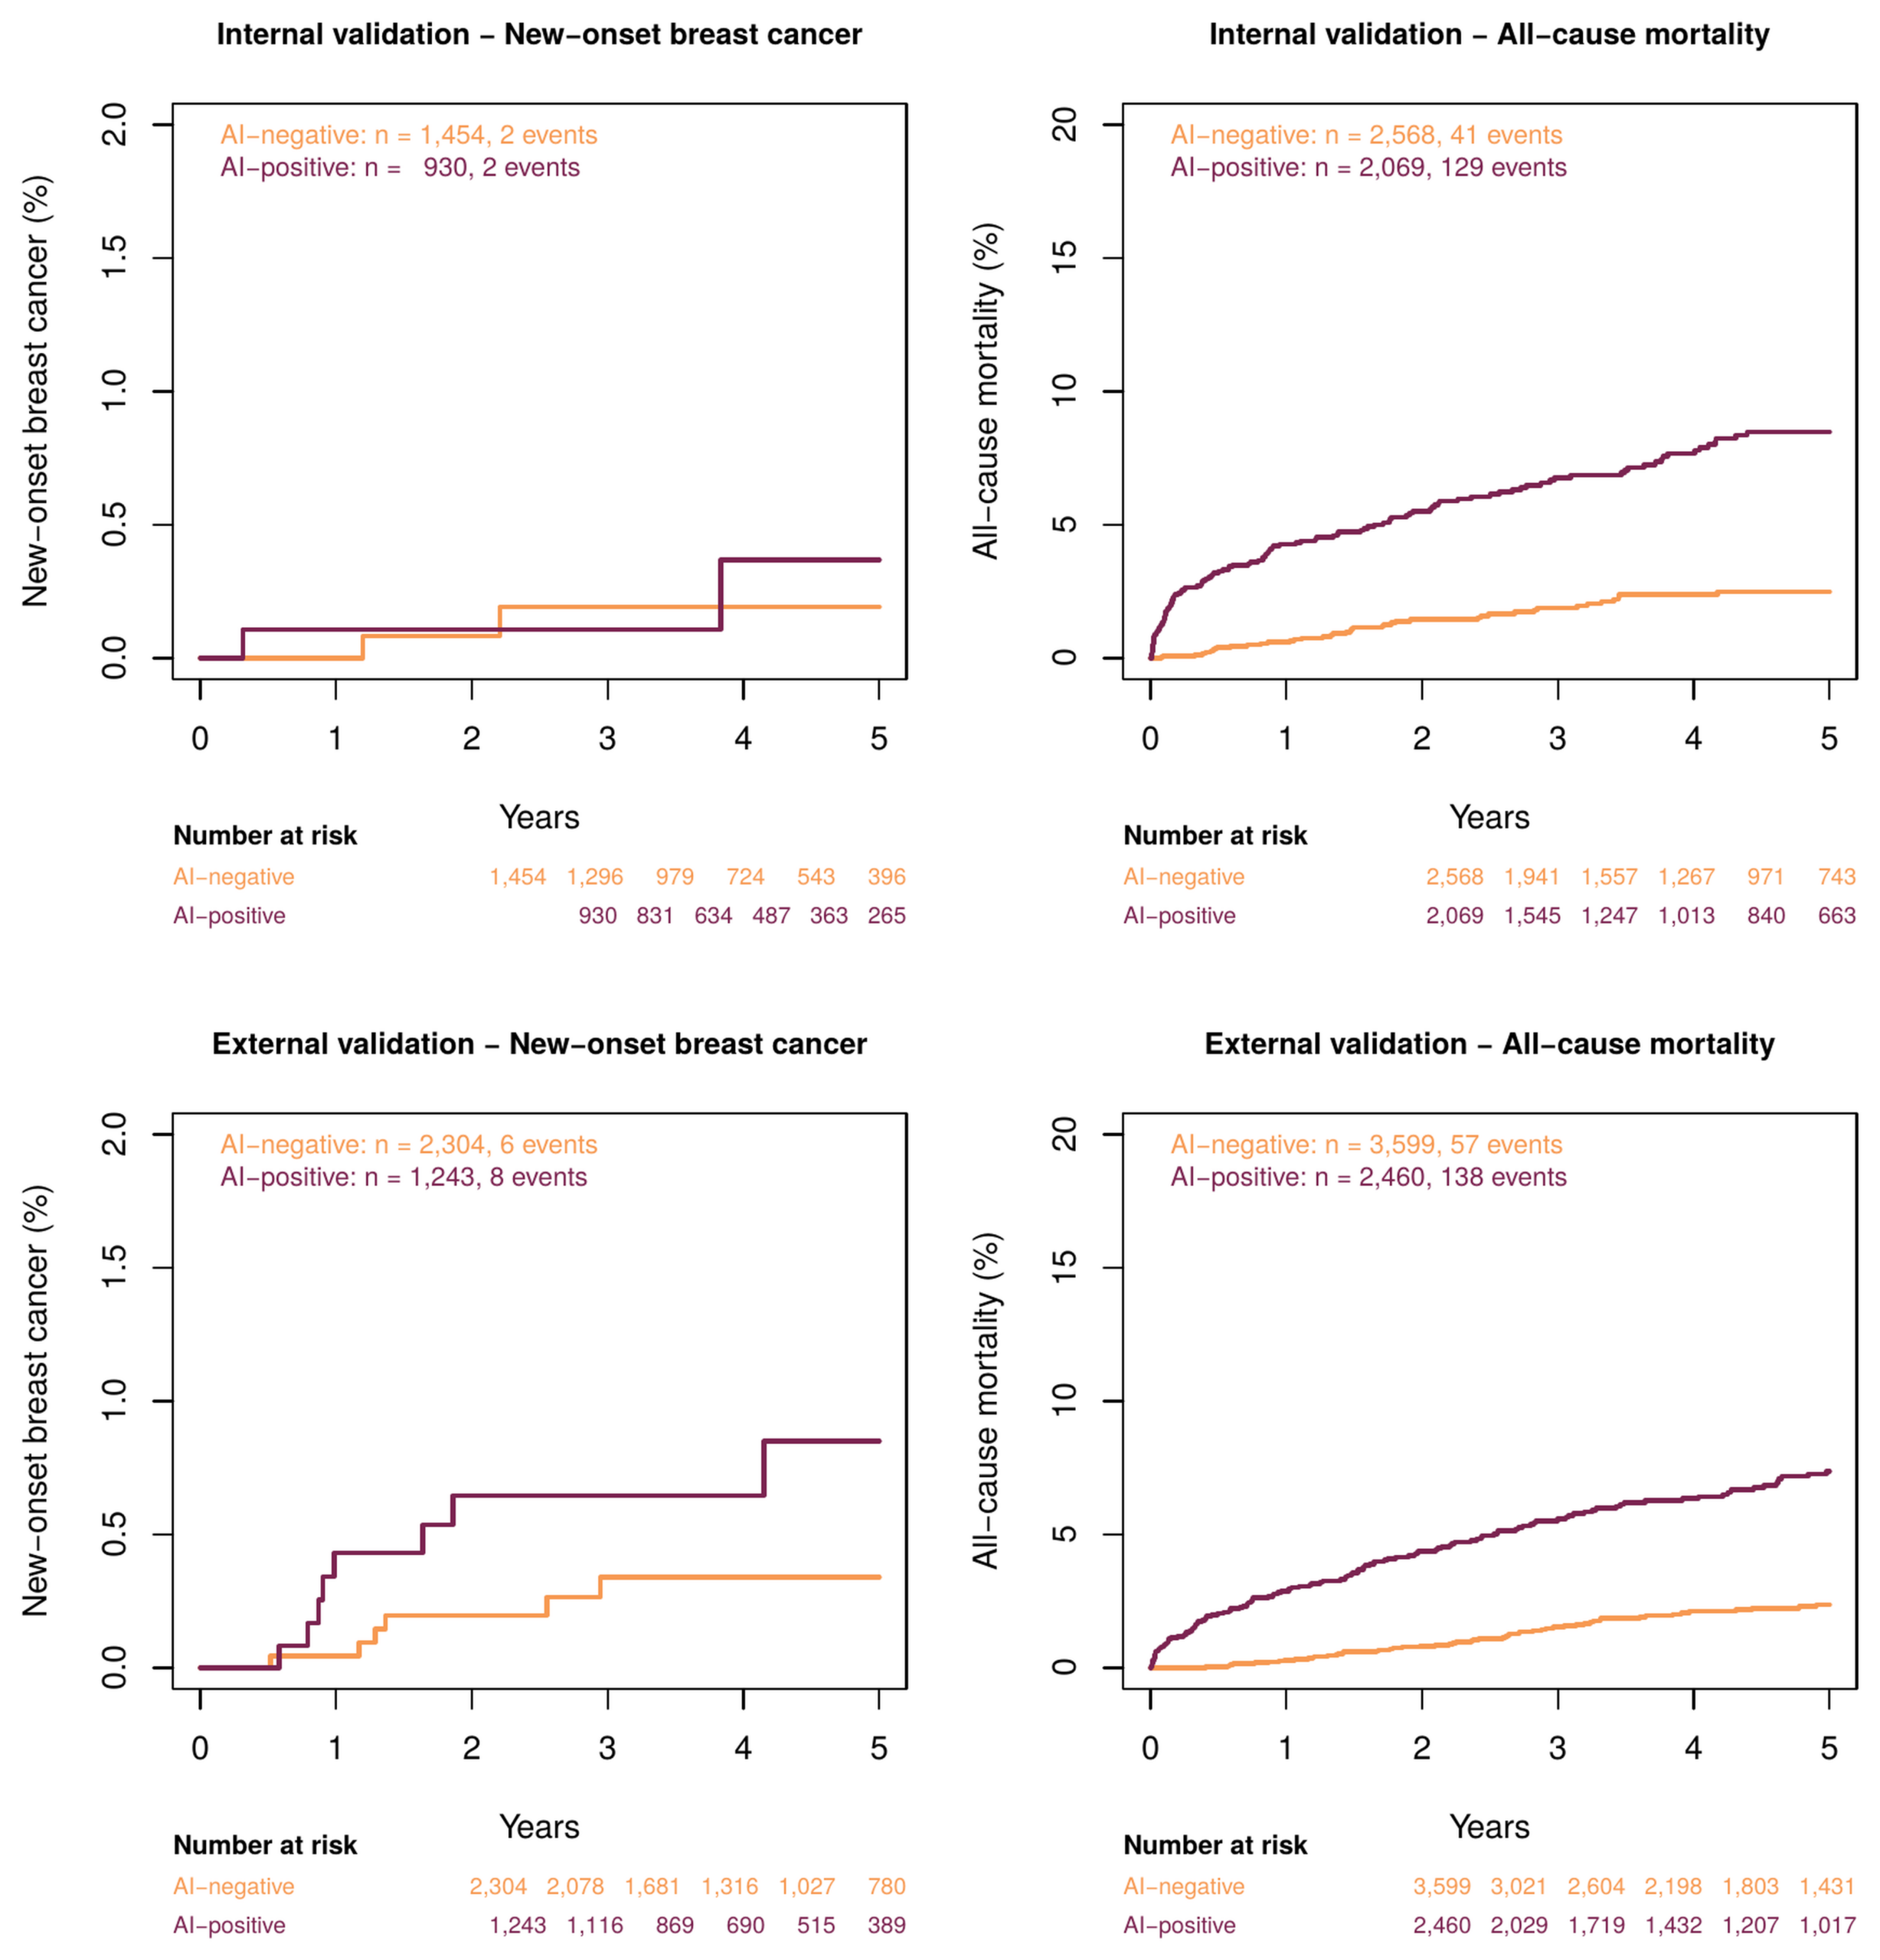
Five-year follow-up was used to examine associations between model output and two outcomes: new-onset breast cancer and all-cause mortality. Harrell’s concordance index47 and hazard ratios from Cox proportional hazards models are reported. Hazard ratios are presented with adjustment for age, and additionally with adjustment for comorbidity count and prevalent cancer status, so that the contribution of general health status can be distinguished from any breast-specific association. The proportional hazards assumption was tested using scaled Schoenfeld residuals48, and event counts are reported alongside every hazard ratio.
The new-onset breast cancer analysis applied two exclusions. Patients whose index assessment was already BI-RADS ≥4A were removed, since they cannot experience new-onset disease (804 internal, 808 external). Patients with no subsequent breast imaging beyond the eligibility window were removed for lack of ascertainable follow-up (1,449 internal, 1,704 external). This leaves 2,384 internal and 3,547 external patients at risk, which accounts for the difference between the two panels of Figure 7; the all-cause mortality analysis applied neither exclusion and retained the full validation sets. The event in this analysis is a subsequent breast imaging assessment of BI-RADS 5 or 6, not a pathologically confirmed diagnosis.
Confounding and Interpretability Analyses
Three analyses were performed to test whether model output reflects breast-specific information or general health status. First, discrimination for the imaging outcome was recomputed after adjustment for the model’s mortality-associated score, so that any residual breast-specific discrimination could be identified. Second, distributions of age, care setting, radiographic projection, imaging site, and comorbidity count were compared between positive and negative groups and are reported in Table 1. Third, occlusion analysis was performed in which the breast and axillary regions were masked prior to feature extraction, and the resulting change in AUC was recorded; a substantial performance drop under this masking would support the presence of a locally breast-related imaging pattern, whereas preserved performance would indicate reliance on information outside these regions.
Reporting
This study is reported in accordance with the TRIPOD+AI statement for prediction model studies using artificial intelligence49. The completed checklist is provided as supplementary material.
Ethical Considerations
This retrospective study was approved by the Institutional Review Board of Tri-Service General Hospital, National Defense Medical Center, Taiwan (IRB No. C202305019). De-identified imaging data were provided for analysis and the requirement for informed consent was waived.
Data and Code Availability
The feature extraction and downstream modeling pipeline is publicly available at https://github.com/oo800217/CXR_PheWAS, with an archived snapshot at https://doi.org/10.5281/zenodo.1924458239. Analysis code specific to the present study, including the refitting procedure described above, is available from the corresponding author on request. PASTER weights are not publicly distributed under licensing constraints; access may be requested under a data use and collaboration agreement. Derived embeddings for the development and tuning partitions may be made available to researchers under a data use agreement approved by the Institutional Review Board of Tri-Service General Hospital; embeddings for the validation cohorts were not retained. Individual patient imaging data cannot be shared.
Results
Cohort Characteristics
Cohort derivation is shown in Figure 2. The internal cohort of 15,451 patients was partitioned into development (7,712), tuning (3,102), and internal validation (4,637) sets. The internal validation set contained 804 positive and 3,833 negative patients, a positive fraction of 17.3%. The external validation set contained 6,059 patients, of whom 808 were positive and 5,251 negative, a positive fraction of 13.3%. Baseline characteristics for all four partitions, including age distribution, comorbidity prevalence, care setting, radiographic projection, and BI-RADS category distribution, are given in Table 1. Recorded comorbidity prevalence in the internal and external validation sets was 26.2% and 40.9% for hyperlipidemia, 11.5% and 17.8% for diabetes mellitus, 11.5% and 20.8% for chronic obstructive pulmonary disease, 8.4% and 14.2% for coronary artery disease, 4.8% and 7.7% for stroke, 4.1% and 5.3% for chronic kidney disease, 2.8% and 4.0% for hypertension, 1.7% and 3.4% for heart failure, and 0.8% and 1.4% for atrial fibrillation.
Comparison with Clinical Baseline Models
Age alone did not discriminate. The age-only logistic model achieved an AUC of 0.492 (95% CI 0.469–0.515) in the internal validation set and 0.494 (0.471–0.516) externally, with intervals spanning 0.5. The point estimates fall marginally below chance, indicating a weak inverse association between age and a suspicious assessment in these cohorts, consistent with mammographic screening being concentrated in middle age while older women undergo breast imaging for other indications. Simple age confounding therefore does not account for the imaging model’s performance.
Age together with nine comorbidities achieved 0.592 (0.571–0.613) internally and 0.616 (0.596–0.636) externally. These values are close to those of the imaging model itself, and the differences were small and not statistically significant: +0.002 internally (DeLong p = 0.91) and +0.010 externally (p = 0.47). On its own, therefore, the imaging model does not discriminate better than a short list of recorded diagnoses; internally the two curves are separated by 0.002.
A model combining the imaging embedding with age and the nine comorbidities achieved 0.629 (0.608–0.650) internally and 0.660 (0.639–0.680) externally, exceeding the clinical baseline by +0.037 and +0.044 respectively, both p < 0.001 by DeLong test. The imaging embedding therefore contributes information that the recorded clinical variables do not capture. This increment, rather than the absolute discrimination of the imaging model, is the principal quantitative finding of this study. All values are given in Table 5.
| Model / cohort | AUC (95% CI) | Sens. | Spec. | PPV / NPV | LR+ / LR− |
| Age only, internal | 0.492 (0.469–0.515) | — | — | — | — |
| Age + 9 comorbidities, internal | 0.592 (0.571–0.613) | — | — | — | — |
| Imaging model, internal | 0.593 (0.571–0.615) | 56.1% | 57.8% | 21.8 / 86.3 | 1.33 / 0.76 |
| Imaging + age + comorbidities, internal | 0.629 (0.608–0.650) | — | — | — | — |
| Imaging model, internal, restricted | 0.644 (0.602–0.687) | 64.2% | 57.3% | 15.5 / 92.9 | 1.50 / 0.63 |
| Age only, external | 0.494 (0.471–0.516) | — | — | — | — |
| Age + 9 comorbidities, external | 0.616 (0.596–0.636) | — | — | — | — |
| Imaging model, external | 0.626 (0.605–0.647) | 57.4% | 62.0% | 18.9 / 90.4 | 1.51 / 0.69 |
| Imaging + age + comorbidities, external | 0.660 (0.639–0.680) | — | — | — | — |
| Imaging model, external, restricted | 0.712 (0.678–0.745) | 69.1% | 61.8% | 14.1 / 95.7 | 1.81 / 0.50 |
Overall Classification Performance
In the internal validation set of 4,637 women the model achieved an AUC of 0.593 (95% CI 0.571–0.615), with sensitivity 56.1%, specificity 57.8%, positive predictive value 21.8%, and negative predictive value 86.3% at the locked threshold of 0.181. In the external validation set of 6,059 women the AUC was 0.626 (0.605–0.647), with sensitivity 57.4%, specificity 62.0%, positive predictive value 18.9%, and negative predictive value 90.4%.Both discrimination and the operating point depend on which radiograph is retained per patient, because the assigned BI-RADS category is not constant within a patient. Across ten random draws, AUC ranged from 0.588 to 0.606 internally and from 0.613 to 0.635 externally, and repeating the Youden selection on the tuning set gave cut-points from 0.121 to 0.464, an almost fourfold range. The sensitivity, specificity, predictive values, and definition of the AI-positive group reported here are therefore conditional on one particular draw and are reported across draws in Table 5. Receiver operating characteristic curves are shown in Figure 5 and all values are tabulated in Table 5.
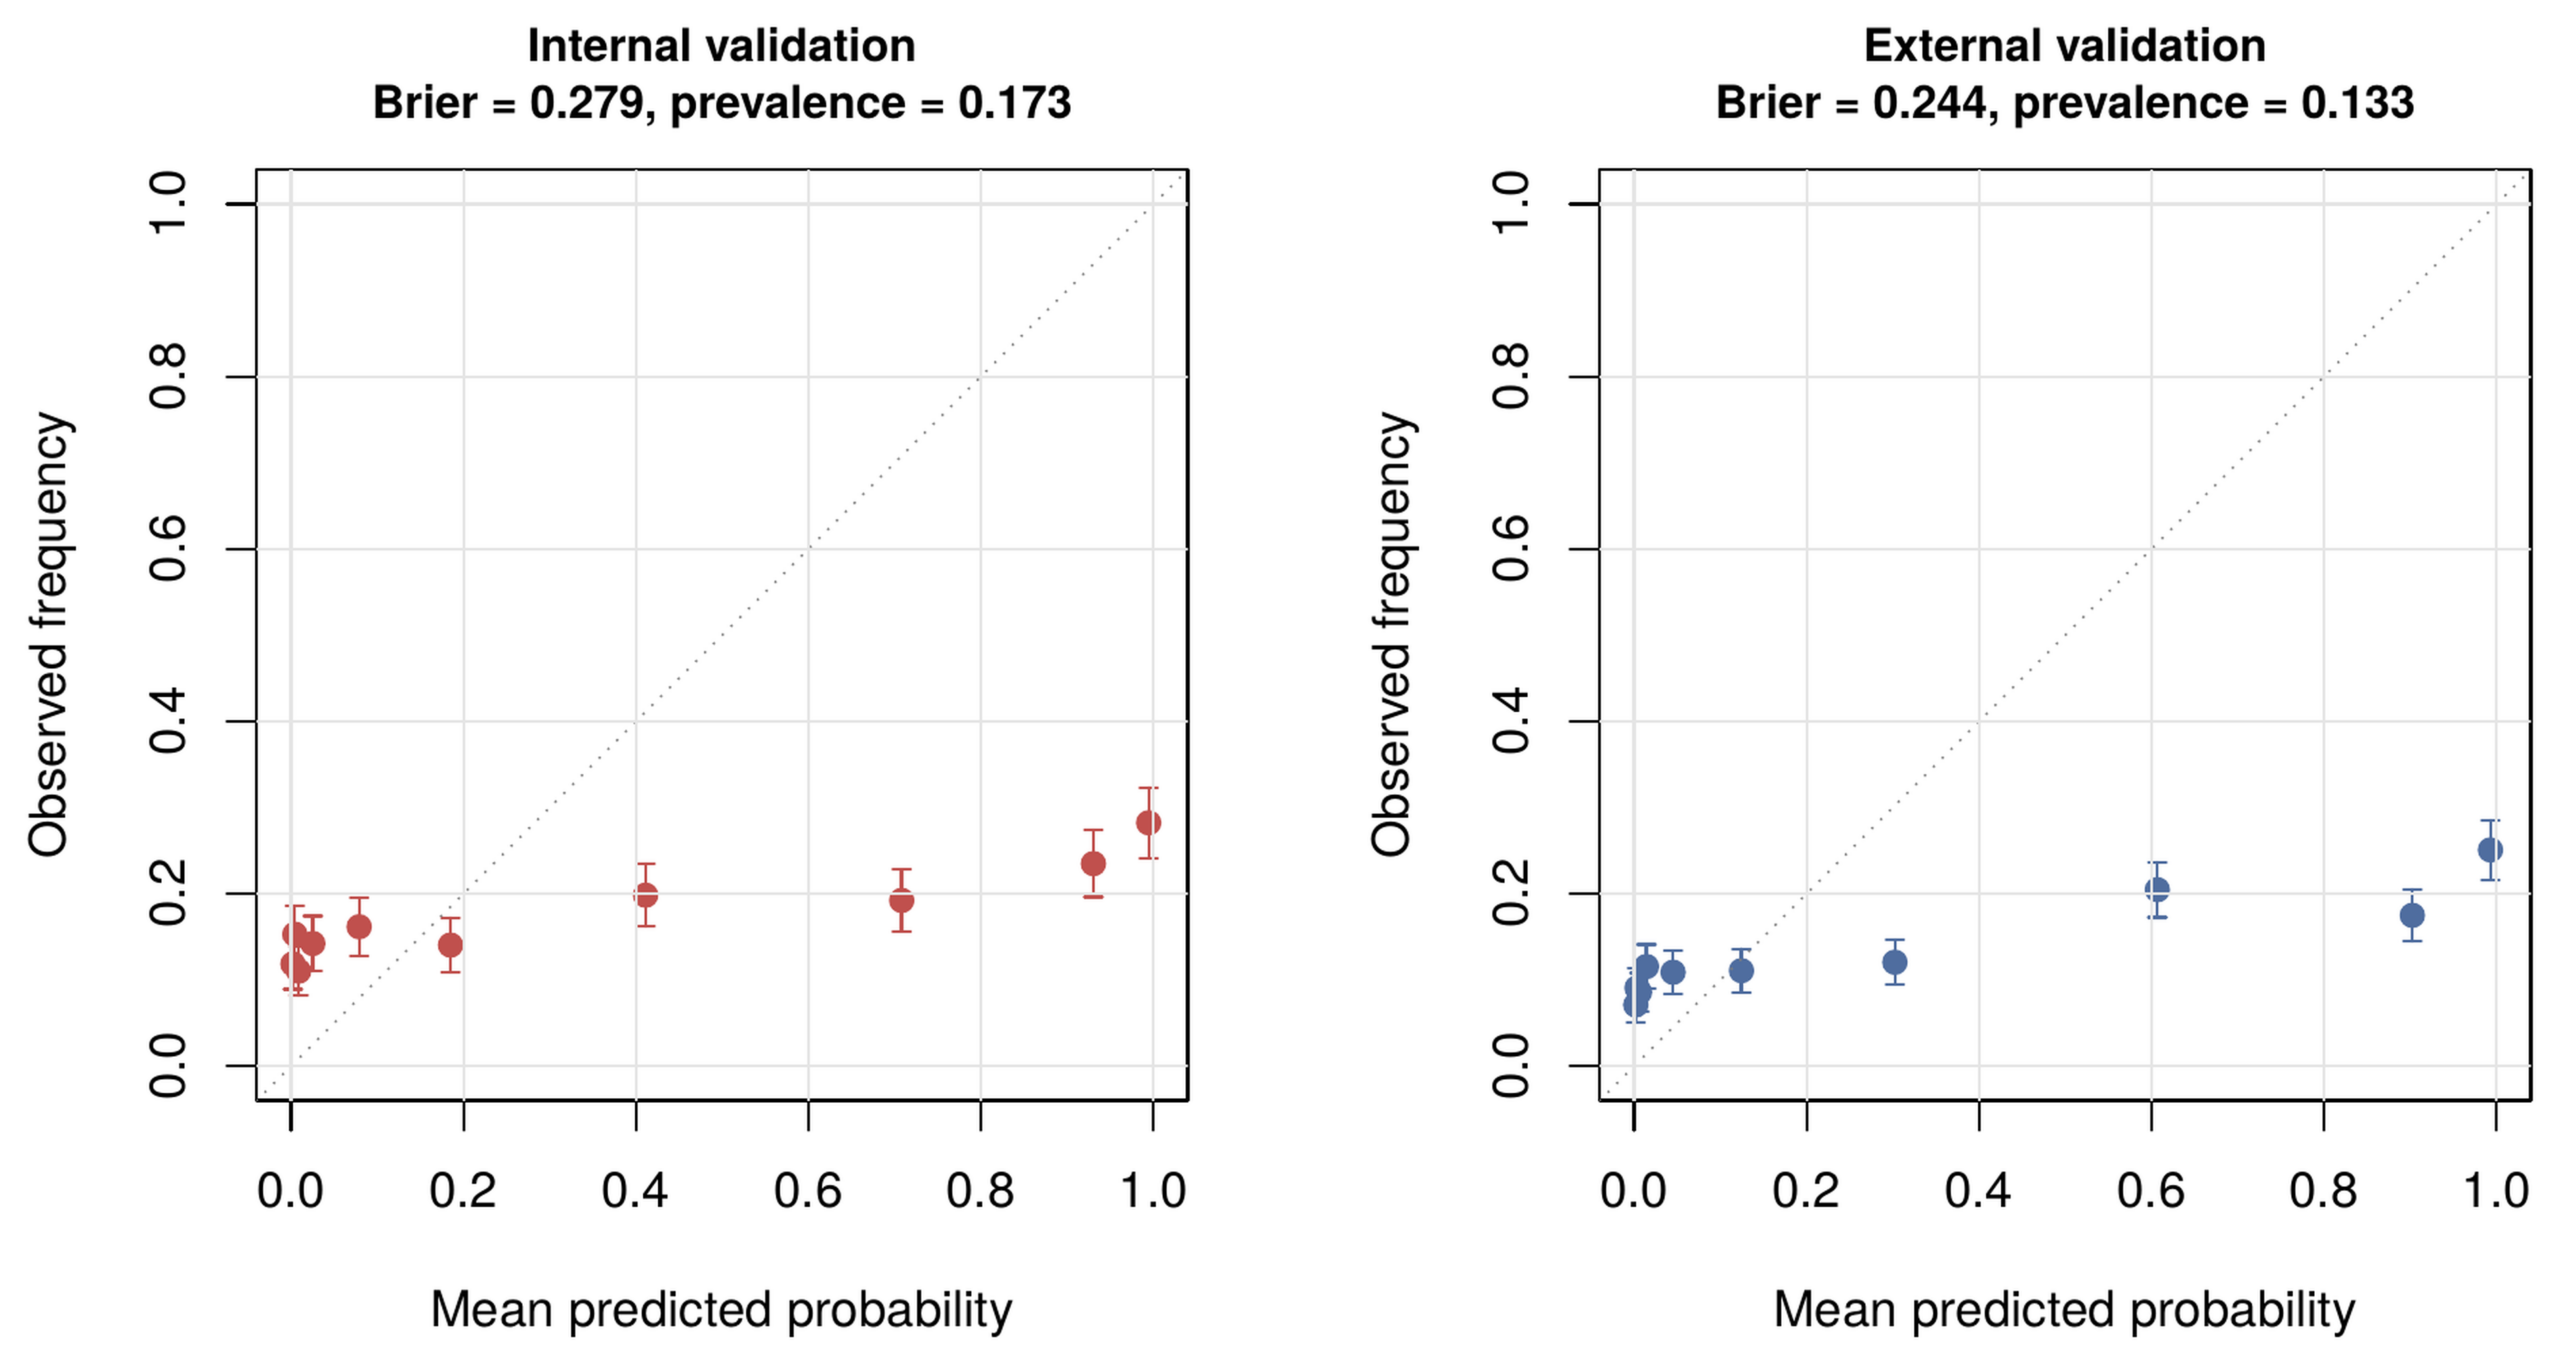
Likelihood ratios at the operating point were 1.33 positive and 0.76 negative internally, and 1.51 positive and 0.69 negative externally. The high negative predictive value reflects the low outcome prevalence rather than strong discrimination, and is reported here alongside prevalence for that reason. Calibration was poor. Mean predicted probability was 0.335 internally against an observed prevalence of 0.173, and 0.300 externally against 0.133, an approximately twofold systematic over-prediction consistent with shrinkage of the intercept by a regularization penalty applied to the bias term. Brier scores were 0.279 and 0.244. Calibration plots are shown in Figure 8, and results after refitting with the penalty restricted to the weight vector are reported alongside.
Performance in the Restricted Secondary Analysis
In the secondary analysis restricting the positive class to BI-RADS 5 and 6 and the negative class to BI-RADS 1 and 2, the internal cohort comprised 1,752 women (190 positive) and the external cohort 2,607 women (217 positive). The internal AUC was 0.644 (95% CI 0.602–0.687) and the external AUC was 0.712 (0.678–0.745), against 0.593 and 0.626 for the primary outcome. Operating characteristics at the locked threshold were sensitivity 64.2%, specificity 57.3%, positive predictive value 15.5%, and negative predictive value 92.9% internally, and 69.1%, 61.8%, 14.1%, and 95.7% externally. Likelihood ratios were 1.50 positive and 0.63 negative internally, and 1.81 positive and 0.50 negative externally. The restricted and primary analyses are computed on different, non-nested samples and are therefore not compared statistically.
The increase in AUC is expected rather than anomalous. The restriction removes the ambiguous band from both classes simultaneously: categories 4A to 4C, which carry a low to intermediate likelihood of malignancy and are therefore frequently benign, are removed from the positive class, while category 3 is removed from the negative class. Both classes are purified and separation improves accordingly. Performance in this setting describes discrimination between clearly benign and clearly malignant assessments, not early detection.This interpretation is further constrained by composition. Of the positive class in this analysis, 84 of 190 internally (44%) and 98 of 217 externally (45%) were BI-RADS 6, that is, malignancy confirmed by biopsy before the index radiograph was acquired. Nearly half of the apparent signal in this analysis therefore derives from disease already diagnosed and in many cases already under treatment. The categories removed from the positive class were 308 assessed as 4A, 132 as 4B, and 174 as 4C internally, and 311, 119, and 161 externally; 2,271 and 2,861 patients assessed as BI-RADS 3 were removed from the negative class. AUC by BI-RADS category, and after exclusion of category 6, is reported in Table 6.
| BI-RADS category | Internal, n | External, n | Enters analysis |
| 1 | 51 | 92 | Primary (neg), secondary (neg) |
| 2 | 1,511 | 2,298 | Primary (neg), secondary (neg) |
| 3 | 2,271 | 2,861 | Primary (neg) only |
| 4A | 308 | 311 | Primary (pos) only |
| 4B | 132 | 119 | Primary (pos) only |
| 4C | 174 | 161 | Primary (pos) only |
| 5 | 106 | 119 | Primary (pos), secondary (pos) |
| 6 | 84 | 98 | Primary (pos), secondary (pos) |
| Total | 4,637 | 6,059 | — |
Subgroup Performance
Discrimination varied across subgroups. In the internal validation set AUC values ranged from 0.531 to 0.674. Patients with diabetes mellitus had an AUC of 0.650 (95% CI 0.583–0.717, n = 524) and patients with hypertension 0.674 (0.558–0.791, n = 131), while patients without diabetes and patients without hypertension both had an AUC of 0.591. Several subgroups had confidence intervals spanning 0.5, and discrimination in these groups is not distinguishable from chance: emergency department 0.546 (0.480–0.612), age over 75 years 0.561 (0.480–0.642), chronic kidney disease 0.547 (0.453–0.642), and chronic obstructive pulmonary disease 0.531 (0.452–0.610). In the external validation set the inpatient subgroup had an AUC of 0.518 (0.486–0.550). In the stage-restricted internal analysis the coronary artery disease subgroup had an AUC of 0.502 (0.277–0.727). No formal test of subgroup heterogeneity was performed; subgroup estimates are descriptive and several are imprecise. All subgroup values with confidence intervals are given in Table 4 and plotted in Figure 6. Subgroup sizes vary by two orders of magnitude and several estimates are correspondingly imprecise; the hypertension subgroup comprises 131 patients, reflecting the low recorded prevalence discussed in the limitations, and its apparently superior discrimination should not be interpreted as a subgroup effect.
In the stage-restricted internal analysis the highest observed subgroup AUC was 0.734, in patients with diabetes mellitus. Radiographic projection was not recorded in the extract, so projection-stratified analysis could not be performed. Discrimination was essentially unchanged when age was held constant: pooling AUC within five-year age bands gave 0.591 internally and 0.617 externally, against 0.593 and 0.626 overall.
Long-term Outcome Association
Over five years of follow-up, model output was strongly associated with all-cause mortality. In the internal validation set, among 170 deaths, the age-adjusted hazard ratio was 3.51 (95% CI 2.47–5.00); this was 3.54 (2.49–5.04) with further adjustment for comorbidity count and 3.05 (2.13–4.36) with additional adjustment for a positive breast imaging assessment at index. Corresponding external values, among 195 deaths, were 2.88 (2.11–3.95), 2.96 (2.16–4.05), and 2.52 (1.83–3.47). The association is therefore not explained by the comorbidities recorded in these cohorts: adjustment for comorbidity count left the estimate unchanged, and the model identifies mortality risk beyond what the diagnosis codes capture.
Associations with new-onset breast cancer could be estimated only in the external cohort. After the exclusions described in the Methods, 2,384 internal and 3,547 external patients remained at risk, among whom 4 and 14 events accrued over five years. The internal estimate rests on four events and is not reported. In the external cohort the age-adjusted hazard ratio was 2.50 (0.86–7.20), an interval compatible with no association; the proportional hazards assumption was not violated (scaled Schoenfeld residuals, global p = 0.84; p = 0.56 for the model term). The analysis is underpowered rather than negative.
Whether the imaging signal is simply a marker of mortality risk was tested directly. A logistic model for five-year mortality was fitted on the development set from age and the nine comorbidities, and the imaging score was residualised against the resulting mortality score. That mortality score discriminated the imaging outcome poorly on its own, with an AUC of 0.547 (0.524–0.569) internally and 0.564 (0.542–0.586) externally. Residualising the imaging score against it reduced discrimination only from 0.593 to 0.587 (0.565–0.609) internally and from 0.626 to 0.617 (0.596–0.638) externally. The imaging signal for the breast outcome therefore does not lie along the mortality axis, despite the model’s strong association with death.
Temporal Direction of the Eligibility Window
Discrimination was similar in both temporal directions, with a small and consistent advantage for radiographs acquired after the breast study. Among the 2,653 internal patients (57.2%) whose radiograph preceded the breast study, AUC was 0.569, against 0.591 among the 1,984 (42.8%) whose radiograph followed it. Externally the corresponding values were 0.601 among 3,534 patients (58.3%) and 0.615 among 2,525 (41.7%). The differences of 0.022 and 0.014 are small relative to the confidence intervals for the pooled estimates, so post-diagnostic or post-treatment information cannot be excluded as a partial contributor, but neither can it account for the bulk of the observed discrimination. The two subgroups also differ in outcome prevalence, consistent with chest radiography being ordered more frequently after a suspicious breast finding, and are not exchangeable.
Clinical Utility
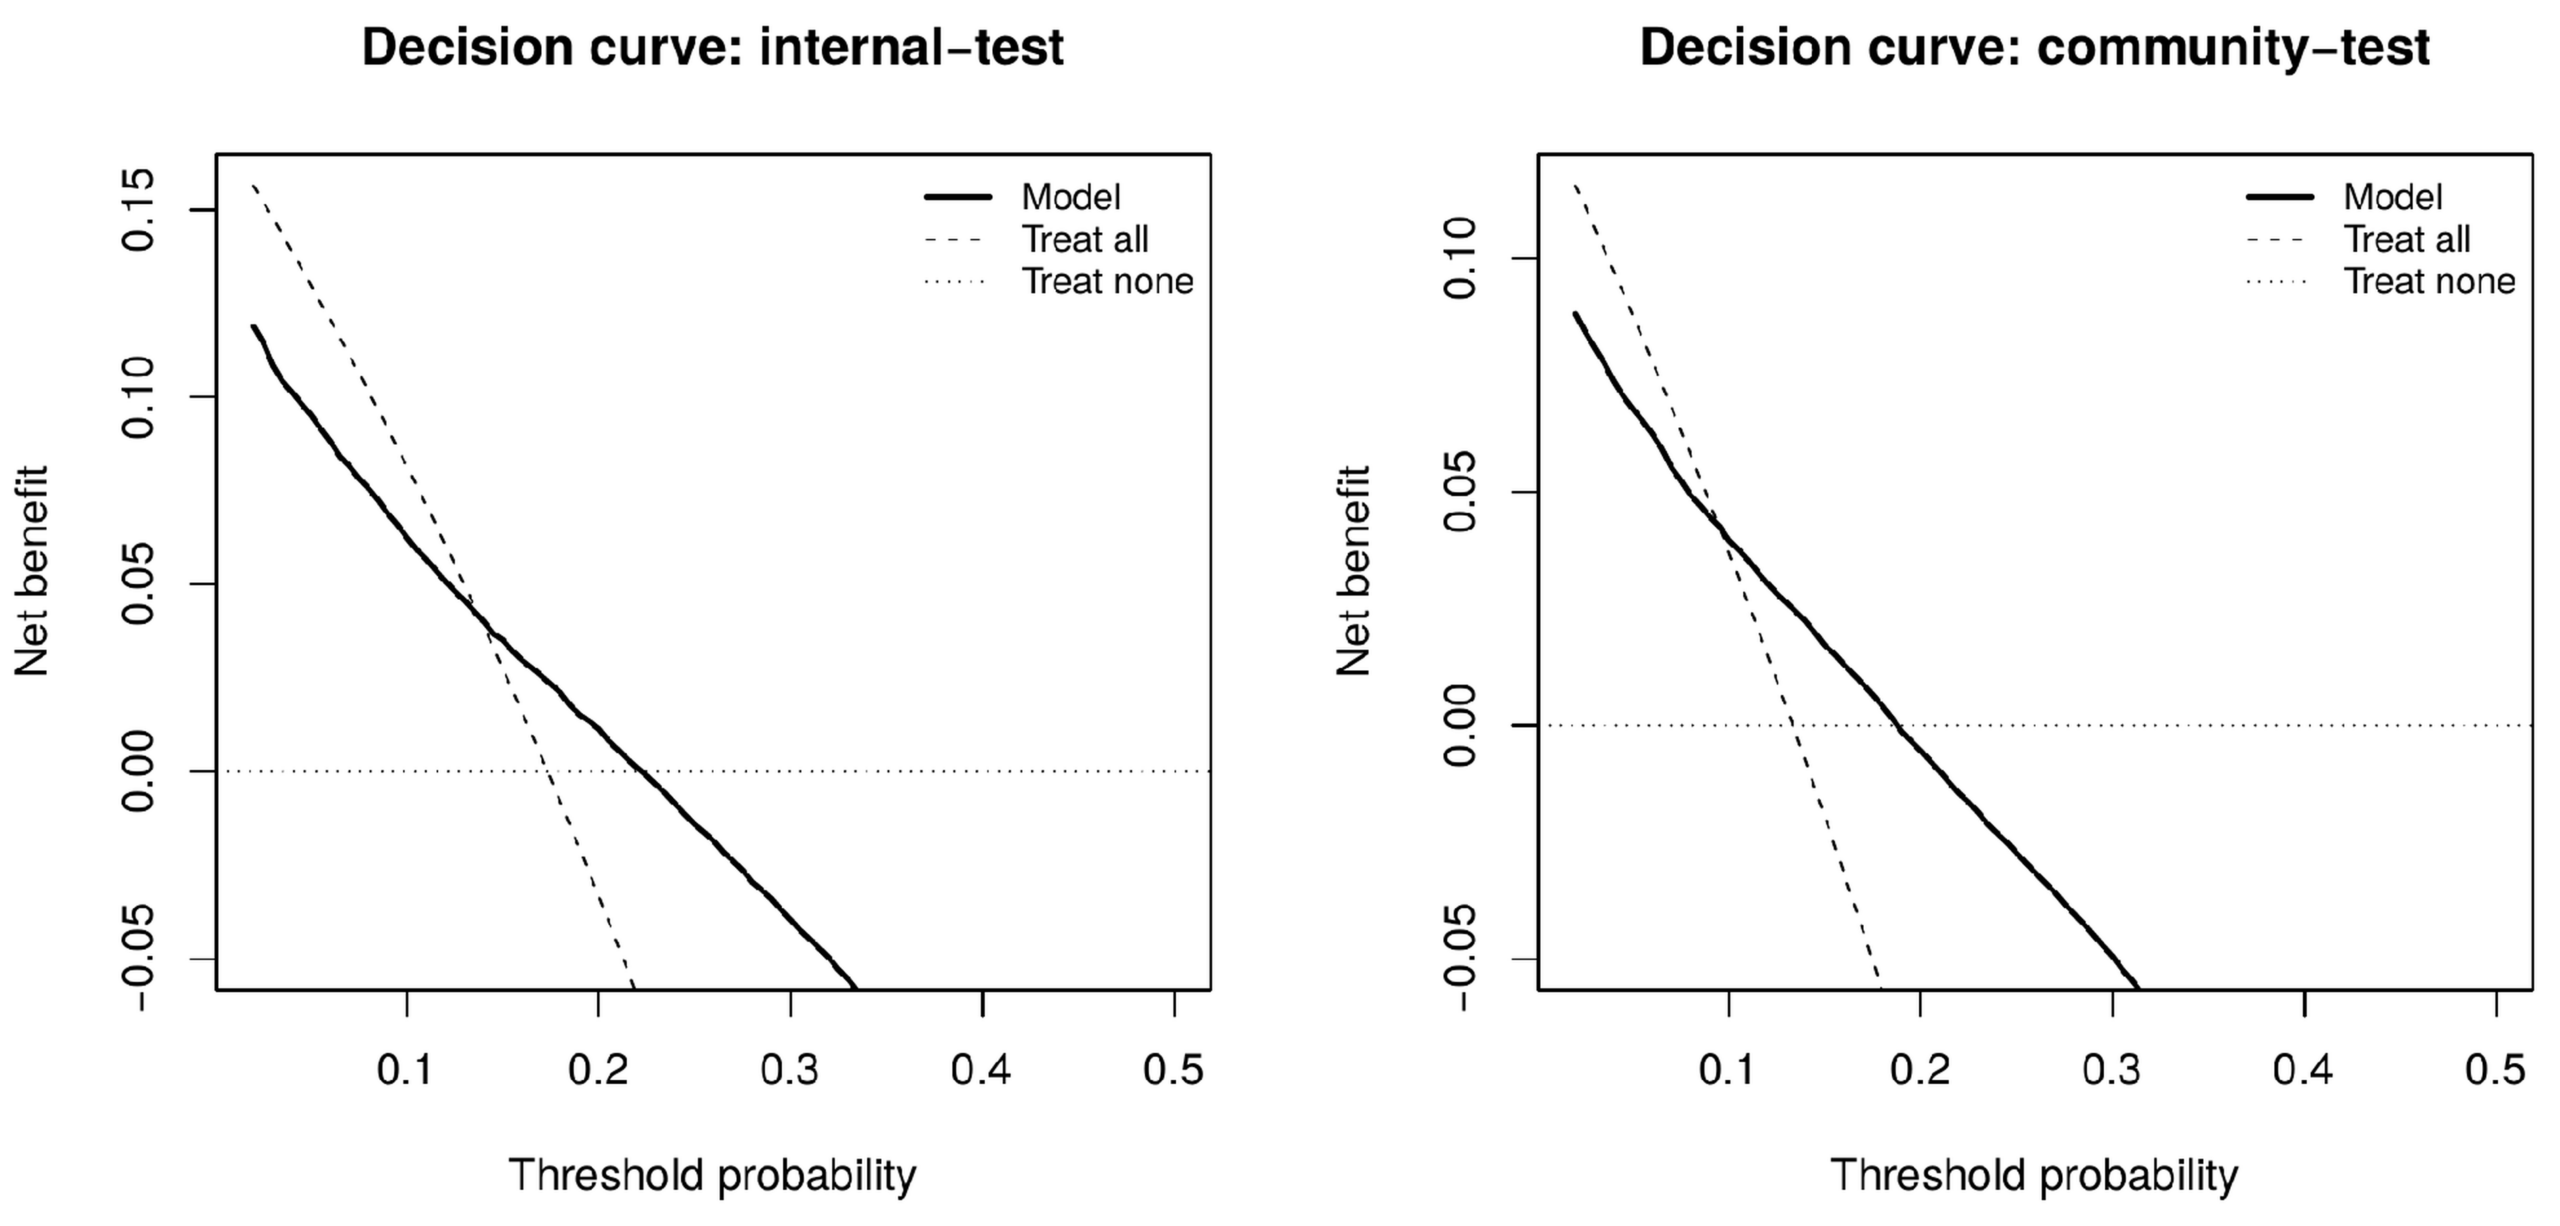
At the internal operating point the proportion of the cohort flagged as AI-positive was 44.6%, capturing 56.1% of positive cases against the 44.6% that random flagging of the same proportion would capture. The number needed to image to identify one positive assessment was 4.6 among flagged patients, against 5.8 in the unselected cohort; corresponding external values were 5.3 and 7.5, with 40.6% flagged capturing 57.4% of positives. Decision curve analysis is shown in Figure 9. Net benefit exceeded both the treat-all and treat-none strategies over threshold probabilities of 0.14 to 0.22 internally and 0.10 to 0.18 externally, ranges that bracket the observed outcome prevalence in each cohort (0.173 and 0.133). Clinical utility is therefore present but confined to a narrow band of threshold probabilities near prevalence.
Occlusion analysis of the breast and axillary regions, which would test whether the independent imaging contribution arises from breast-adjacent anatomy, was not performed: inference-stage embeddings for the validation cohorts were not retained and the source images were not available for re-extraction during this revision. This is the principal direction for future work, and is feasible in any cohort where the source radiographs remain accessible. The anatomical origin of the signal therefore remains unestablished.
Discussion
Embeddings from a chest radiograph foundation model showed modest discrimination for a subsequent suspicious breast imaging assessment, with AUC values near 0.60 in both cohorts. The central question is not whether that discrimination exists but what produces it, and the comparison against clinical baselines answers it directly. Age alone discriminates at chance in both cohorts, so a simple age confound is excluded. But age together with nine recorded comorbidities matches the imaging model, with differences of +0.002 and +0.010 and p values of 0.91 and 0.47. A model that sees only a list of diagnosis codes performs as well as one that sees the radiograph.
The nature of that shared information is not, however, general frailty. Model output was strongly associated with all-cause mortality in both cohorts, and that association survived adjustment for comorbidity count, so the embedding carries prognostic information the diagnosis codes do not. But discrimination for the breast imaging outcome does not lie along that axis. A mortality score built from age and comorbidities discriminated the imaging outcome at only 0.547 and 0.564, and residualising the imaging score against it cost just 0.006 and 0.009 in AUC. The model therefore predicts death and predicts a suspicious breast assessment, but it does not predict the latter by way of the former. An interpretation in which the classifier is simply a frailty detector, which the opportunistic chest radiograph literature would make natural16,20,21, is not supported by these data.
This concern is a specific instance of a general problem in chest radiograph modeling. Models can learn acquisition site, scanner characteristics, burned-in markers, patient positioning, and patient attributes including race33,34,36, and such shortcuts produce apparent accuracy that fails to transfer34. Hidden stratification and subgroup performance gaps are common in exactly this setting37,38. The subgroup results here are consistent with that pattern: several subgroups, including emergency department patients, patients over 75 years, and patients with chronic kidney disease or chronic obstructive pulmonary disease, had confidence intervals spanning 0.5, and discrimination in the external inpatient subgroup was close to chance. Discrimination was higher in patients with diabetes and hypertension than in those without, which is difficult to reconcile with a breast-specific mechanism and is more readily explained by a comorbidity-related signal.
The population studied also constrains what can be claimed. Every patient in both cohorts already had a breast imaging report, which is why the positive fraction is 13% to 17% rather than the fraction below one percent expected in an unselected screening population. This is an enriched diagnostic cohort, not a screening cohort. The present design therefore cannot test whether the model would identify risk in women who never entered the breast imaging pathway, and no claim to that effect is made. Establishing such a role would require validation in a cohort of women who received a chest radiograph and had no breast imaging referral, with outcomes ascertained through registry linkage. The operating characteristics are modest but not null: likelihood ratios between 1.33 and 1.81 positive correspond to limited revision of pre-test probability, yet decision curve analysis showed net benefit above both default strategies over threshold probabilities bracketing prevalence in each cohort, and the number needed to image fell from 5.8 to 4.6 internally and from 7.5 to 5.3 externally. Any utility is therefore confined to a narrow band of thresholds near prevalence, within the enriched population studied.
The choice of reference outcome is a further limitation on interpretation. BI-RADS ≥4A denotes radiological suspicion warranting tissue diagnosis, not confirmed malignancy; category 4A alone carries a malignancy likelihood of only 2% to 10%41, so most positives in this study are expected to be benign on biopsy, while category 6 denotes malignancy proven before the imaging study. Aggregating these categories into a single positive label produces an outcome that is heterogeneous in both the probability and the timing of disease. This is why the outcome is described as a suspicious breast imaging assessment throughout, and why the secondary analysis carries less weight than its higher AUC suggests. That analysis removes the ambiguous band from both classes at once, which raises AUC by construction, and 44% to 45% of its positive class is BI-RADS 6, denoting malignancy proven by biopsy before the radiograph was taken. Discrimination there partly reflects recognition of disease already diagnosed and treated, which is a different task from prediction.
Several further limitations should be considered. The study is retrospective, and prospective evaluation would be required to establish clinical utility. Inclusion required an existing BI-RADS report, which introduces selection bias relative to any intended screening application. The eligibility window was applied in both temporal directions, so a substantial minority of radiographs postdate the breast assessment; the primary analysis is restricted to those that precede it, but the two subgroups differ markedly in outcome prevalence and are not exchangeable. Because each radiograph is matched to its own nearest breast assessment, assigned labels are not constant within a patient and reported metrics vary with the random single-radiograph draw. Predicted probabilities are systematically approximately twice the observed prevalence, reflecting shrinkage of the intercept by a regularization penalty applied to the bias term; discrimination is unaffected but the outputs should not be read as calibrated risks without refitting. The clinical indications for the chest radiographs determine whether these examinations were genuinely independent of the breast imaging pathway, and where indications are unavailable the possibility that some radiographs were obtained during a breast-related workup cannot be excluded. The feature encoder was pretrained on data from the same institution as the internal cohort, although patient-level partitioning is consistent between pretraining and evaluation, so the reported validation sets were unseen during pretraining. Discrimination was moderate throughout, and the comparison against clinical baselines shows that most of it is recoverable from recorded comorbidities alone. The new-onset breast cancer analysis is underpowered rather than negative, with 4 and 14 events. Finally, data came from two centers in a single country, and performance may vary across populations, imaging protocols, and reporting practices. The inference-stage embeddings for the validation cohorts were not retained, so the probe could not be refitted and re-evaluated on those cohorts; the hyperparameters reported were recovered by refitting on the development set and verified against the original model on the tuning set. Recorded comorbidity prevalence in these cohorts departs from population expectations for hypertension in particular, at 2.8% and 4.0% in women of mean age 54, which is lower than diabetes mellitus and an order of magnitude below what would be anticipated. This most likely reflects the diagnostic coding used for ascertainment rather than true prevalence. The clinical baseline model should therefore be regarded as a lower bound on what routinely recorded variables can achieve: more complete comorbidity capture would be expected to raise its discrimination, and the comparison reported here is conservative with respect to the paper’s central claim.
Speculatively, and not as a finding of this study, results of this kind suggest a division of labor in which models perform large-scale pattern extraction across high-dimensional imaging data while investigators identify which of the resulting signals are biologically meaningful50. No comparison between model-derived and human-derived biomarkers was performed here, and this remains a hypothesis for future work rather than a conclusion.
Conclusion
This study demonstrates that embeddings from routinely acquired chest radiographs discriminate women who receive a subsequent suspicious breast imaging assessment from those who do not, with AUC near 0.60 in an academic and a community cohort, and that a clinical baseline of age and nine recorded comorbidities achieves the same discrimination. Age alone discriminates at chance, and discrimination is unchanged when age is held constant within bands. The imaging signal is nonetheless not a frailty proxy: although model output is strongly associated with all-cause mortality, removing the mortality axis costs less than 0.01 in AUC. Combining imaging with clinical variables improves on either alone, by +0.037 internally and +0.044 externally, both p < 0.001, indicating a small and reproducible independent imaging contribution whose anatomical origin remains unestablished. That increment, and not the raw discrimination, is the finding of this study. It does not support use of chest radiographs as a breast cancer pre-screening tool, and locating its source would require occlusion analysis in a cohort where the source images remain available.
References
- H. Sung, J. Ferlay, R. L. Siegel, M. Laversanne, I. Soerjomataram, A. Jemal, F. Bray. Global cancer statistics 2020: GLOBOCAN estimates of incidence and mortality worldwide for 36 cancers in 185 countries. CA Cancer J Clin. 2021;71:209–249. https://doi.org/10.3322/caac.21660 [↩]
- W. K. Nicholson, M. Silverstein, J. B. Wong, et al. Screening for breast cancer: US Preventive Services Task Force recommendation statement. JAMA. 2024;331:1918–1930. https://doi.org/10.1001/jama.2024.5534 [↩]
- H. D. Nelson, R. Fu, A. Cantor, M. Pappas, M. Daeges, L. Humphrey. Effectiveness of breast cancer screening: systematic review and meta-analysis to update the 2009 U.S. Preventive Services Task Force recommendation. Ann Intern Med. 2016;164:244–255. https://doi.org/10.7326/M15-0969 [↩] [↩]
- M. Broeders, S. Moss, L. Nyström, et al. The impact of mammographic screening on breast cancer mortality in Europe: a review of observational studies. J Med Screen. 2012;19(Suppl 1):14–25. [↩]
- P. Whelehan, A. Evans, M. Wells, S. MacGillivray. The effect of mammography pain on repeat participation in breast cancer screening: a systematic review. The Breast. 2013;22(4):389–394. [↩]
- M. A. Abu-Helalah, H. A. Alshraideh, A. A. Al-Serhan, M. Kawaleet, A. I. Nesheiwat. Knowledge, barriers and attitudes towards breast cancer mammography screening in Jordan. Asian Pac J Cancer Prev. 2015;16(9):3981–3990. [↩]
- H. I. Almohammed. Breaking barriers: improving mammography screening accessibility and quality of care for breast cancer women with disabilities in Saudi Arabia. Front Oncol. 2024;14:1398061. [↩]
- O. Mandrik, O. I. Ekwunife, F. Meheus, et al. Systematic reviews as a “lens of evidence”: determinants of cost-effectiveness of breast cancer screening. Cancer Med. 2019;8:7846–7858. https://doi.org/10.1002/cam4.2498 [↩]
- D. L. Monticciolo, M. S. Newell, L. Moy, B. Niell, B. Monsees, E. A. Sickles. Breast cancer screening in women at higher-than-average risk: recommendations from the ACR. J Am Coll Radiol. 2018;15:408–414. https://doi.org/10.1016/j.jacr.2017.11.034 [↩]
- N. Pashayan, A. C. Antoniou, U. Ivanus, et al. Personalized early detection and prevention of breast cancer: ENVISION consensus statement. Nat Rev Clin Oncol. 2020;17:687–705. https://doi.org/10.1038/s41571-020-0388-9 [↩]
- A. Yala, C. Lehman, T. Schuster, T. Portnoi, R. Barzilay. A deep learning mammography-based model for improved breast cancer risk prediction. Radiology. 2019;292(1):60–66. [↩]
- A. Yala, P. G. Mikhael, F. Strand, et al. Toward robust mammography-based models for breast cancer risk. Sci Transl Med. 2021;13(578):eaba4373. [↩]
- K. Dembrower, Y. Liu, H. Azizpour, et al. Comparison of a deep learning risk score and standard mammographic density score for breast cancer risk prediction. Radiology. 2020;294(2):265–272. [↩]
- S. M. McKinney, M. Sieniek, V. Godbole, et al. International evaluation of an AI system for breast cancer screening. Nature. 2020;577(7788):89–94. [↩]
- K. Lång, V. Josefsson, A. M. Larsson, et al. Artificial intelligence-supported screen reading versus standard double reading in the Mammography Screening with Artificial Intelligence trial (MASAI): a clinical safety analysis. Lancet Oncol. 2023;24(8):936–944. [↩]
- M. T. Lu, A. Ivanov, T. Mayrhofer, A. Hosny, H. J. W. L. Aerts, U. Hoffmann. Deep learning to assess long-term mortality from chest radiographs. JAMA Netw Open. 2019;2(7):e197416. https://doi.org/10.1001/jamanetworkopen.2019.7416 [↩] [↩] [↩]
- R. Smith-Bindman, M. L. Kwan, E. C. Marlow, et al. Trends in use of medical imaging in US health care systems and in Ontario, Canada, 2000–2016. JAMA. 2019;322:843–856. https://doi.org/10.1001/jama.2019.11456 [↩]
- R. Poplin, A. V. Varadarajan, K. Blumer, et al. Prediction of cardiovascular risk factors from retinal fundus photographs via deep learning. Nat Biomed Eng. 2018;2:158–164. https://doi.org/10.1038/s41551-018-0195-0 [↩]
- Z. I. Attia, S. Kapa, F. Lopez-Jimenez, et al. Screening for cardiac contractile dysfunction using an artificial intelligence–enabled electrocardiogram. Nat Med. 2019;25:70–74. https://doi.org/10.1038/s41591-018-0240-2 [↩]
- J. Weiss, V. K. Raghu, D. Bontempi, D. C. Christiani, R. H. Mak, M. T. Lu, H. J. W. L. Aerts. Deep learning to estimate lung disease mortality from chest radiographs. Nat Commun. 2023;14(1):2797. https://doi.org/10.1038/s41467-023-37758-5 [↩] [↩]
- J. Weiss, V. K. Raghu, K. Paruchuri, A. Zinzuwadia, P. Natarajan, H. J. W. L. Aerts, M. T. Lu. Deep learning to estimate cardiovascular risk from chest radiographs: a risk prediction study. Ann Intern Med. 2024;177(4):409–417. https://doi.org/10.7326/M23-1898 [↩] [↩]
- M. T. Lu, V. K. Raghu, T. Mayrhofer, H. J. W. L. Aerts, U. Hoffmann. Deep learning using chest radiographs to identify high-risk smokers for lung cancer screening computed tomography: development and validation of a prediction model. Ann Intern Med. 2020;173(9):704–713. [↩]
- M. Kolossváry, V. K. Raghu, J. T. Nagurney, U. Hoffmann, M. T. Lu. Deep learning analysis of chest radiographs to triage patients with acute chest pain syndrome. Radiology. 2023;306(2):e221926. [↩]
- M. Jang, M. Kim, S. J. Bae, S. H. Lee, J. M. Koh, N. Kim. Opportunistic osteoporosis screening using chest radiographs with deep learning: development and external validation with a cohort dataset. J Bone Miner Res. 2022;37(2):369–377. [↩]
- J. H. Chen, S. Chan, N. H. Lu, Y. Li, Y. C. Tsai, P. Y. Huang, et al., M. Y. Su. Opportunistic breast density assessment in women receiving low-dose chest computed tomography screening. Acad Radiol. 2016;23(9):1154–1161. [↩]
- A. Radford, J. W. Kim, C. Hallacy, et al. Learning transferable visual models from natural language supervision. Proceedings of the 38th International Conference on Machine Learning (ICML), PMLR 139:8748–8763, 2021. [↩]
- E. Tiu, E. Talius, P. Patel, C. P. Langlotz, A. Y. Ng, P. Rajpurkar. Expert-level detection of pathologies from unannotated chest X-ray images via self-supervised learning. Nat Biomed Eng. 2022;6(12):1399–1406. https://doi.org/10.1038/s41551-022-00936-9 [↩]
- Z. Wang, Z. Wu, D. Agarwal, J. Sun. MedCLIP: contrastive learning from unpaired medical images and text. Proceedings of the 2022 Conference on Empirical Methods in Natural Language Processing (EMNLP), 2022. [↩]
- S. Zhang, Y. Xu, N. Usuyama, et al. BiomedCLIP: a multimodal biomedical foundation model pretrained from fifteen million scientific image-text pairs. arXiv:2303.00915, 2023. [↩]
- J. Irvin, P. Rajpurkar, M. Ko, et al. CheXpert: a large chest radiograph dataset with uncertainty labels and expert comparison. Proceedings of the AAAI Conference on Artificial Intelligence. 2019;33:590–597. [↩]
- X. Wang, Y. Peng, L. Lu, Z. Lu, M. Bagheri, R. M. Summers. ChestX-ray8: hospital-scale chest X-ray database and benchmarks on weakly-supervised classification and localization of common thorax diseases. Proceedings of the IEEE Conference on Computer Vision and Pattern Recognition (CVPR), 2017:2097–2106. [↩]
- S. Azizi, B. Mustafa, F. Ryan, et al. Big self-supervised models advance medical image classification. Proceedings of the IEEE/CVF International Conference on Computer Vision (ICCV), 2021:3478–3488. https://doi.org/10.1109/ICCV48922.2021.00346 [↩]
- R. Geirhos, J.-H. Jacobsen, C. Michaelis, R. Zemel, W. Brendel, M. Bethge, F. A. Wichmann. Shortcut learning in deep neural networks. Nat Mach Intell. 2020;2(11):665–673. [↩] [↩]
- A. J. DeGrave, J. D. Janizek, S.-I. Lee. AI for radiographic COVID-19 detection selects shortcuts over signal. Nat Mach Intell. 2021;3(7):610–619. https://doi.org/10.1038/s42256-021-00338-7 [↩] [↩] [↩] [↩]
- J. R. Zech, M. A. Badgeley, M. Liu, A. B. Costa, J. J. Titano, E. K. Oermann. Variable generalization performance of a deep learning model to detect pneumonia in chest radiographs: a cross-sectional study. PLoS Med. 2018;15:e1002683. [↩]
- J. W. Gichoya, I. Banerjee, A. R. Bhimireddy, et al. AI recognition of patient race in medical imaging: a modelling study. Lancet Digit Health. 2022;4:e406–e414. [↩] [↩]
- L. Oakden-Rayner, J. Dunnmon, G. Carneiro, C. Ré. Hidden stratification causes clinically meaningful failures in machine learning for medical imaging. Proceedings of the ACM Conference on Health, Inference, and Learning, 2020:151–159. [↩] [↩]
- L. Seyyed-Kalantari, G. Liu, M. McDermott, I. Y. Chen, M. Ghassemi. CheXclusion: fairness gaps in deep chest X-ray classifiers. Pac Symp Biocomput. 2021;26:232–243. [↩] [↩]
- C. Lin, K. C. Chen, J. W. Huang, W. H. Fang, W. C. Chang, K. H. Ko, Y. C. Hsu, C. S. Lin, S. H. Lin, D. J. Tsai. Transparent chest radiograph foundation model enables explainable human disease profiling. npj Digit Med. 2026;9:674. https://doi.org/10.1038/s41746-026-02990-y [↩] [↩] [↩]
- American College of Radiology. ACR BI-RADS atlas: breast imaging reporting and data system. 5th ed. American College of Radiology; 2013. [↩]
- M. Elezaby, G. Li, M. Bhargavan-Chatfield, E. S. Burnside, W. B. DeMartini. ACR BI-RADS assessment category 4 subdivisions in diagnostic mammography: utilization and outcomes in the National Mammography Database. Radiology. 2018;287(2):416–422. https://doi.org/10.1148/radiol.2017170770 [↩] [↩]
- K. C. Chen, M. Kuo, C. H. Lee, H. C. Liao, D. J. Tsai, S. A. Lin, et al., C. Lin. A pretraining approach for small-sample training employing radiographs (PASTER): a multimodal transformer trained by chest radiography and free-text reports. J Med Syst. 2025;49(1):120. https://doi.org/10.1007/s10916-025-02263-3 [↩] [↩]
- H. Zou, T. Hastie. Regularization and variable selection via the elastic net. J R Stat Soc Series B. 2005;67(2):301–320. [↩] [↩]
- E. R. DeLong, D. M. DeLong, D. L. Clarke-Pearson. Comparing the areas under two or more correlated receiver operating characteristic curves: a nonparametric approach. Biometrics. 1988;44(3):837–845. [↩]
- B. Van Calster, D. J. McLernon, M. van Smeden, L. Wynants, E. W. Steyerberg. Calibration: the Achilles heel of predictive analytics. BMC Med. 2019;17:230. [↩]
- A. J. Vickers, E. B. Elkin. Decision curve analysis: a novel method for evaluating prediction models. Med Decis Making. 2006;26(6):565–574. [↩]
- F. E. Harrell Jr, R. M. Califf, D. B. Pryor, K. L. Lee, R. A. Rosati. Evaluating the yield of medical tests. JAMA. 1982;247:2543–2546. https://doi.org/10.1001/jama.1982.03320430047030 [↩]
- P. M. Grambsch, T. M. Therneau. Proportional hazards tests and diagnostics based on weighted residuals. Biometrika. 1994;81(3):515–526. [↩]
- G. S. Collins, K. G. M. Moons, P. Dhiman, et al. TRIPOD+AI statement: updated guidance for reporting clinical prediction models that use regression or machine learning methods. BMJ. 2024;385:e078378. [↩]
- E. J. Topol. High-performance medicine: the convergence of human and artificial intelligence. Nat Med. 2019;25:44–56. https://doi.org/10.1038/s41591-018-0300-7 [↩]