Abstract
In this research, I explore whether genres with higher AI compatibility have different production and success patterns in the music industry. AI tools became more widely available in the music industry around 2020, and scholars have raised questions about whether AI tools improve music production quality, increase diversity, and raise the likelihood of producing hit songs. I collected Spotify data, which covered ~500,000 tracks between 2018 and 2024, as well as the weekly chart data from the Billboard Hot 100 from the same time period. I created a genre-level AI compatibility framework to differentiate between the AI compatibility of each genre. I utilize this framework to analyze patterns in genres with varying levels of AI compatibility. Descriptive statistics showed that the average song popularity has not increased from the adoption of AI tools in the music industry after 2020. The panel regression outcomes suggested that genres with higher AI compatibility are slightly more likely to produce hit songs. Shannon entropy scores rose across the study period and stayed elevated, suggesting that music production became more diversified. However, there is little evidence that established artists expanded into new genres. Instead, the diversification seems to be mainly due to new artists. The Billboard Hot 100 data showed that although top songs were still dominated by a small number of established artists, more musicians appeared in the charts after 2020.
Keywords: Generative AI, music industry, genre mix, creative production
Introduction
Background
Generative AI has changed creative industries, as it lowers production costs and allows for more access to creative tools. Specifically, in the music industry, AI tools assist with beat generation, melody composition, lyric writing, and audio processing. These used to require professional skills or expensive resources, but now AI tools can do these tasks. Digital technologies have changed how commercial success is distributed among songs and artists1.
Although technological advancement usually increases participation, commercial success is still concentrated in the music industry. Artists can reach large audiences at a low marginal cost through technology, so a small number of artists can get disproportionate recognition2. As AI tools, such as OpenAI’s Jukebox (2020), Boomy (2021), and Suno AI (2023), become more widely available, it is difficult to determine in which direction AI affects the music industry. AI could create opportunities for new artists to enter the music industry, but it could also lead established artists to focus on AI-compatible genres. This difference is significant because only a small amount of music produced is actually well-known.
Significance and Purpose
In this paper, I introduce an AI Compatibility Measurement Framework in which I use two dimensions to measure AI compatibility: substitution risk and complementarity potential. I utilize this framework to analyze patterns in genres with varying levels of AI compatibility. I examine how changes in creative activity affect commercial success by combining the Spotify and Billboard datasets. As this study helps explain how AI impacts market participation, industry diversity, as well as concentration of success, it can be useful for both artists and policymakers.
Methodology Overview
Approximately 500,000 Spotify tracks between 2018 and 2024 are combined with the Billboard Hot 100 chart data for the same period. I created a genre-level AI Compatibility Measurement Framework assisted by ChatGPT-4o, and the scores from the framework are fed into the analysis: panel regressions, entropy-based diversity measures, and non-parametric smoothing. The following sections contain my full methods.
Literature Review
This paper connects four areas of research: AI-assisted music production, AI and music industry structure, task-based automation, and platform economics and digitization.
Generative AI tools have evolved, moving from being experimental to becoming a part of professional workflows. Studies document that AI is used across pop genres, in mixing, mastering, and composition3. These AI models can produce stylistically coherent, high-fidelity content at scale4,5,6. Thus, the commercialization of music AI has created a copyright question about who is owed anything when AI models train on a shared musical commons7.
AI tools can lower production costs and change how profits are distributed8. Recommendation systems based on AI can help established artists gain larger audiences9. A network analysis on genre influence shows that how successful an artist is in blending different genres and reaching different audiences is dependent on their network position10. How the audience accepts AI-assisted music is dependent partially on how authentic it seems11.
The substitution subfactors in this paper’s framework were informed by research that established that technology substitutes for routine, rule-based tasks while complementing non-routine ones12. Later work estimated how likely each occupation is to be computerized13 and identified which task features make a job suitable for machine learning14. Automation changes who enters creative markets as it can remove work, but it can also create new work15,16.
Streaming platforms promote scale and established artists, though their efficiency gains rarely seem to reach most creators17. Even though digitization expanded the variety of content available and benefited the consumers, the income gain of individual creators stayed limited and unequal in distribution18,19. Algorithm-based listening decreases the diversity of content consumed by an individual20 because through their algorithms, platforms filter what individuals listen to21. Recommendation systems boost what already is popular rather than increasing exposure22,23, so more stylistic variety does not mean more commercial success.
I connect these areas in my paper by analyzing how AI compatibility relates to creative production patterns and how commercial recognition is distributed across Spotify and Billboard data.
Methodology
Research Design
To examine whether there were differences in patterns of creative production and commercial success for genres with higher AI compatibility, I used a quantitative, observational methodology. The two main data sources used are the approximately 500,000 tracks data from Spotify between 2018 and 2024, and the Billboard Hot 100 monthly chart data for the same period.
This study constructed an AI Compatibility Measurement Framework and combined descriptive statistics, trend analysis, and difference-in-differences models.
This is an entirely observational study. I constructed the AI compatibility measurement framework instead of using an external source. The difference-in-differences framework controls for genre and time fixed effects, but it does not establish exogenous variation in AI compatibility. All results describe a correlation, not a cause.
Data Collection
I used my Python script to query Spotify data from the Spotify Web API. Genres are used in the data query as filter parameters because the Spotify Web API does not return genres at the track level. Once the output was produced, I standardized the date format, removed duplicate records, and ensured consistency in genres for each year.
Because Spotify does not publish a canonical genre list and does not return genres at the track level, genres have to be selected before querying the data. I selected 100 genres from Every Noise at Once (everynoise.com) because this is the only publicly available genre list for Spotify data. I purposely chose the initial list of genres to range across the AI compatibility scale, using my knowledge of the music production process and cultural factors in the genres. I then scored each of the genres using the AI Compatibility Measurement Framework. This initial list was subjective, and I treat it that way. Once the list was prepared, I also checked that the data pulled from the Spotify Web API did not return an empty genre field.
Given the size of the Spotify data, it was not possible to pull an exhaustive dataset at track and genre level. Therefore, I limited the number of tracks per genre to 1,000. The limit is also used to ensure larger and more popular genres do not skew the results and the sample data stays balanced across genres and years.
Tracks within each genre were obtained from the Spotify Web API by making requests using query terms for each genre, limited to a maximum of 1,000 tracks per genre by paging in chunks of 50 tracks at a time. Since the Spotify Web API does not release its exact method of sampling, the dataset cannot be assumed to be drawn randomly. Therefore, it should be considered a large sample of tracks for the given period stratified by genre instead of a probability sample of all music released during that period. Though the dataset cannot represent all releases, it still provides a significant view of patterns in genre diversity and production output.
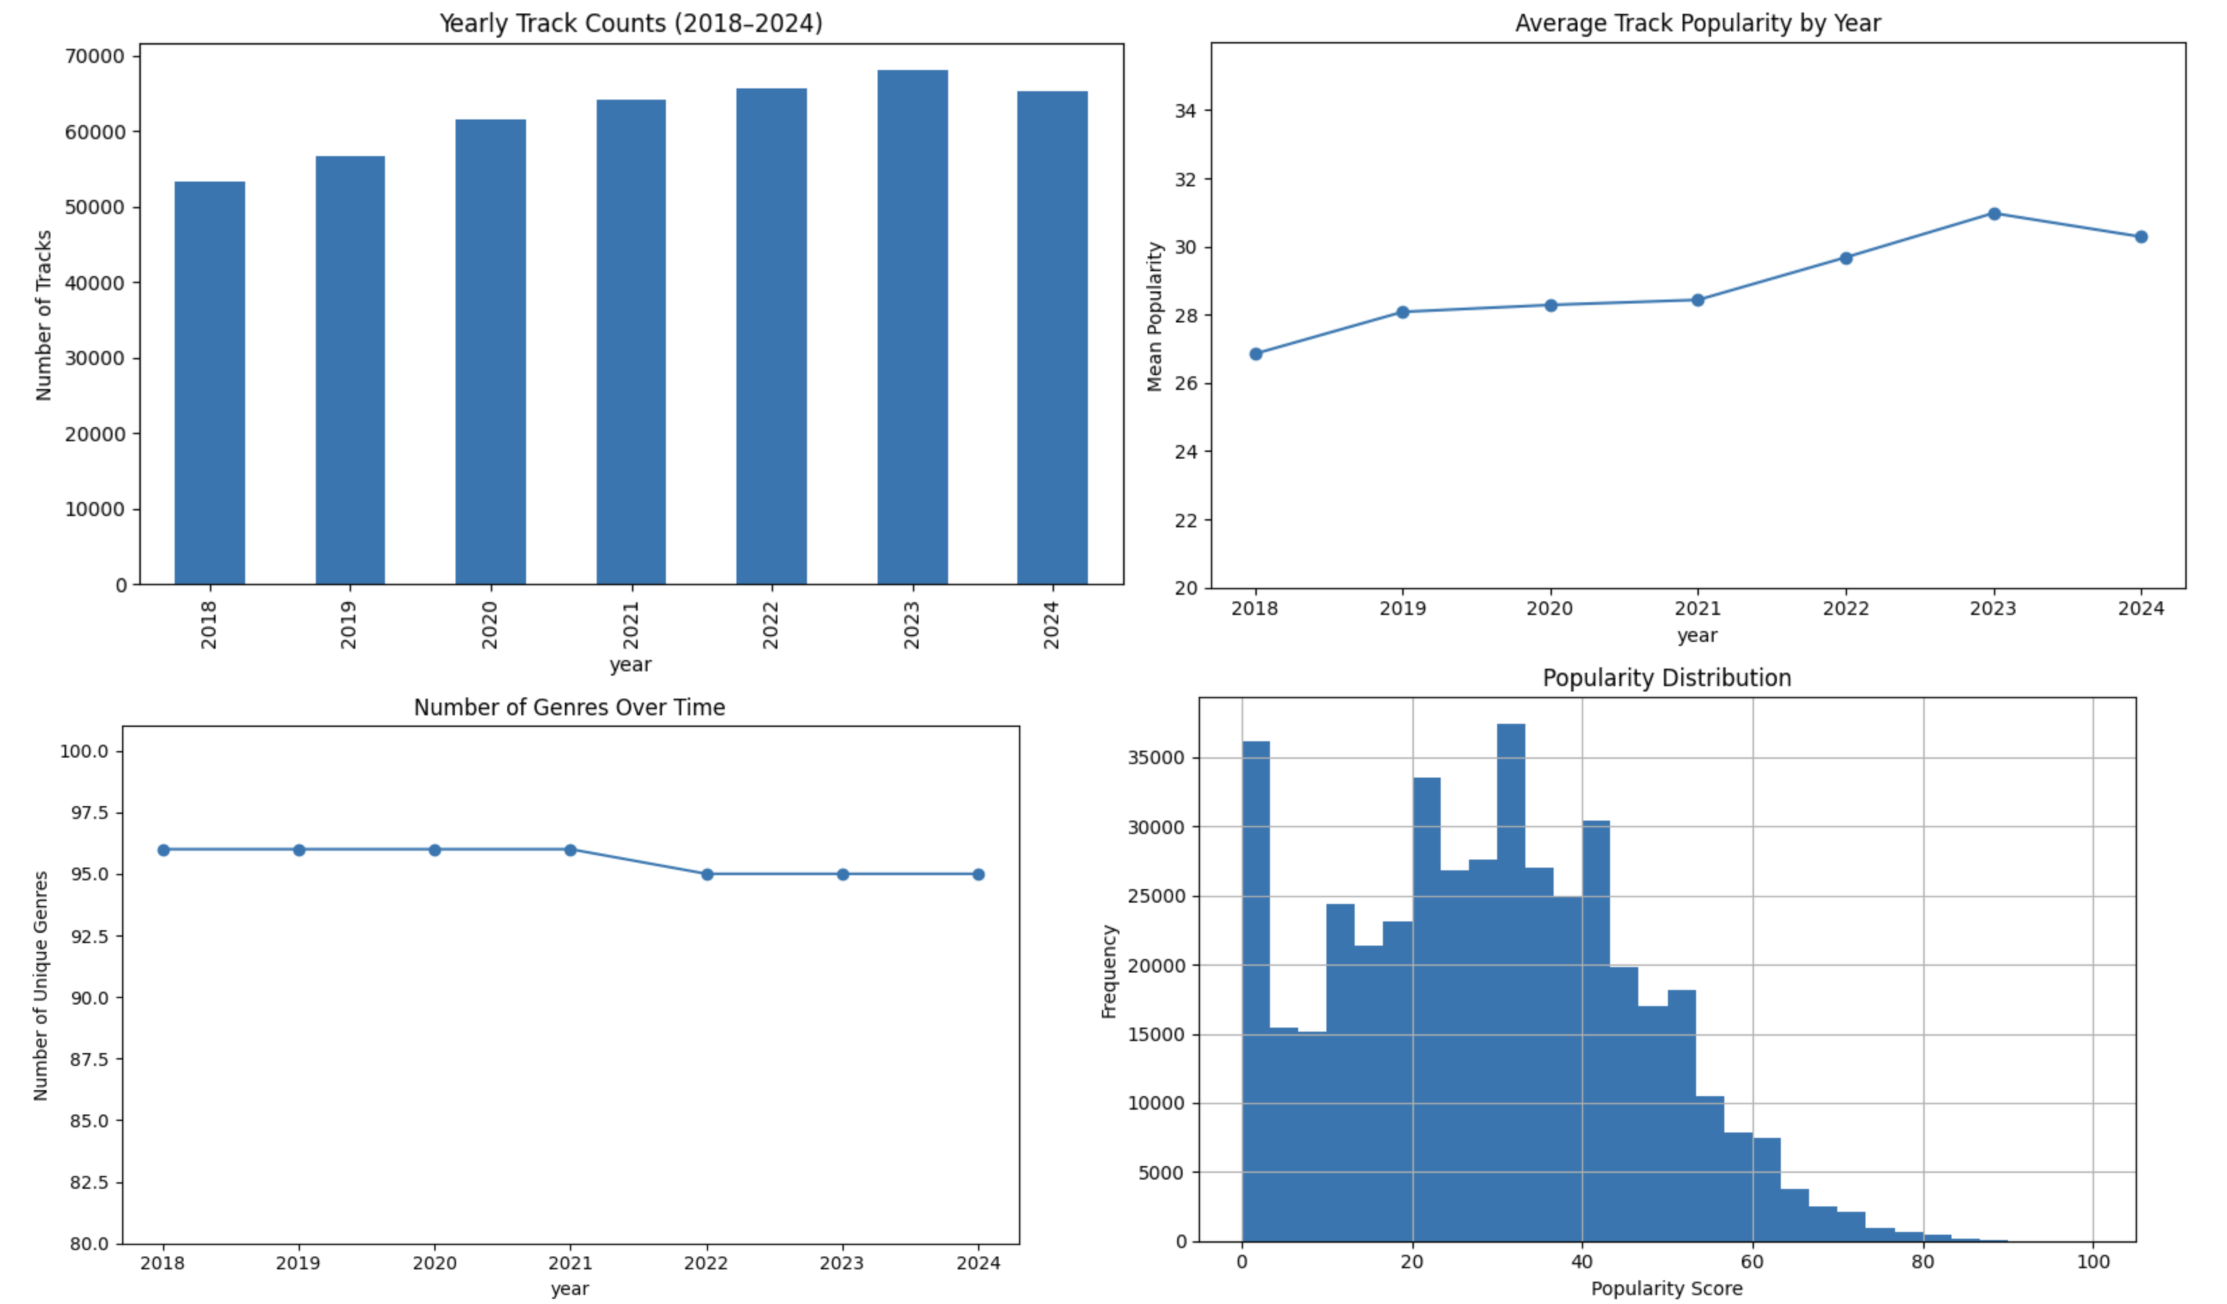
Figure 1 shows a descriptive statistical analysis of the Spotify data I collected. The top left and bottom left charts show that the track counts and number of genres stayed relatively stable across the time horizon. Those charts show that the data was pulled as intended. The top right chart shows that the average track popularity slightly increased in the past few years. The bottom right chart shows that the population distribution by popularity is heavily right-skewed. This is consistent with the nature of the music industry, where success is highly concentrated in a small group.
In addition to the Spotify data, I collected the Billboard Hot 100 weekly data using my own Python script. The data includes rank, song title, artist name, and chart-trajectory measures. The weekly data was then aggregated to the monthly level. I obtained lyricist data for each track using ChatGPT-3.5 Turbo to look up the songwriters from public sources online. During the lyricist retrieval process, I ensured that the AI model was searching online instead of generating results from its memory to avoid hallucination risk. I then merged the lyricist data with the Billboard chart data at the track level. I standardized the name format, fixed other formatting issues, and removed duplicate records. To verify the model’s accuracy, I selected a random sample of two songs per year from 2018 to 2023 and from ranks 1–10, 11–50, and 51–100 for a total of 36 songs. I then checked the model results against verified external sources. Out of the 36 songs, 34 (94.4%) were fully correct. One error was missing a minor co-writer, and one error returned “Unknown” for one of the lyricists’ names. The model did not hallucinate any names. Therefore, the Gini Index estimates are conservative since the only error was undercounting and not false information. The decrease in songwriter concentration after 2020 is likely more than what I found.
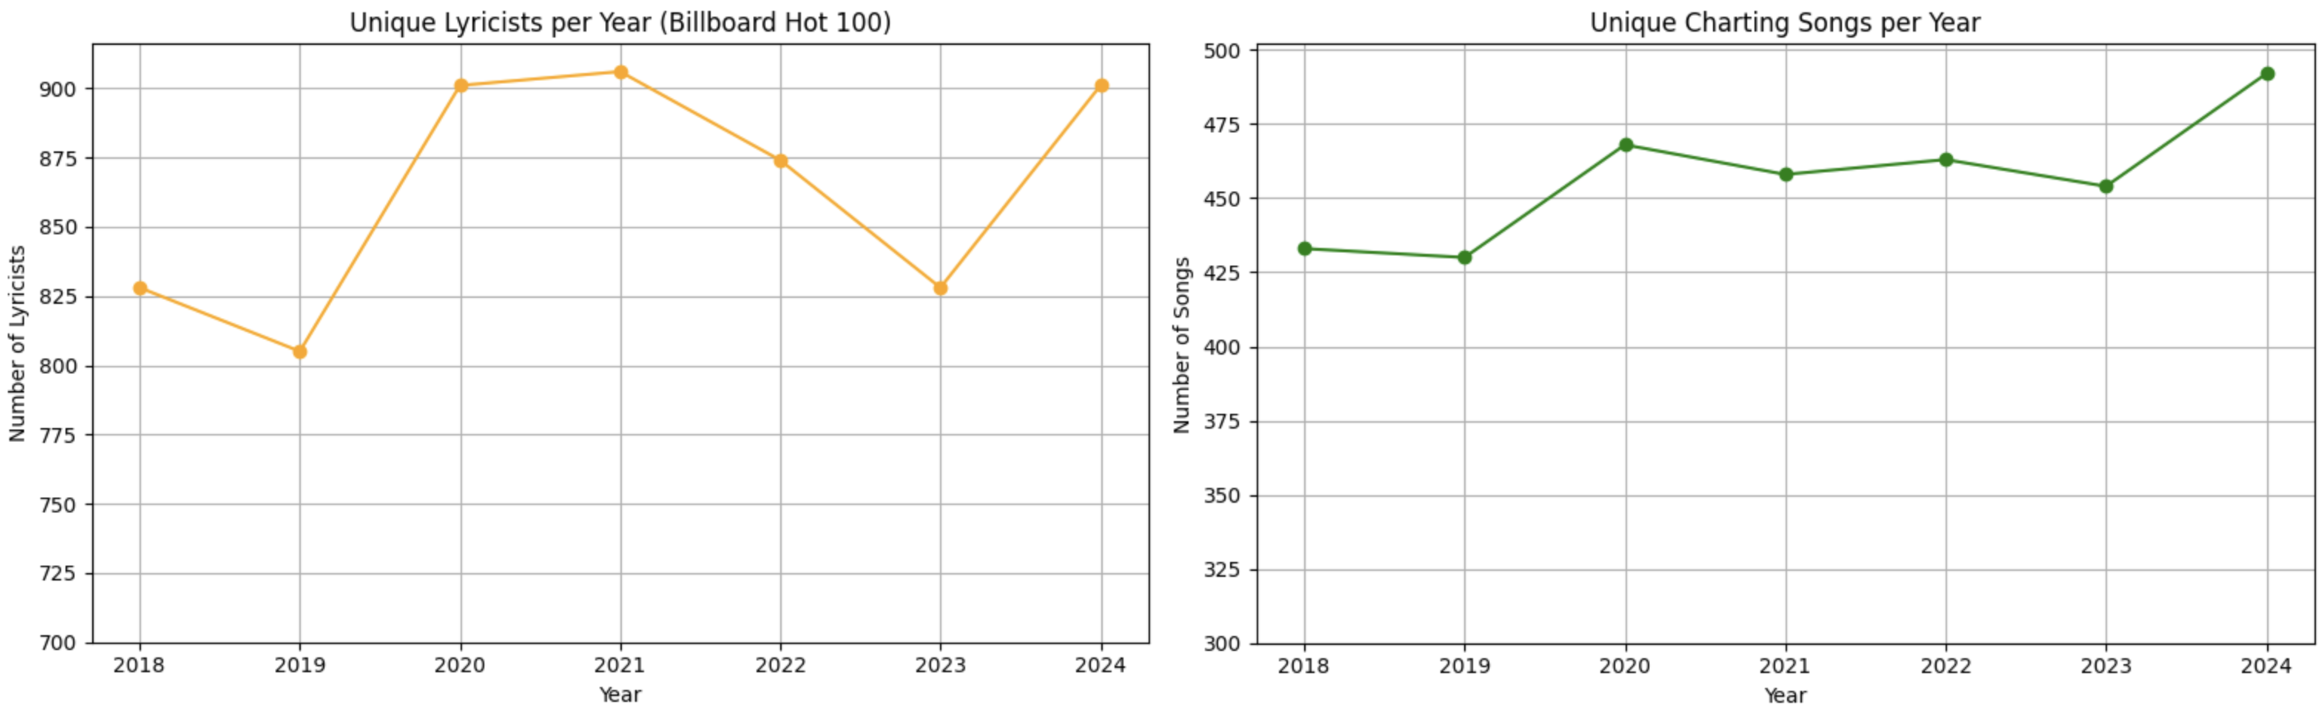
Figure 2 shows that the number of contributors is increasing. Unique lyricists range from approximately 800 to 900 per year, and unique charting songs increase from a little over 400 to close to 500 each year.
Variables and Measurements
AI Compatibility Measurement
I constructed an AI Compatibility Measurement Framework to differentiate how each genre is affected by AI tools. The framework used two dimensions to produce the genre-level AI compatibility index. The Substitution Index (SI) is used to measure the extent to which AI can replace human creativity. The Complementarity Index (CI) is used to measure the extent to which AI can help improve human creativity and productivity. The final AI compatibility index is the average of these two indices.
Scores at the genre level are generated from the evaluation of a large language model (ChatGPT-4o) based on my rubric that considers typical production workflows, stylistic conventions, and mainstream listener acceptance.
I score substitution risk on eight subfactors: task standardization (S1), how digital the production process already is (S2), whether AI-generated vocals are feasible (S3), how much genre-specific training data exists (S4), reliance on objective quality criteria (S5), independence from live physical performance (S6), cultural or identity specificity (S7), and market or legal acceptance of AI outputs (S8). I score complementarity potential on six subfactors: usefulness for generating new ideas (C1), production efficiency (C2), accessibility for less-skilled creators (C3), room for creative exploration (C4), support for artist branding (C5), and how modular the workflow is (C6).
I score each of the subfactors on a 1–10 scale, with evidence-based justifications on genre-specific production practices, vocal norms, cultural embeddedness, and data availability. The subfactor scores are then aggregated into the substitution index (SI) and complementarity index (CI) measures using equal weights, since there is no previously established weighting mechanism. The SI and CI both range from 1–10 across all genres.
I computed pairwise correlations across five runs to evaluate the reliability of the LLM scores, finding that the average Pearson correlation was 0.968 for the substitution index and 0.941 for the complementarity index. The average standard deviation in the scores was approximately 0.20 for the substitution index and 0.19 for the complementarity index. Therefore, the results suggest that the model produces reliable and reproducible scores, not just scores that are the result of random model variation. However, to check if scores are specific to a model, I also evaluated the scores using a second LLM, Claude Sonnet 4.6 by Anthropic. I provided the same scoring rubric across all 100 genres over five runs. Substitution scores were consistent across both models, with a Pearson correlation of 0.92 (p < 0.001) between the ChatGPT-4o and Claude score sets. The rank-order agreement (Kendall’s τ = 0.72) confirmed that the evaluation model did not control what scores the genres got. Complementarity scores were less consistent across the models, with an average Pearson correlation of 0.55 and Kendall’s τ = 0.36, and the two models only placing 60 of 100 genres in the same group. Thus, the substitution axis is shown to be reliable, while I acknowledge the less consistent complementarity axis as a limitation.
In addition, Goldmedia conducted an industry survey on behalf of GEMA and SACEM (2024) to measure AI adoption rates across music genres among 15,073 professional creators24. Electronic music and hip-hop had the highest adoption rates, at 54% and 53%, respectively, while jazz and blues were at 33%, and folk and world music at 30%. These adoption rates fit the model’s scores as well: EDM and house receive the highest AI compatibility scores, hip-hop and rap are close behind, and culturally specific genres such as corrido, lagu jawa, and country have the lowest scores. Even though the adoption rates are self-reported, the correlation still provides some external validation of the model’s scores.
Subfactor Selection
I referenced previous research along with my domain knowledge in music genres to select the subfactors within the SI and CI. Autor, Levy, and Murnane (2003)12 introduced a task-based framework for computerization, substituting for routine tasks and complementing non-routine tasks. I considered several of my SI subfactors based on this distinction. My AI compatibility scoring approach references Brynjolfsson and Mitchell (2017)14, as they scored tasks that are suitable for machine learning against their rubric. Felten, Raj, and Seamans (2021)25 inspired my genre-level approach, as they mapped AI capabilities to task requirements across occupations. I referenced the framework and methodology from existing research, and my domain knowledge as a trained pianist influenced some subfactors in my AI compatibility framework. This creates some subjectivity that I mention in the Limitations section.
Equal Weighting: Justification and Sensitivity Analysis
I aggregated the subfactor scores using equal weights because no peer-reviewed framework offers empirically grounded weights in this setting. Equal weighting makes the fewest assumptions of any option, the same reasoning behind the UN Human Development Index.
To test whether different weighting would change the results, I recalculated the scores using three alternative methods. The first emphasizes production technology factors, weighting workflow digitization and data abundance more. The second emphasizes cultural barrier factors, weighting embodiment dependence and cultural specificity more. The third emphasizes market acceptance factors, weighting vocal synthesis feasibility and legal or market acceptance more. Comparing the equal-weight baseline with each alternative, Spearman rank correlations are greater than 0.996 on the composite score (all p < 0.001). The mean per-genre score difference is at most 0.44 points on the 1–10 scale, and only between 1% and 7% of genres switched between high- and low-compatibility groups. Rankings and groups are consistent across all the methods, so equal weighting is not the main factor impacting the results. However, because equal weighting is an assumption I chose and is not backed by data, I acknowledge it as a limitation.
Billboard Variables and Lyricist Measures
The Billboard Hot 100 dataset covers all songs in the Billboard Hot 100 charts from 2018 to 2024, including the rank, song title, artist name, and date. It is aggregated to the monthly level and combined with lyricist credit data that was retrieved using ChatGPT-3.5 Turbo. I constructed monthly measures of songwriter participation and concentration using the dataset, including the Herfindahl–Hirschman Index (HHI) and Gini Index.
Data Analysis
I analyzed the data in three ways: descriptive statistics, non-parametric exploratory methods, and panel regressions. All of the analysis was done using Python scripts.
Descriptive Pre-Post Analysis of AI Compatibility
I conducted a descriptive pre-post analysis using the Spotify data from 2018 to 2024 to evaluate whether genre characteristics related to generative AI compatibility changed over time. I compared the average values of the SI and CI before and after 2020 because 2020 acts as a reference point for AI music tools to become more accessible to the public.
I evaluated the mean difference between the pre-2020 and post-2020 periods using two-sample t-tests. I calculate the test statistic t as:
![\[\mathrm{t = \frac{X_{post} - X_{pre}}{\sqrt{\frac{s^2_{post}}{n_{post}}+ \frac{s^2_{pre}}{n_{pre}}}}}\]](https://nhsjs.com/wp-content/ql-cache/quicklatex.com-249c7b1c72a30ad337d4d824f023b6c1_l3.png "Rendered by QuickLaTeX.com")
where X is the sample mean, s2 is the sample variance, and n is the number of observations in each period.
To evaluate statistical significance, I calculated p-values. I used conventional standards where p-values less than 0.05 represent strong significance, p-values between 0.05 and 0.10 are slightly significant, and p-values above 0.10 are not significant.
LOWESS Analysis of AI Compatibility and Popularity
I apply a locally weighted scatterplot smoothing (LOWESS) method to explore the relationship between AI compatibility and song popularity at the track level. Each song is assigned a composite AI compatibility score, defined as:
![\[\mathrm{AICompatibility_g = \frac{SI_g + CI_g}{2}}\]](https://nhsjs.com/wp-content/ql-cache/quicklatex.com-7d186523743042e18efe4ef08bed0ab8_l3.png "Rendered by QuickLaTeX.com")
where SIg and CIg are the substitution and complementarity indices for genre g. Song popularity is measured using Spotify’s standardized popularity score (0–100).
The LOWESS method provides us a smoothed estimate of the conditional mean of popularity using local regressions based on the distance in the exposure space. This method does not provide any coefficients, t-values, or p-values, and it is used solely to visualize potential nonlinear patterns between AI compatibility and popularity.
Descriptive Diversity Analysis Using Entropy Scores
I computed Shannon entropy scores based on Spotify genre distribution to evaluate changes in stylistic diversity over time. For each year t, genre shares are calculated as:
![\[\mathrm{p_{g,t} = \frac{tracks\ in\ genre\ g\ in\ year\ t}{total\ tracks\ in\ year\ t}}\]](https://nhsjs.com/wp-content/ql-cache/quicklatex.com-733c81620fbbf45b79c078da4adeb80f_l3.png "Rendered by QuickLaTeX.com")
The entropy score is then computed as:
![\[\mathrm{H_t} = -\sum_g p_{g,t}\ log(p_{g,t})\]](https://nhsjs.com/wp-content/ql-cache/quicklatex.com-9dbf117be3875e7e77fee08b02f14301_l3.png "Rendered by QuickLaTeX.com")
A higher entropy value means that there is a more balanced output distribution across genres. I compared the entropy scores across years to analyze how genre diversity changed over the study period. No hypothesis testing is involved.
Descriptive Diversity Analysis Using HHI and Gini Index
I conducted a descriptive diversity analysis using the Billboard Hot 100 dataset to examine how commercial recognition is distributed among songwriters. The chart rankings show the overall success, but do not show how evenly recognition is spread across songwriters. Therefore, I analyze the concentration of lyricist credits in the Top 100 over time, using the HHI and the Gini Index.
I calculate each lyricist’s share as their number of credits divided by the total lyricist credits during that period. The HHI is calculated as:
![\[\mathrm{HHI = \sum_{i=1}^N s^2_i}\]](https://nhsjs.com/wp-content/ql-cache/quicklatex.com-6b7bf914e68a6d63749f51e6dbad3e48_l3.png "Rendered by QuickLaTeX.com")
where si is the share of lyricist credits held by lyricist i. A higher HHI value means that there is more concentration among a smaller number of lyricists.
The HHI is mainly influenced by the largest shares. To analyze inequality across the full distribution, I calculate the Gini Index as:
![\[\mathrm{Gini = 1 - \sum_{i=1}^N (s_i + s_{i-1})(p_i - p_{i-1})}\]](https://nhsjs.com/wp-content/ql-cache/quicklatex.com-f8314e10d46b99cec00d168a1b0c328a_l3.png "Rendered by QuickLaTeX.com")
where lyricists are ordered by increasing share, si is the cumulative proportion of credits held by the first i lyricists, and pi is the cumulative proportion of lyricists. The Gini Index ranges from 0 to 1, with higher values meaning greater inequality.
The HHI and the Gini Index describe how much concentration and inequality are in lyricist participation in the Billboard Hot 100 over time.
Panel Regression and Difference-in-Differences Analysis
I run panel regressions using ordinary least squares (OLS) on genre-month data to estimate the relationship between AI compatibility and popularity outcomes. Each regression includes genre and month fixed effects, which absorb stable differences between genres and shocks that hit the whole industry in a given month.
The baseline regression is:
![\[\mathrm{Y_{g,t} = \alpha + \beta\ (AIExp_g \times Post_t) + \gamma_g + \delta_t + \varepsilon_{g,t}}\]](https://nhsjs.com/wp-content/ql-cache/quicklatex.com-45dda8581f2dceae3c4ed218eccbe526_l3.png "Rendered by QuickLaTeX.com")
where Yg,t represents the outcome of interest (average popularity or hit share), AIExpg is the genre-level AI compatibility, Postt is an indicator for the post-2020 period, Yg are genre fixed effects, and δt are time fixed effects.
I cluster standard errors at the genre level to account for serial correlation.
I use t-values and p-values to evaluate the statistical significance of the estimated coefficients, using the thresholds I described above.
Data and Code Availability
The data sources I used were all public: track data from the Spotify Web API and chart data from the Billboard Hot 100 website. I applied a scoring rubric to each genre through ChatGPT-4o to generate the genre-level AI compatibility scores, then checked them against a second model, Claude Sonnet 4.6. The Methods section describes the data collection, scoring, and analysis in enough detail to allow for reproduction.
Results
Compositional Change is Associated with Post-2020 Shifts in Genre Mix
Analysis shows that AI-related genre characteristics increase after 2020. This increase is mainly driven by new artists entering the industry, instead of established artists changing their behavior.
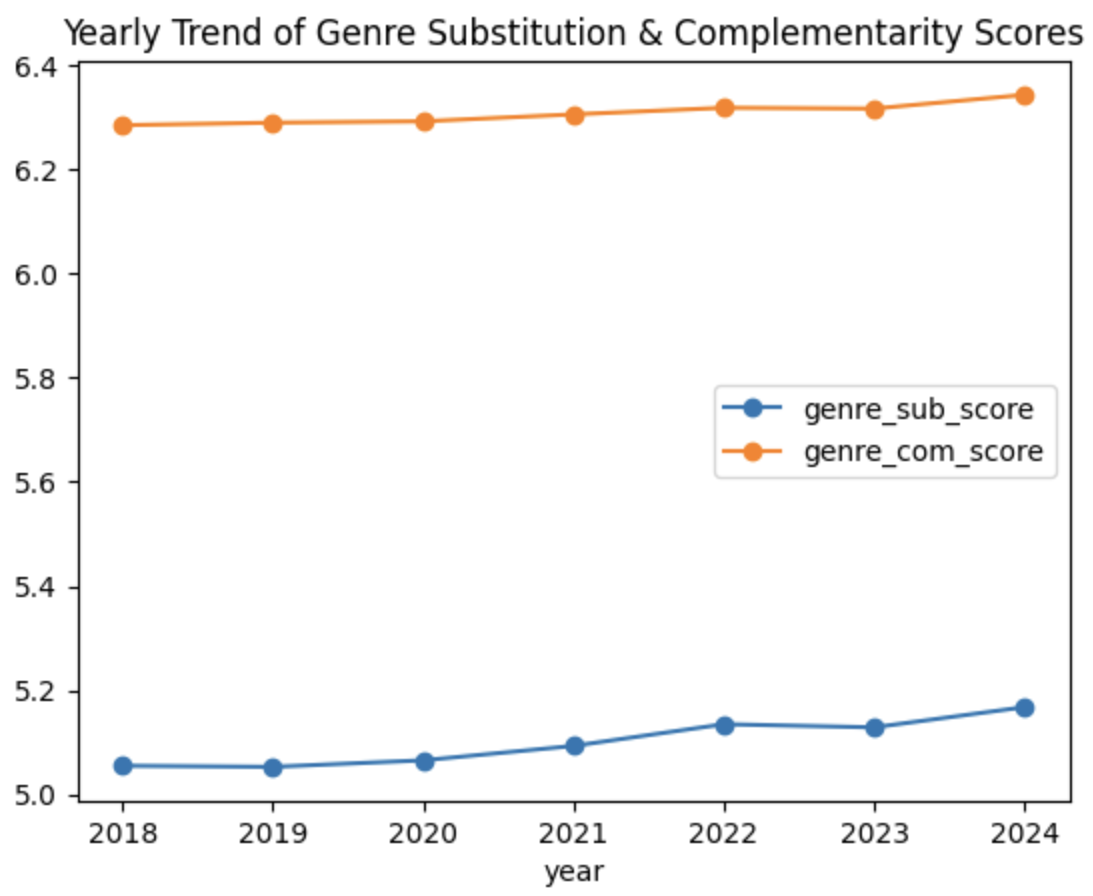
Figure 3 shows that both the substitution and complementarity average scores by genre increase at the aggregate level after 2020. The mean substitution index rose from 5.05 to 5.12 (t = -13.47, p < 0.001), while the mean complementarity index rose from 6.29 to 6.32 (t = -8.33, p < 0.001). Although these changes are small in magnitude with Cohen’s d ≈ 0.03–0.05, they are statistically significant. These changes suggest that releases after 2020 gradually shift toward more AI-compatible genres.
I then compare new and established artists to see whether their AI compatibility changes after 2020. Table 1 shows that compared to the established artists, new artists have higher average substitution scores (5.26 vs. 5.07; t = 30.46, p < 0.001) and higher complementarity scores (6.34 vs. 6.31; t = 8.22, p < 0.001). While the differences are not large (Cohen’s d ≈ 0.12 and 0.03, respectively), they are statistically significant. These data suggest that the overall increase towards AI-compatible genres is mostly driven by new artists instead of the established artists. This trend is consistent with how AI lowers the entry barrier for new artists, but also with genre growth trends from previous years. This observational data alone cannot determine how AI affected this shift.
| Cohort | Mean Substitution Score | SD | Mean Complementarity Score | SD | N |
| Established | 5.073 | 1.312 | 6.307 | 0.932 | 245,263 |
| New | 5.258 | 1.545 | 6.341 | 1.034 | 79,667 |
Notes: Two-sample t-tests comparing new vs. established artists post-2020. Substitution score: t = 30.46, p < 0.001. Complementarity score: t = 8.22, p < 0.001.
AI Does Not Raise Popularity in a Uniform Way
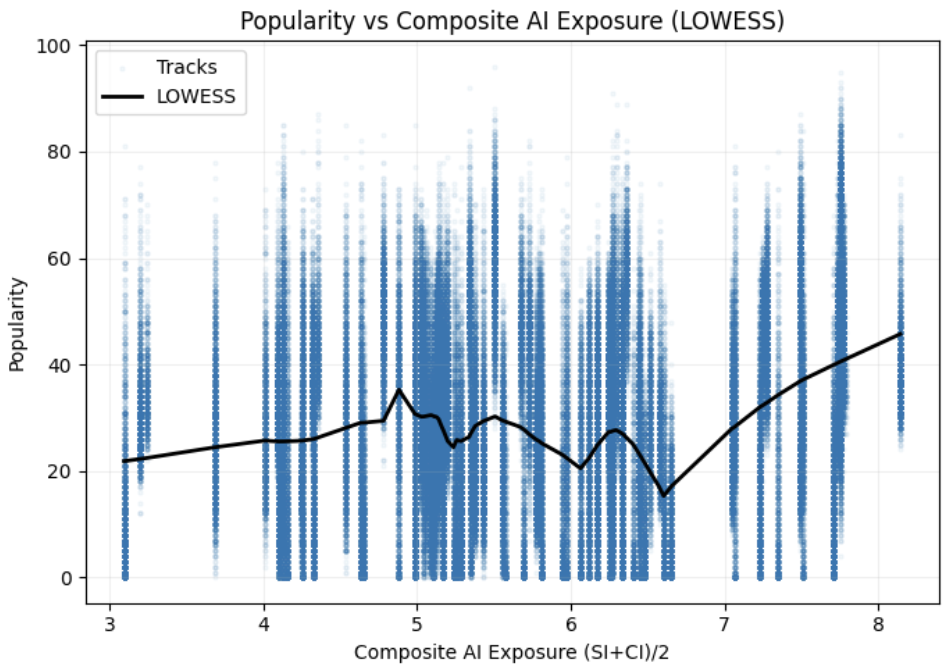
Figure 4 shows a track-level LOWESS analysis of song popularity on AI compatibility. Each blue point represents a Spotify track, with popularity on the y-axis and AI compatibility score on the x-axis. The black line represents the mean of the popularity score for a given AI compatibility score.
The black line shows that the relationship between AI compatibility and song popularity is nonlinear. It is not constant or positive throughout the entire graph, and it varies at different levels of AI compatibility. This is an exploratory visual, so it cannot be used to draw inferential conclusions. The pattern observed here is the reason for the following regression analysis, but no claims are drawn from it.
Genre Diversity Has Increased Since 2018 and Stabilized at an Elevated Level After 2020
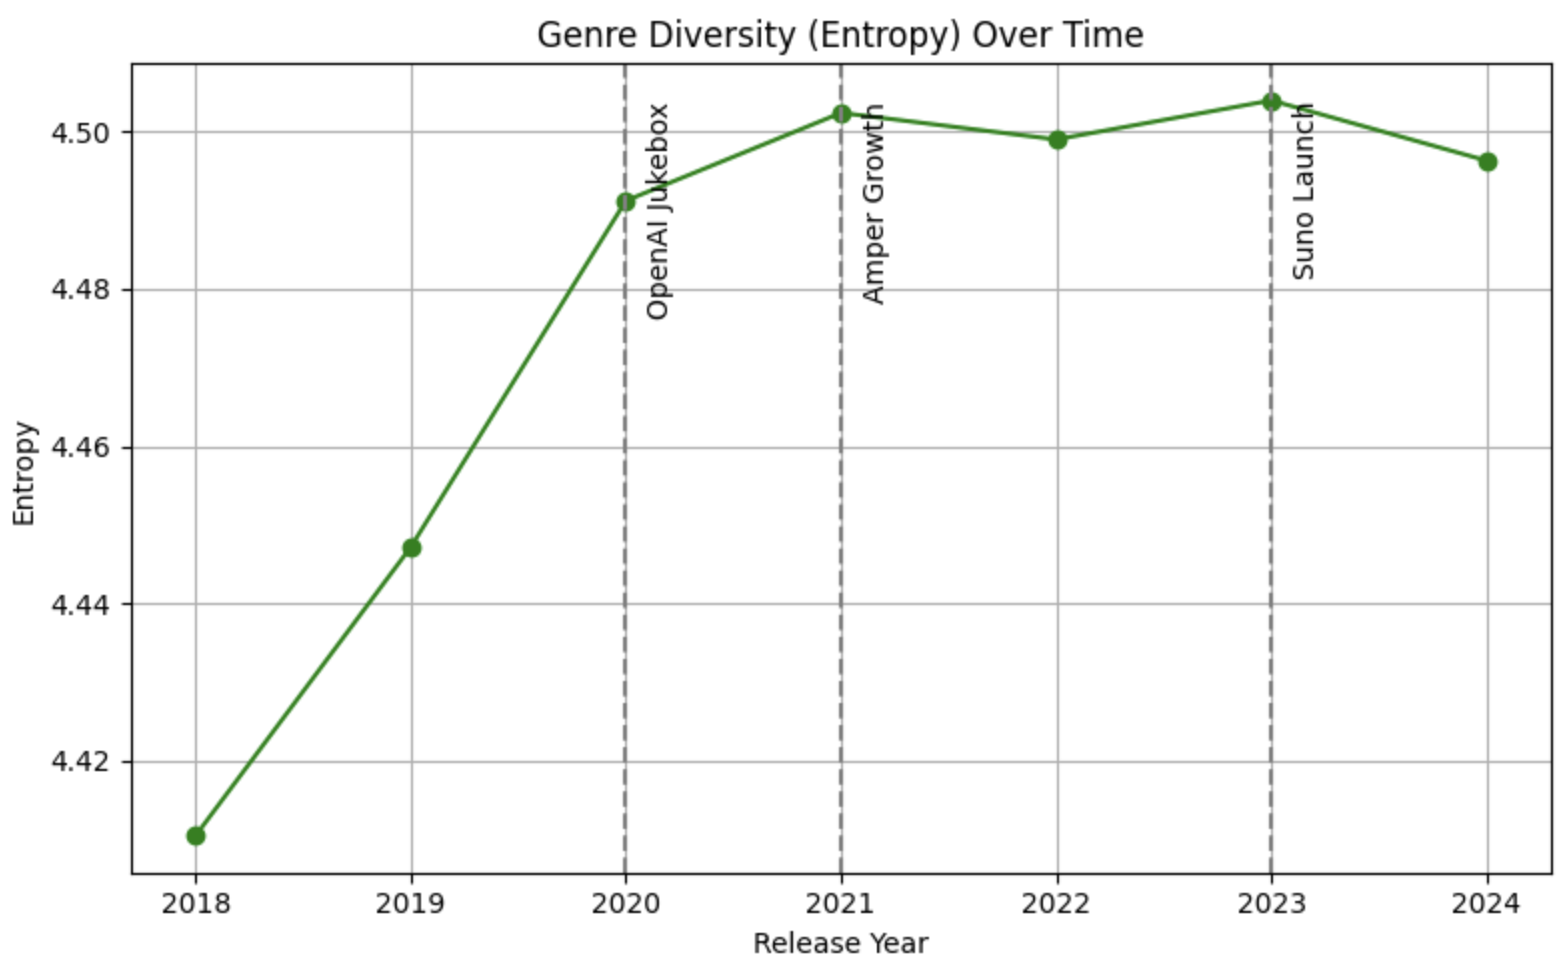
Figure 5 shows that Shannon entropy scores within the framework of genre distribution increase from 4.41 in 2018 to 4.49 in 2020. They stay relatively stable after that. AI tools, such as OpenAI’s Jukebox, Amper Music’s expansion, and Suno AI, were widely used after 2020 and correlate with the timeframe of these high entropy scores, but this correlation does not necessarily mean a causal relationship.
Billboard Hot 100 Showed More Equality Post-2020, Although the Top Figures Dominate
In order to explore how creative participation and concentration changed in the music industry, I analyzed lyricist data from the Billboard Hot 100 between 2018 and 2024. Spotify data shows industry-wide patterns in music production, while the Billboard data shows which songs achieved commercial success and how credits are distributed.
Figure 6 uses concentration and inequality in lyricist participation using three measures: the Herfindahl–Hirschman Index (HHI), the percentage of credits held by the lyricist who produced the most during the month (Top Lyricist Share), and the Gini Index.
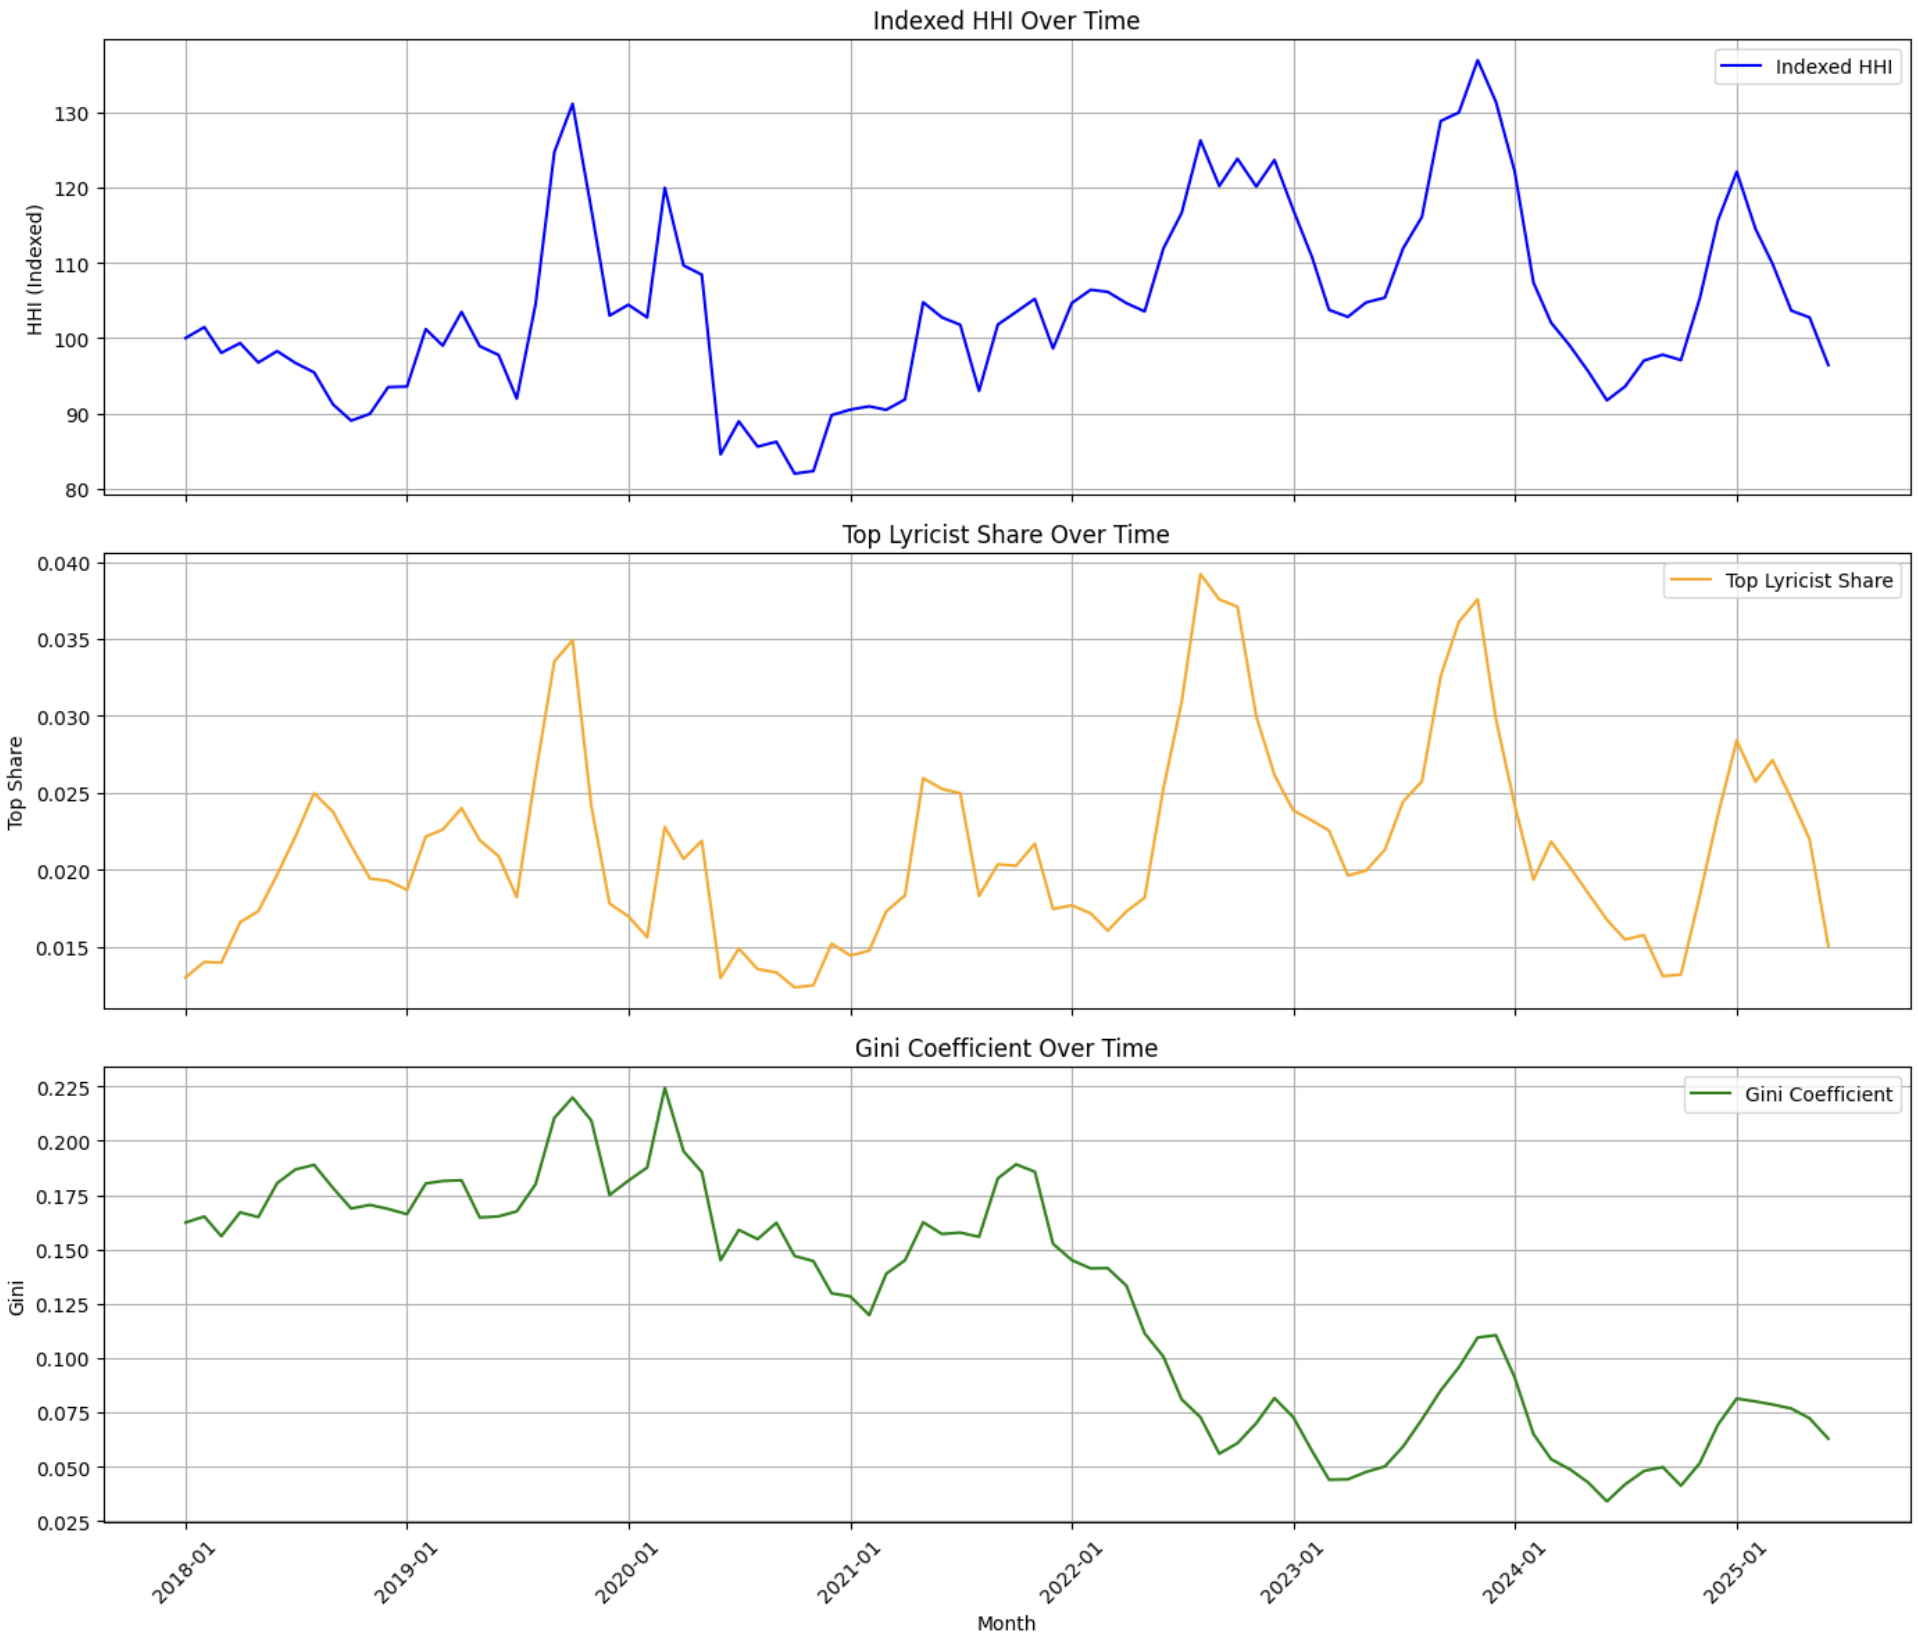
The HHI is comparatively stable from 2018 to 2024. Because of some major album releases by artists such as Drake, Ariana Grande, and Taylor Swift, there were noticeable spikes in the graph. The top artists’ share of success is still disproportionate. Though the Top Lyricist Share has spikes in certain months with major album releases, they match closely with the HHI. As these spikes are only temporary, that means it is not a lasting increase in top lyricist concentration.
However, starting in 2020, the Gini Index decreases and reaches its lowest in 2023, representing a more even distribution of lyricists. More lyricists appear in the Top 100 over time, but it is worth mentioning that top lyricists continue to dominate the hit songs.
In conclusion, my Billboard analysis showed that although top artists still hold the top positions, more artists were able to make it into the Top 100 charts over time, making the distribution more even.
AI Compatibility is Marginally Associated with a Higher Probability of Producing a Hit Song
I ran panel regressions for two analyses: average song popularity and the likelihood of producing hit songs. The first analysis shows the overall track performance due to AI, while the second shows the impact of AI at the top of the distribution.
I first examine changes in average popularity using the following equation:
![\[\mathrm{MeanPop_{g,t} = \alpha + \beta\ (AIExp_g \times Post_t) + \gamma_g + \delta_t + \varepsilon_{g,t}}\]](https://nhsjs.com/wp-content/ql-cache/quicklatex.com-dd9165c6dc1be3ea5daeff598e16eecc_l3.png "Rendered by QuickLaTeX.com")
In this equation, MeanPopg,t represents the average Spotify popularity score of songs released in genre g during month t. AIExpg measures how compatible a genre is with generative AI, and Postt indicates the period after 2020. β(AIExpg x Postt), the interaction term, captures whether genres with higher AI compatibility experienced different changes in popularity after AI tools became more common.
| OLS Regression Results | ||||||
| Dep. Variable: | mean_pop | R-squared: | 0.883 | |||
| Model: | OLS | Adj. R-squared: | 0.881 | |||
| Method: | Least Squares | F-statistic | 47.49 | |||
| No. Observations | 7908 | Prob (F-statistic): | 2.94e-53 | |||
| DF Residuals: | 7728 | Log-Likelihood: | -23333. | |||
| DF Model: | 179 | AIC: | 4.703e+04 | |||
| Covariance Type: | cluster | BIC: | 4.828e+04 | |||
| coef | std err | z | P>|z| | [0.025 | 0.975] | |
| Intercept | 25.6319 | 0.567 | 45.215 | 0.000 | 24.521 | 26.743 |
| Post: AI__exp | 0.1608 | 0.440 | 0.366 | 0.715 | -0.701 | 1.023 |
| Omnibus: | 645.843 | Durbin-Watson: | 1.135 | |||
| Prob(Omnibus): | 0.000 | Jarque-Bera (JB): | 3132.784 | |||
| Skew: | 0.244 | Prob(JB): | 0.00 | |||
| Kurtosis: | 6.045 | Cond. No. | 372. | |||
Notes: Standard errors clustered at the genre level (N = 100 genre clusters). Genre and month-year fixed effects included but not reported.
The coefficient of the interaction term (Post: AI__exp) is small and not statistically significant (coefficient = 0.1608, p = 0.715). This means that genres with higher AI compatibility did not experience a significant increase in average popularity after 2020. Although AI-compatible genres may have had more production, the average popularity score did not increase. This regression result suggests that AI has not raised overall performance in the market.
Next, I examine the likelihood of producing hit songs. This focuses on outcomes at the top of the popularity distribution. Hit share is defined as the fraction of songs in a genre-month whose Spotify popularity score is equal to or greater than 60. I chose this number to identify standout performance while ensuring the number is within the distribution. The following equation is used to estimate the relationship:
![\[\mathrm{HitShare_{g,t} = \alpha + \beta\ (AIExp_g \times Post_t) + \gamma_g + \delta_t + \varepsilon_{g,t}}\]](https://nhsjs.com/wp-content/ql-cache/quicklatex.com-6995b0f632e29094476801dbf99fd2de_l3.png "Rendered by QuickLaTeX.com")
| OLS Regression Results | ||||||
| Dep. Variable: | hit_share | R-squared: | 0.862 | |||
| Model: | OLS | Adj. R-squared: | 0.859 | |||
| Method: | Least Squares | F-statistic | 2.222e+05 | |||
| No. Observations | 7908 | Prob (F-statistic): | 1.08e-226 | |||
| DF Residuals: | 7728 | Log-Likelihood: | 14609 | |||
| DF Model: | 179 | AIC: | -2.886e+04 | |||
| Covariance Type: | cluster | BIC: | -2.760e+04 | |||
| coef | std err | z | P>|z| | [0.025 | 0.975] | |
| Intercept | -0.0033 | 0.004 | -0.916 | 0.359 | -0.010 | 0.004 |
| Post: AI__exp | 0.0051 | 0.003 | 1.847 | 0.065 | -0.000 | 0.010 |
| Omnibus: | 5830.286 | Durbin-Watson: | 1.651 | |||
| Prob(Omnibus): | 0.000 | Jarque-Bera (JB): | 454510.970 | |||
| Skew: | 2.871 | Prob(JB): | 0.00 | |||
| Kurtosis: | 39.694 | Cond. No. | 372. | |||
Notes: Standard errors clustered at the genre level (N = 100 genre clusters). Genre and month-year fixed effects included but not reported.
In this regression, the coefficient for the interaction term is positive and marginally statistically significant (coefficient = 0.0051, p = 0.065). This means that a one-unit increase in the AI compatibility index corresponds to a 0.0051 increase in monthly hit share. Since hit share is measured as a fraction from 0 to 1, this represents approximately a 0.51 percentage point increase. Although this increase is small, I treat it as a suggestive pattern rather than a concrete result.
Overall, an increase in AI compatibility is not associated with an improvement in average popularity score, but the probability of standout performance is slightly increased.
Discussion
Restatement of Key Findings
My analyses show four major findings. First, new artists are mainly responsible for the increase in production in genres with higher AI compatibility after 2020. Second, genre diversity increased, but the increase started before major AI tools became widely accessible. Third, lyricist credits from Billboard became more evenly distributed after 2020. Fourth, there is no statistically significant relationship between AI compatibility and average popularity. However, there is a slight correlation between AI compatibility and hit share.
Implications and Significance
These patterns address the question in the introduction: whether generative AI widens the pool of success or narrows it. The results lean toward concentration, although the evidence is weak. While AI compatibility has little effect for the average song, it is associated with a greater likelihood of producing a hit, so any effect is only seen on the upper end. One possible interpretation of this is that AI makes production easier without changing listeners’ preferences, so producers will focus their attention on what produces the hits, increasing the likelihood of a hit without altering average outcomes.
Limitations
All Spotify-related measures have some limitations. AI compatibility is based on genre, and not on artists or songs, so the variation within genres and the estimated effects may be reduced; it is impossible to check whether or not a song was created using AI because there is little information on AI-generated songs; the dataset is a convenience sample stratified by genre; the logic of the Spotify API collection process is unknown; Spotify assigns artists genres instead of the users or artists themselves; each artist is only assigned one genre, so I give any multi-genre artists only one score; the number of tracks collected is limited to 1,000, so I cannot make conclusions about the entire music industry; the entropy scores reflect the evenness of my sample and not the actual market; AI compatibility scores do not change over the study period, and recalculating them annually would be better for understanding how the industry changes over time.
Measures of popularity measure streaming activity and visibility, not artist merit or welfare. Spotify popularity scores and Billboard chart rankings both depend on recommendations, promotions, paid visibility, and corporate campaigns. These may not fully represent all artists equally. In addition, the Billboard lyricist data mainly represents Western markets, so global markets may be underrepresented.
My analysis cannot account for any live performances or tours, as it only analyzes recorded music. In addition, the study period ends after 2024, and I do not know whether or not the trends will continue as technology advances. Also, my domain knowledge as a trained pianist influenced some subfactors in my AI compatibility framework as there were no external measures to base them off of, so there is some subjectivity.
The difference-in-differences design absorbs shocks that affected all genres within a period and time-invariant genre characteristics because of its genre and time fixed effects. However, there are four limitations of the design. First, it is unknown how the popularity of high- and low-AI-compatibility genres would change if there were no AI tools. This is because the period before AI tools became widely accessible is only two years long, from 2018 to 2019. This is not enough time to estimate stable pre-trend coefficients for event-study plots or parallel-trends diagnostics. Second, shocks, including the COVID-19 pandemic or Spotify’s platform algorithm changes, may have had some impact on genres in ways related to the AI compatibility measure, even though the time fixed effects absorbed them. Third, the broad adoption of AI tools and the COVID-19 pandemic both occurred in 2020, and they cannot be separated in my design. Therefore, all regression results should be treated as descriptive associations, not causal estimates. Fourth, my regression for the hit share uses OLS even though the dependent variable is between 0 and 1. A fractional regression model would be better, and it is something to consider for future work.
As AI-compatible genres, such as pop, trap, EDM, and others, were already growing before 2020, new artists may have started producing music in those genres even if there were no AI tools. The increase in Shannon entropy scores before 2020 also suggests that this may be a possibility.
The Durbin-Watson statistic in Table 2 (DW = 1.135) shows that the average popularity regression errors are related to each other over time. Although the cluster-robust standard errors account for differences between genres, they may not fully account for relationships over time within the same genre.
Recommendations for Future Research
There are three main areas for future work. First, track-level disclosure data would make it possible to see whether or not observed trends were the result of AI adoption or pre-existing genre trends. However, this requires AI labeling requirements to become standard. Second, continuing the analysis past 2024 would test whether the increases in genre diversity and new artist entries stay or reverse as tools advance. Third, linking production data with recommendation algorithm behavior would show whether AI is actually broadening artists’ opportunities, or if it is just influencing which song reaches mass audiences26.
Acknowledgments
I would like to express my sincere gratitude to Professor Maggie Chen at George Washington University for her guidance and support.
Supplementary Material
References
- A. Ordanini, J. C. Nunes. From fewer blockbusters by more superstars to more blockbusters by fewer superstars: How technological innovation has impacted convergence on the music chart. International Journal of Research in Marketing. Vol. 33, pg. 297–313, 2016, https://doi.org/10.1016/j.ijresmar.2015.07.006 [↩]
- S. Rosen. The economics of superstars. American Economic Review. Vol. 71, pg. 845–858, 1981, https://www.jstor.org/stable/1803469 [↩]
- E. Deruty, M. Grachten, S. Lattner, J. Nistal, C. Aouameur. On the development and practice of AI technology for contemporary popular music production. Transactions of the International Society for Music Information Retrieval. Vol. 5, pg. 35–49, 2022, https://doi.org/10.5334/tismir.100 [↩]
- M. Civit, J. Civit-Masot, F. Cuadrado, M. J. Escalona. A systematic review of artificial intelligence-based music generation: Scope, applications, and future trends. Expert Systems with Applications. Vol. 209, pg. 118190, 2022, https://doi.org/10.1016/j.eswa.2022.118190 [↩]
- L. Wei, Y. Yu, Y. Qin, S. Zhang. From tools to creators: A review on the development and application of artificial intelligence music generation. Information. Vol. 16, pg. 656, 2025, https://doi.org/10.3390/info16080656 [↩]
- A. Belibou, L. Iftene. Artificial intelligence and music: A literature review. Proceedings of the International Conference on Technology, Music and Future. 2024, https://doi.org/10.47809/ICTMF.2024.01.05 [↩]
- E. Drott. Copyright, compensation, and commons in the music AI industry. Creative Industries Journal. Vol. 14, pg. 190–207, 2021, https://doi.org/10.1080/17510694.2020.1839702 [↩]
- S. Li. The impact of AI-driven music production software on the economics of the music industry. Information Development. 2025, https://doi.org/10.1177/02666669241312170 [↩]
- A. Henry, V. Wiratama, A. Afilipoaie, H. Ranaivoson, E. Arrivé. Impacts of AI on music consumption and fairness. Emerging Media: Technology, Industry and Society. Vol. 2, pg. 382–396, 2024, https://doi.org/10.1177/27523543241269047 [↩]
- B. Lambert, B. Lamichhane. Understanding the influence of genre-specific music using machine learning. Big Data and Cognitive Computing. Vol. 7, pg. 180, 2023, https://doi.org/10.3390/bdcc7040180 [↩]
- A. Pfeiffer, N. Krishna. AI in music reconstruction: Sentiment in pro versus amateur contexts. Journal of Cultural Management and Cultural Policy. Vol. 11, pg. 256–268, 2025, https://doi.org/10.1177/27018466251366276 [↩]
- D. H. Autor, F. Levy, R. J. Murnane. The skill content of recent technological change: An empirical exploration. Quarterly Journal of Economics. Vol. 118, pg. 1279–1333, 2003, https://doi.org/10.1162/003355303322552801 [↩] [↩]
- C. B. Frey, M. A. Osborne. The future of employment: How susceptible are jobs to computerisation? Technological Forecasting and Social Change. Vol. 114, pg. 254–280, 2017, https://doi.org/10.1016/j.techfore.2016.08.019 [↩]
- E. Brynjolfsson, T. Mitchell. What can machine learning do? Workforce implications. Science. Vol. 358, pg. 1530–1534, 2017, https://doi.org/10.1126/science.aap8062 [↩] [↩]
- D. Acemoglu, P. Restrepo. The race between man and machine: Implications of technology for growth, factor shares, and employment. American Economic Review. Vol. 108, pg. 1488–1542, 2018, https://doi.org/10.1257/aer.20160696 [↩]
- D. Acemoglu, P. Restrepo. Automation and new tasks: How technology displaces and reinstates labor. Journal of Economic Perspectives. Vol. 33, pg. 3–30, 2019, https://doi.org/10.1257/jep.33.2.3 [↩]
- R. Towse. Dealing with digital: The economic organisation of streamed music. Media, Culture & Society. Vol. 42, pg. 1461–1478, 2020, https://doi.org/10.1177/0163443720919376 [↩]
- J. Waldfogel. How digitization has created a golden age of music, movies, books, and television. Journal of Economic Perspectives. Vol. 31, pg. 195–214, 2017, https://doi.org/10.1257/jep.31.3.195 [↩]
- E. Brynjolfsson, Y. J. Hu, M. D. Smith. The longer tail: The changing shape of Amazon’s sales distribution curve. SSRN Working Paper. 2010, https://doi.org/10.2139/ssrn.1679991 [↩]
- C. Anderson, L. Maystre, I. Anderson, R. Mehrotra, M. Lalmas. Algorithmic effects on the diversity of consumption on Spotify. Proceedings of The Web Conference (WWW). pg. 2155–2165, 2020, https://doi.org/10.1145/3366423.3380281 [↩]
- T. Bonini, A. Gandini. “First week is editorial, second week is algorithmic”: Platform gatekeepers and the platformization of music curation. Social Media + Society. Vol. 5, 2019, https://doi.org/10.1177/2056305119880006 [↩]
- D. Hesmondhalgh, R. Campos Valverde, D. B. V. Kaye, Z. Li. The impact of algorithmically driven recommendation systems on music consumption and production: A literature review. UK Centre for Data Ethics and Innovation Reports. 2023, https://ssrn.com/abstract=4365916 [↩]
- M. Bourreau, G. Gaudin. Streaming platform and strategic recommendation bias. Journal of Economics & Management Strategy. Vol. 31, pg. 25–47, 2022, https://doi.org/10.1111/jems.12452 [↩]
- Goldmedia. AI and music: A report commissioned by GEMA and SACEM. 2024, https://www.goldmedia.com/fileadmin/goldmedia/Studie/2023/GEMA-SACEM_AI-and-Music/AI_and_Music_GEMA_SACEM_Goldmedia.pdf [↩]
- E. W. Felten, M. Raj, R. Seamans. Occupational, industry, and geographic exposure to artificial intelligence: A novel dataset and its potential uses. Strategic Management Journal. Vol. 42, pg. 2195–2217, 2021, https://doi.org/10.1002/smj.3286 [↩]
- A. R. Doshi, O. P. Hauser. Generative AI enhances individual creativity but reduces the collective diversity of novel content. Science Advances. Vol. 10, pg. eadn5290, 2024, https://doi.org/10.1126/sciadv.adn5290 [↩]