Abstract
For athletes who train and exercise regularly, it can be helpful to have a simple and reliable way to monitor fatigue. In daily life, fatigue is often assessed through subjective assessments or laboratory testing. Electrocardiogram (ECG)-based heart rate variability (HRV) analysis is commonly used to monitor physiological changes related to fatigue and recovery. However, using an ECG-based analysis during regular athletic training is not always practical. As a student athlete, I wanted to find a simple and affordable way to monitor exercise-related fatigue and recovery. In this paper, I explored whether pulse intervals obtained from photoplethysmography (PPG) could be used to track changes in fatigue and recovery in athletes. A low-cost non-invasive wearable system built with a MAX30102 sensor and an ESP32 microcontroller was used to collect pulse intervals. The RMSSD (Root Mean Square of Successive Differences) was used to calculate short-term changes in autonomic variability. I also created a fatigue score and recovery ratio based on changes in RMSSD to better analyze exercise responses. For comparison, I used publicly available HRV data from PhysioNet as a reference. In this study, the PPG measurements showed a general pattern where RMSSD decreased after exercise and then gradually increased during recovery. In general, participants with higher fatigue scores tended to have lower recovery ratios. These findings suggest that a low-cost wearable PPG-based tool with RMSSD-based analysis can provide a practical method for monitoring exercise-related fatigue and recovery during regular athletic training.
Introduction
Heart rate variability (HRV) is a key measurement in this study because it measures the variation in time intervals between consecutive heartbeats. The autonomic nervous system regulates involuntary physiological processes through its sympathetic and parasympathetic branches, which work together to adjust heart rate during stress and recovery. HRV has been widely used as a non-invasive indicator of autonomic nervous system regulation1. HRV reflects autonomic regulation through the combined influence of the sympathetic and parasympathetic branches, with sympathetic activity increasing heart rate during stress and parasympathetic activity promoting recovery and relaxation, making HRV a useful tool for monitoring physiological stress and recovery in athletes1,2. According to previous studies, among HRV metrics, time-domain metrics such as RMSSD are particularly useful for capturing short-term variability and parasympathetic activity3. In this study, the fatigue score represents the proportional reduction in RMSSD following exercise relative to an individual’s baseline value, while recovery ratio represents the proportion of RMSSD restored during recovery. A higher fatigue score reflects a larger decrease on RMSSD after exercise. A higher recovery ratio reflects RMSSD returned closer to its baseline value during recovery. These measures make it easier to interpret changes of exercise-related stress and autonomic recovery than looking at raw RMSSD values alone.
Monitoring fatigue and recovery is important for maintaining athletic performance and improving training outcomes2,4. When training stress exceeds an athlete’s ability to recover, performance may decline and physiological maladaptation can occur. Therefore, effective physiological monitoring is important5,6,7. ECG measurement offers medical grade precision by directly measuring the heart’s electrical impulses via skin-contact electrodes. In contrast, PPG measurement provides continuous tracking by using optical light sensors to measure the physical volume of blood pulsing through peripheral vessels. Although ECG-based HRV analysis remains the gold standard for HRV measurement, it requires specialized equipment and proper electrode placement, which can make regular monitoring outside the laboratory difficult. Existing methods often require ECG equipment, commercial wearable devices, or laboratory testing4,8. The concerns are that these methods are often expensive and inconvenient to use regularly, especially when measurements need to be taken continuously during athletic training. This study examines whether a low-cost wearable PPG sensor can provide useful pulse-rate variability measurements and explores the use of RMSSD-derived metrics to assess fatigue and recovery. This work is about feasibility and practical implementation rather than replacement of clinical-grade monitoring systems. PPG offers a non-invasive way to measure pulse variability and has been studied as an alternative to ECG-based HRV measurements8. The goal of this research project is not to replace clinical ECG-based systems but to investigate whether an accessible PPG sensor can support practical monitoring of exercise-related fatigue and recovery during athletic training.
Previous studies have largely focused on laboratory HRV measurements or commercial wearable systems. Some wearable devices now allow HRV to be estimated using PPG data, which may provide a low-cost and portable alternative to ECG data. However, it remains challenging how accurately these systems reflect physiological variability across different exercise conditions, particularly when assessing fatigue and recovery. Since HRV monitoring has become common in sports science and has been widely used to assess autonomic nervous system regulation and cardiovascular function9, this study investigates whether PPG-derived variability metrics collected from a low-cost wearable sensor can be used to measure athletic fatigue and recovery. It also explores the relationship between the proposed RMSSD-based fatigue score and recovery ratio.
In this study, athletes were defined as recreationally active or competitively trained individuals who regularly participated in structured physical exercise. HRV data from PhysioNet were used as a reference to compare with the measured RMSSD values.
Methods
Data Collection
Pulse waveform data were collected with a MAX30102 photoplethysmography (PPG) sensor module (GY-MAX30102, PAMEENCOS, China), which integrates red and infrared light-emitting diodes and a photodetector for optical pulse sensing. The sensor was interfaced with an Arduino Nano ESP32 microcontroller (Arduino, Italy), which was used for signal acquisition and data processing. Pulse intervals were taken from consecutive pulse peaks and used to calculate RMSSD as a measure of short-term autonomic variability. The technical specifications for the MAX30102 sensor and Arduino Nano ESP32 were taken from the manufacturers’ documentation and product datasheets10,11.
In this study, “athlete” refers to individuals who were recreationally active or competitively trained and exercised at least three times per week. 30 trials were collected from 10 participants with different levels of training experience. Before taking part, participants were informed about the purpose and procedures of the study, and each participant gave verbal consent. Participation was voluntary, and the data were collected anonymously and used only for this research. Five participants completed four trials each, including two light and two intense exercise repeated trials. The other five participants completed two trials each, with one light and one intense exercise trial. The repeated trials help compare how consistent the results were for the same participant, while including additional participants provided more variations among individuals. All participants completed both light and intense exercise conditions. This set allowed RMSSD responses to be evaluated under specific levels of physiological stress. This design also allowed comparisons between exercise intensities within each participant while also examining differences among participants. However, these trials were conducted in separate sessions on different days to avoid carryover effects. Exercise intensity was categorized into two levels: light exercise (1-2 minutes of running) and intense exercise (approximately 10 minutes of sustained running). Exercise intensity was based on exercise duration and was not verified using heart rate, pace, or perceived exertion measures. Variables including running pace, distance, heart rate, perceived exertion, environmental conditions, and recent participant behaviors (e.g., sleep, hydration, caffeine intake) were not controlled or recorded during the study.
Because of these limitations, the exercise categories in this study were used only to describe the general type of workout performed, rather than the measures of exercise intensity. Measurements were taken at three points in each trial: at rest before exercise, about 1 minute after exercise, and about 10 minutes after exercise to measure recovery. These time points were used to observe changes in autonomic variability immediately after exercise and during recovery. Sessions held on different days were generally separated by at least 24 hours. The exact interval varied among participants, but maintaining a 24-hour gap helped reduce the influence of the previous exercise session. The same measurement procedure was followed for each trial so that the results before and after exercise could be compared.
Ethics Statement
This study collected minimal-risk physiological data using a non-invasive photoplethysmography (PPG) sensor during routine exercise activities. Prior to data collection, all participants were informed about the purpose of the study, the procedures, potential risks, and that participation was voluntary. They then gave verbal informed consent to participate.
The participant group included one 15-year-old minor, who was also the student researcher. Parental permission was obtained before participation, and the student provided verbal assent. All other participants were adults who gave verbal informed consent. This study collected no personally identifiable health information, and participants could withdraw at any time. Exercise activities consisted of routine physical activity and did not involve interventions beyond normal exercise participation.
As an independent student research project, this study did not receive formal Institutional Review Board (IRB) review or exemption. The study involved minimal-risk, non-invasive physiological measurements and was conducted outside an institution with access to an IRB. No formal pre-exercise medical screening was performed. These factors serve as study limitations and should be considered when interpreting the findings.
Signal Processing
In order to minimize the effects of motion artifacts and peak-detection errors, pulse interval data were filtered using a relative artifact-correction method. Pulse intervals represent the time between consecutive pulse peaks detected in the PPG waveform. At the same time, consecutive peaks were identified from the PPG signal. Meanwhile, the time difference between adjacent peaks was calculated to obtain the pulse intervals. A fixed minimum heart-rate cutoff was not used because heart rate normally stays higher immediately after exercise. Instead, a percentage-based method was used to account for differences in heart rate among participants. Because normal pulse intervals usually change within a reasonable physiological range, it is possible that the unusually large changes between consecutive intervals reflect motion artifacts, missed detections, or signal noise rather than actual physiological changes3. These abrupt changes can introduce errors into pulse interval measurements and affect HRV analysis. For this reason, intervals exceeding the relative threshold were excluded from further analysis. Compared with a fixed threshold, the percentage-based method accounts for differences in baseline heart rate among participants. Pulse intervals that changed by more than 20% from the previous interval were marked as potential artifacts and removed from the analysis. A 20% successive-interval threshold has previously been used in RR-interval processing (the time between consecutive ECG R waves) to identify potential artifacts or abnormal beats12. In this study, this threshold was applied as a practical artifact screening criterion for PPG-derived pulse intervals. This cutoff was chosen to flag unusually large changes while retaining intervals that may reflect normal physiological variation.
This study used the Root Mean Square of Successive Differences (RMSSD) as the primary metric. RMSSD was calculated from the consecutive PPG-derived pulse intervals as a measure of short-term autonomic variability. As a standard time-domain measure, RMSSD reflects short-term autonomic variability and is strongly influenced by parasympathetic activity3. RMSSD is also widely used in sports science because it is sensitive to changes in fatigue, recovery dynamics, and training load 4,13. RMSSD can change shortly after exercise, which makes it useful for monitoring fatigue using wearable devices. In this study, it should be noted that although RMSSD was calculated using PPG pulse peaks, it reflects the variation in the timing between consecutive pulses rather than changes in pulse waveform amplitude.
HRV Metrics
As described in the previous section, the primary HRV metric used in this study was RMSSD. In this study, baseline referred to each individual’s resting RMSSD measured before exercise. This value was used as a reference to compare changes in fatigue and recovery after exercise.
The following derived metrics were developed for this study.
Fatigue and recovery metrics were derived from RMSSD measurements across different phases of exercise. The fatigue score was defined as the relative decrease in RMSSD following exercise:
The fatigue score was developed in this study to measure the relative decrease in RMSSD after exercise. Previous studies have found that RMSSD tends to decrease after acute exercise and periods of higher training load, which is associated with reduced parasympathetic activity and greater physiological stress2,14,15. Therefore, a higher fatigue score may indicate a larger decrease in pulse-rate variability after exercise and may indicate greater exercise-related physiological stress.
The recovery ratio was defined as:
The recovery ratio measures how much RMSSD recovered compared with the initial decrease after exercise. Values closer to 1 indicate that RMSSD returned more closely to its baseline level.
Reference Dataset
To get an external reference for comparison with the athlete measurements, publicly available data from the PhysioNet repository16were used. Specifically, RR interval data were obtained from the PhysioNet dataset RR Interval Time Series from Healthy Subjects (Version 1.0.0)17, which includes recordings of healthy individuals from different ages. RMSSD values were calculated from these recordings using the same RMSSD formula that is used to analyze the participant data in this study.
For each recording, artifacts were removed before RMSSD was calculated from consecutive RR intervals. The mean, median, and interquartile range were then calculated across the dataset. The mean RMSSD in the reference distribution was approximately 48ms, and the interquartile range was between 30ms and 58ms. These values were used only as a general reference for interpreting the RMSSD measurements in this study, because the PhysioNet subjects differed from the study participants in terms of age, demographics, and activity level. Therefore, the PhysioNet RMSSD values were used as general benchmark rather than as a direct comparison. Previous studies have reported that trained athletes tend to have higher resting RMSSD values than healthy people who do not regularly train. This may be related to higher parasympathetic cardiac activity18. For this reason, some differences between the athlete measurements in this study and the PhysioNet data were expected.
Exploratory Analysis of Fatigue and Recovery Metrics
To explore the relationship between the proposed fatigue score and recovery ratio, a simple linear regression analysis was performed. The fatigue score was used as the independent variable, while the recovery ratio was used as the dependent variable. Since both measures were calculated from the shared RMSSD data, the analysis was intended to provide a descriptive assessment of the associationbetween the proposed metrics rather than establish an independent predictive relationship. It was not intended to show that one measure could independently predict the other. The coefficient of determination (R²) was calculated to analyze the observed association within the dataset.
The exploratory regression relationship is expressed as:
Recovery Ratio = a ⋅ (Fatigue Score) + b
where a and b represent the slope and intercept obtained from the fitted regression line. The resulting regression was used for exploratory analysis. It was used to examine the relationship between the fatigue score and recovery ratio. For this study, the fitted relationship was:
y=−0.7358x + 0.7637
Results
RMSSD Responses Across Measurement Phases
Across the participant group, RMSSD generally decreased after exercise. Post-exercise RMSSD values were significantly lower than resting values, indicating increased physiological stress and reduced parasympathetic activity. During recovery, RMSSD increased from the post-exercise measurements but did not always return to baseline.
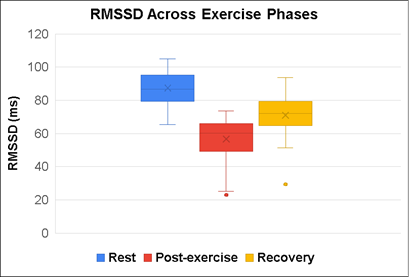
A paired t-test comparing resting and post-exercise RMSSD values showed a significant decrease following exercise (p < 0.001), indicating that exercise was associated with lower PPG-derived RMSSD.
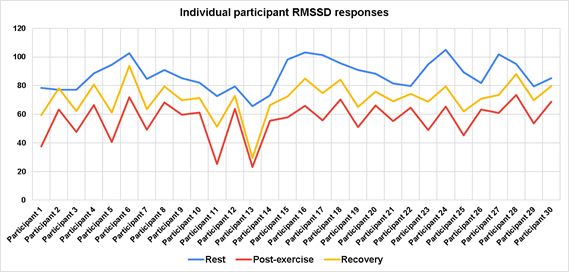
Individual participant RMSSD values measured at rest, post-exercise, and recovery. Participants completed either a light exercise protocol (1-2 minutes of running) or an intense exercise protocol (approximately 10 minutes of sustained running).
Figure 2 shows how RMSSD changed for each participant across the different measurement phases. Most participants had lower RMSSD after exercise, followed by an increase during recovery, although the amount of change varied among the participants.
Fatigue and Recovery Relationship
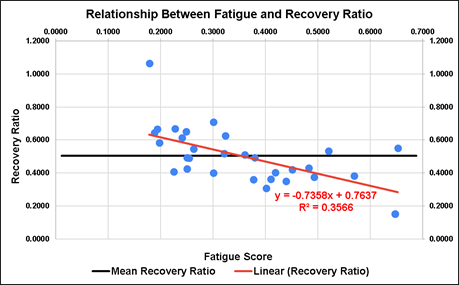
As shown in Figure 3, a negative relationship was observed between fatigue score and recovery ratio, indicating that higher RMSSD-derived fatigue scores were associated with lower recovery ratios. The horizontal reference line represents the mean recovery ratio across all trials (0.5045). The regression model (red line) captures this trend, indicating that recovery ratio generally decreases as fatigue score increases. The regression line indicates the overall association between the proposed fatigue and recovery metrics. In this dataset, the observed trend suggests that larger drops in RMSSD after exercise generally occurred alongside lower recovery ratios.
The observed association yielded an R² value of 0.3566, indicating a moderate association between the proposed fatigue and recovery metrics. Because both variables were derived from the shared RMSSD measurements, their relationship was used to describe the observed trend rather than to make predictions. Differences in recovery responses may also be influenced by physiological conditions, the environment, and measurement conditions. Despite these differences, the observed association between the two metrics suggests that they reflect exercise-induced changes in RMSSD after exercise and during recovery.
Effect of Exercise Intensity
Participants in the intense exercise (long-duration) condition had higher fatigue scores and lower recovery ratios than participants in the light exercise (short-duration) condition. This suggests that longer exercise sessions were associated with slower recovery.
Figures 4 and 5 show these differences between the two types of exercise conditions. On average, participants in the light exercise condition had higher recovery ratios, whereas those in the intense exercise condition had higher fatigue scores. The intense exercise group showed larger decreases in RMSSD and lower recovery ratios after exercise. Although the error bars showed overlap, exploratory Welch’s two-sample t-tests indicated significant differences between these two groups. Recovery ratios were significantly higher after light exercise than after intense exercise (p = 0.0038), while fatigue scores were significantly higher following intense exercise (p < 0.001).
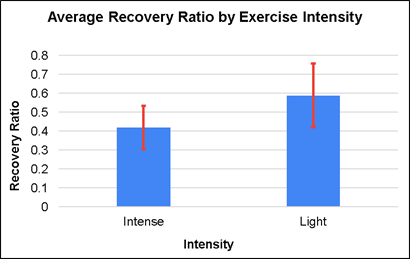
Error bars represent ±1 standard deviation. Recovery ratios differed significantly between exercise conditions (Welch’s t-test, p = 0.0038).
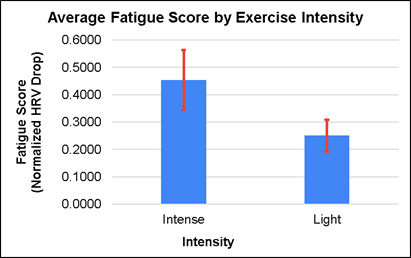
Error bars represent ±1 standard deviation. Fatigue scores differed significantly between exercise conditions (Welch’s t-test, p < 0.001).
Error bars represent ±1 standard deviation and show how much RMSSD responses varied among participants. Differences among participants may be due to individual physiology, how they responded to exercise, measurement conditions, or other factors that were not controlled in this study. Even with these differences, there were still statistically significant differences observed between the exercise conditions. Recovery ratios were higher in the light-exercise group than in the intense-exercise group (Welch’s t-test, p = 0.0038), whereas fatigue scores were higher in the intense-exercise group (Welch’s t-test, p < 0.001). These findings suggest that the intense exercise condition was associated with larger reductions in RMSSD and lower recovery ratios relative to the light exercise condition. This pattern is similar to previous studies that found decreases in RMSSD after exercise followed by a gradual return toward baseline during recovery15,19,20.
PhysioNet vs Athlete RMSSD (boxplot)
Figure 6 compares the RMSSD values from the PhysioNet dataset with the measurements from the athletes. It provides a reference baseline for comparison with the results observed in this study. The resting RMSSD values were generally within the range reported in the PhysioNet dataset. This suggests that the baseline values measured in this study were within the expected physiological range. In addition, post-exercise RMSSD values were lower than resting levels, indicating increased exercise-related physiological stress, while recovery RMSSD values increased relative to post-exercise measurements but remained variable across individuals. These observations are consistent with previously reported exercise-related changes in RMSSD and reflect variability in recovery responses observed among participants15,19,20.
It was observed that RMSSD responses also varied among participants. Although general trends were similar across participants, the size of the changes differed among individuals. Some of these differences may be related to fitness level, physiological adaptation, and how each participant responded to exercise. For this reason, RMSSD-based fatigue metrics may be more meaningful when interpreted relative to each individual’s own baseline
Discussion
The results of this study suggest that RMSSD derived from a wearable photoplethysmography (PPG) sensor could capture exercise-related changes in autonomic variability associated with fatigue and recovery dynamics in athletes. RMSSD decreased after exercise, which is consistent with the expected increase in sympathetic activity and reduction in parasympathetic activity. Similar changes have been reported in previous HRV studies following exercise15,20. Previous studies have shown that RMSSD generally increases during recovery as parasympathetic activity gradually returns after exercise15,20. Most participants showed similar responses that RMSSD decreased after exercise and increased during the recovery period. The PPG measurements showed the same changes, suggesting that the wearable sensor was able to capture the RMSSD changes after exercise and during recovery.
In some studies, RMSSD values are log-transformed (lnRMSSD) and used for athlete monitoring and HRV analysis21. However, raw RMSSD values were used in this study because they are easier to interpret physiologically and are more practical for wearable monitoring. A moderate association was observed between the proposed fatigue score and recovery ratio (R² = 0.3566). Since both metrics were calculated from the shared RMSSD measurements, their relationship was considered as descriptive rather than predictive. Future studies with more participants and additional statistical methods may help better understand the relationship between fatigue and recovery. In some case, the recovery ratio was higher than 1. This could be because of a temporary increase in parasympathetic activity or normal variation in the measurements. The analysis included this value to avoid intervention of the dataset. In addition, the athletes’ RMSSD results were compared with the PhysioNet reference data to see how they aligned with previously reported physiological ranges.
Previous research has shown that endurance-trained athletes tend to have higher baseline RMSSD values than non-athletes18,19, while RMSSD typically decreases after acute exercise and may also decrease during periods of higher training load as parasympathetic activity decreases15,20,22.
Since baseline RMSSD can vary among individuals, comparing an athlete’s RMSSD with their own baseline may be more useful than comparing them with other athletes. Monitoring RMSSD over time can show changes in training adaptation, recovery, and autonomic responses to exercise4,13,14,21,23,24. These findings are also in line with previous studies that have used HRV measures, including RMSSD, to look at recovery and training responses in athletes15,25,26,27.
Using a wearable sensor in this way may provide a simple and low-cost option to monitor fatigue and recovery during training. Previous studies have found HRV monitoring useful for tracking training load, assessing recovery, and identifying responses to training stress4,13,14, while wearable PPG technology has also been evaluated for HRV monitoring28. Tracking changes in RMSSD-derived metrics could help athletes and coaches see how well the athlete is recovering between training sessions. For example, a high fatigue score combined with a low recovery ratio may indicate that the athlete has not fully recovered yet. When the recovery ratio increases, RMSSD moves toward baseline, which may indicate better recovery before the next training session14,20,21.
This is similar to approaches used in previous sports-performance research that use HRV to guide training and monitor athletes4,13,14,29. This framework summarizes changes in RMSSD during exercise and recovery in a simple way. Using a wearable PPG sensor also allows these measurements to be collected with low-cost, non-invasive equipment outside the laboratory. Although PPG-derived variability measurements are not identical to ECG-derived HRV measurements, previous studies have reported agreement between the two under resting and low-motion conditions8,28.
Overall, the results of this study show that a wearable sensor combined with RMSSD-based measurements could be helpful for tracking fatigue and recovery in athletes. However, more research is needed to examine how well this method works under different training conditions. Future studies could consider to use improved signal processing, more consistent exercise routines, more participants, and longer testing periods. Low-cost wearable devices may also make fatigue monitoring easier and more affordable to use during regular athletic training rather than limiting these measurements to laboratory requirements.
Limitations
This study has several limitations. First, the exercise conditions were not fully standardized. Exercise intensity was based on exercise duration rather than measured using heart rate, running pace, distance, or ratings of perceived exertion. Other factors that can affect HRV, such as hydration, sleep, caffeine intake, temperature, time of day, and recovery posture, were not kept the same for every participant. These factors could have been different among participants and from one trial to another. Therefore, the results provide an initial look at exercise-related changes rather than a full assessment of fatigue and recovery.
Sport type and athletic training background were not analyzed separately in this study. The measurement periods were relatively short. Basic demographic information such as age range was recorded, but other demographic details were not recorded. The exercise periods in this study were shorter than normal athletic training sessions, so the results may not fully represent the actual situation during regular training. Finally, some participants completed more than one trial. Since not all observations were independent, the statistical results were considered exploratory. The differences found in this study may appear more statistically significant than they would be in a larger study with more independent observations.
All physiological data in this study came from a PPG sensor. No ECG recordings were taken at the same time. Although previous studies have found similar variability measurements from PPG and ECG under certain conditions, this study did not directly compare the two methods28. Additionally, other wearable heart rate monitors have shown good agreement with ECG-based RR interval measurements30. For this, the measurements in this study reflect pulse-rate variability from PPG rather than HRV measured with ECG. Future research could record PPG and ECG at the same time to compare the two methods and determine how accurate this monitoring approach is.
Acknowledgments
I would like to thank all of the participants who volunteered their time for this study. I am also grateful to the PhysioNet database for making its open-source physiological datasets publicly available for a reference in this research. Finally, I would like to thank my family and mentors for their support and feedback throughout the project research.
Conclusion
This study suggests that RMSSD measured with wearable PPG sensors may be useful to track fatigue and recovery during regular athletic training. Combining a wearable physiological sensor with RMSSD-based analysis provides a low-cost method to assess how the body responds to exercise. This method could help athletes and coaches track changes in fatigue and recovery during training. Further studies are needed to examine this method with more athletes, more consistent exercise conditions, and longer periods of monitoring.
References
- F. Shaffer, J. P. Ginsberg. An overview of heart rate variability metrics and norms. Frontiers in Public Health. Vol. 5, 258 (2017). [↩] [↩]
- L. Schmitt, et al. Monitoring fatigue status with HRV measures in elite athletes: An Avenue Beyond RMSSD? Frontiers in Physiology. Vol. 6, 343 (2015). [↩] [↩] [↩]
- Task Force of the European Society of Cardiology. Heart rate variability: standards of measurement, physiological interpretation, and clinical use. Circulation. Vol. 93, 1043-1065 (1996). [↩] [↩] [↩]
- J. S. Addleman, N. S. Lackey, J. A. DeBlauw, A. G. Hajduczok. Heart rate variability applications in strength and conditioning: a narrative review. Journal of Functional Morphology and Kinesiology. Vol. 9, 93 (2024). [↩] [↩] [↩] [↩] [↩] [↩]
- R. Meeusen, M. Duclos, C. Foster, A. Fry, M. Gleeson, D. Nieman, J. Raglin, G. Rietjens, J. Steinacker, A. Urhausen. Prevention, diagnosis, and treatment of the overtraining syndrome. European Journal of Sport Science. Vol. 13, 1-24 (2013). [↩]
- P. C. Bourdon, M. Cardinale, A. Murray, M. Gastin, M. Kellmann, P. Varley, T. J. Gabbett, A. Coutts, K. Burgess, C. Gregson, D. Cable. Monitoring athlete training loads: Consensus statement. International Journal of Sports Physiology and Performance. Vol. 12, S2161-S2170 (2017). [↩]
- M. Kellmann. Preventing overtraining in athletes in high-intensity sports and stress/recovery monitoring. Scandinavian Journal of Medicine & Science in Sports. Vol. 20, 95-102 (2010). [↩]
- S. Lu, H. Zhao, K. Ju, et al. Can photoplethysmography variability serve as an alternative approach to obtain heart rate variability information? Journal of Clinical Monitoring and Computing. Vol. 22, 23-29 (2008). [↩] [↩] [↩]
- G. E. Billman. Heart Rate Variability – A Historical Perspective. Frontiers in Physiology. Vol. 2, 86 (2011). [↩]
- Analog Devices. MAX30102 High-Sensitivity Pulse Oximeter and Heart-Rate Sensor for Wearable Health. Datasheet, (2023). [↩]
- Arduino. Arduino Nano ESP32 Technical Specifications. Arduino Documentation, (2024). [↩]
- G. dos Santos Ribeiro, V. R. Neves, L. F. Deresz, R. D. Melo, P. Dal Lago, M. Karsten. Can RR intervals editing and selection techniques interfere with the analysis of heart rate variability? Brazilian Journal of Physical Therapy. Vol. 22, pg. 383-390 (2018). [↩]
- D. J. Plews, P. B. Laursen, A. E. Kilding, M. Buchheit. Heart-rate variability and training-intensity distribution in elite rowers. International Journal of Sports Physiology and Performance. Vol. 9, 1026-1032 (2014). [↩] [↩] [↩] [↩]
- M. Buchheit. Monitoring training status with HR measures: do all roads lead to Rome? Frontiers in Physiology. Vol. 5, 73 (2014). [↩] [↩] [↩] [↩] [↩]
- S. Michael, K. S. Graham, G. M. Davis. Cardiac autonomic responses during exercise and post-exercise recovery using heart rate variability and systolic time intervals: a review. Frontiers in Physiology. Vol. 8, 301 (2017). [↩] [↩] [↩] [↩] [↩] [↩] [↩]
- A. L. Goldberger, L. A. N. Amaral, L. Glass, et al. PhysioBank, PhysioToolkit, and PhysioNet: components of a new research resource for complex physiologic signals. Circulation. Vol. 101, e215-e220 (2000). [↩]
- I. M. Irurzun, L. Garavaglia, M. M. Defeo, J. Thomas Mailland. RR interval time series from healthy subjects. PhysioNet. Version 1.0.0 (2021). [↩]
- O. Kiss, N. Sydó, P. Vargha, H. Vágó, C. Czimbalmos, E. Édes, et al. Detailed heart rate variability analysis in athletes. Clinical Autonomic Research. Vol. 26, pg. 245-252 (2016). [↩] [↩]
- A. E. Aubert, B. Seps, F. Beckers. Heart rate variability in athletes. Sports Medicine. Vol. 33, 889-919 (2003). [↩] [↩] [↩]
- J. Stanley, J. M. Peake, M. Buchheit. Cardiac parasympathetic reactivation following exercise: implications for training prescription. Sports Medicine. Vol. 43, 1259-1277 (2013). [↩] [↩] [↩] [↩] [↩] [↩]
- D. J. Plews, P. B. Laursen, J. Stanley, A. E. Kilding, M. Buchheit. Training adaptation and heart rate variability in elite endurance athletes: opening the door to effective monitoring. Sports Medicine. Vol. 43, 773-781 (2013). [↩] [↩] [↩]
- A. A. Flatt, M. R. Esco, J. R. Allen, J. B. Robinson, R. L. Earley, M. V. Fedewa, A. Bragg, C. M. Keith, J. E. Wingo. Heart rate variability and training load among National Collegiate Athletic Association Division 1 college football players throughout spring camp. Journal of Strength and Conditioning Research. Vol. 32, 3127-3134 (2018). [↩]
- M. Weippert, M. Behrens, A. Mau-Moeller, S. Bruhn, K. Behrens. Relationship between morning heart rate variability and creatine kinase response during intensified training in recreational endurance athletes. Frontiers in Physiology. Vol. 9, 1267 (2018). [↩]
- A. A. Flatt, M. R. Esco. Heart rate variability stabilization in athletes: towards more convenient data acquisition. Clinical Physiology and Functional Imaging. Vol. 36, 331-336 (2016). [↩]
- A. J. Hautala, A. M. Kiviniemi, M. P. Tulppo. Individual responses to aerobic exercise: the role of the autonomic nervous system. Neuroscience & Biobehavioral Reviews. Vol. 33, 107-115 (2009). [↩]
- C. R. Bellenger, J. T. Fuller, R. L. Thomson, K. Davison, E. Y. Robertson, J. D. Buckley. Monitoring athletic training status through autonomic heart rate regulation: a systematic review and meta-analysis. Sports Medicine. Vol. 46, 1461-1486 (2016). [↩]
- A. J. Kiviniemi, A. M. Hautala, M. P. Tulppo, T. H. Makikallio, A. Perkiomaki, H. V. Huikuri. Endurance training guided individually by daily heart rate variability measurements. European Journal of Applied Physiology. Vol. 101, 743-751 (2007). [↩]
- C. R. Bellenger, D. J. Miller, S. L. Halson, G. D. Roach, C. Sargent. Wrist-based photoplethysmography assessment of heart rate and heart rate variability: validation of WHOOP. Sensors. Vol. 21, 3571 (2021). [↩] [↩] [↩]
- M. Buchheit, A. Chivot, A. Parouty, D. Mercier, H. Al Haddad, P. B. Laursen, S. Ahmaidi. Monitoring endurance running performance using cardiac parasympathetic function. European Journal of Applied Physiology. Vol. 108, 1153-1167 (2010). [↩]
- M. Gilgen-Ammann, A. Schweizer, J. Wyss. RR interval signal quality of a heart rate monitor and an ECG Holter at rest and during exercise. European Journal of Applied Physiology. Vol. 119, 1525-1532 (2019). [↩]