
Abstract
Games on the Steam platform vary greatly in terms of price, content and audience. This study aims to explore which observable game characteristics are related to the price of the game, and how these characteristics can predict the price. The sample covers 135,043 Steam games released between 1997 and 2026. Free games are still included in the data set, because their prices are modeled by logarithmic transformation (log (price + 1)); the highly biased user participation index also adopts the same transformation method, and the number of game owners is converted to the median. This study evaluates the mean reference line model, linear regression model, stochastic forest model and gradient-up model, and adopts the 80/20 training set-test set division method and the 50% cross-verification method. The random forest model performed best on the retention test set (MSE = 0.512, RMSE = 0.716, MAE = 0.532, R² = 0.421), and its average cross-validation R² value is 0.399. Replacement significance analysis and Shapley value analysis reveal the impact of features such as the number of game owners, the number of game categories, the year of release, the number of recommendations and positive comments on the price. This distinction is important because many variables on the Steam platform are only observed after the game is released. A low-participation model that excludes obvious post-release indicators has poor performance (R² = 0.279), while the model built with simultaneous proxy variables such as developer, publisher, discount rate and game type has reached R² = 0.625. The segmentation result of the time point in 2026 is lower than the mean reference line (R² = -0.082), which reveals the limitations of the generalization ability of the model. Overall, these results reveal a stable correlation in the data set, rather than a certain pricing rule or a direct pricing recommendation.
Keywords: video game pricing, machine learning, Random Forest, digital marketplaces, Steam platform
Introduction
Industry Context and Platform Research
Steam provides a unified sales platform, but there is no isolated competition between games on the platform. Their market position also reflects the scale of the accessible catalog and the composition of the user group base, and the point at which they enter the market.
Research on the game console market reveals the importance of the platform environment: software availability and the installed user base can promote each other1,2, and a few mainstream games can have an impact on hardware sales3. Other studies have explored issues such as monopoly, multi-platform operation, vertical integration and platform strategy4,5,6,7. In addition, there are differences in demand between different user groups and different platforms, which will also affect the market performance of a single game8,9. Although these studies do not directly explain the pricing mechanism of games on the Steam platform, they show that games should not be regarded as independent products.
Recent research has deeply explored how platform design affects a single game. Cennamo, Ozalp and Kretschmer10 studied the quality trade-off relationship between multi-platform complementary products, while Rietveld, Schilling, and Bellavitis11 examined selective platforms promotion strategy. Gretz et al.12 pointed out that the impact of superstar software and non-superstar software on the market will also change with the life cycle of the hardware platform. These research results further emphasize the importance of considering variables such as publishers, developers, game types and platforms as potential pricing background factors rather than interchangeable content quantity indicators.
Platform Selection and Steam Research
Steam was chosen because it combines the price of the product list with a unified set of metadata. Previously, a number of studies on Steam analyzed a total of 1,182 Early Access games and 6,224 reviews of games13,14. These studies show that Steam data can be used to analyze game distribution strategies, player feedback and user behavior after the game is released. However, the data set does not provide a large-scale commodity list price model.
Available fields include comments, user ratings, game duration, content classification, platform compatibility and price marking. Using only a single platform can ensure the consistency of the data structure while retaining significant differences between different games.
Prior Research and Study Motivation
The two aspects in the previous study are particularly relevant. The first aspect explores the law of price change over time; the research on console games has modeled cross-perar price discrimination and price change trajectory15,16, while Cox17 links observable game attributes with sales. These research scenarios are different from the single cross-sectional analysis of game prices on the Steam platform, but they all show that the market results of the game market will vary depending on the product and the release period.
The second aspect concerns online reviews. Studies using books, films, and other online markets link review activity to sales while also documenting selection and identification problems18,19,20,21,22. This evidence supports that using reviews as market signals, but not treating them as exogenous causes.
The follow-up study examined the comment text, the characteristics of the reviewer, the brand strength and the maturity of the product category23,24,25. The comment effect varies from product to product and may be affected by social trends26,27. Comments and game duration on the Steam platform also contain valuable post-release information14. Therefore, this analysis regards user participation as real-time information, rather than a direct measurement of pre-release demand.
Machine learning research has developed personalized, multimodal and migration learning methods suitable for dynamic pricing28,29,30. These models are learned by analyzing the trend of price changes or demand evolution over time. The data used in this article corresponds to an observation value for each game, so this study aims to explore a simpler question: how much of the current metadata can explain the fluctuation of the listed price?
Existing studies address console pricing, platform competition, online reviews, Steam release behavior, and dynamic price optimization. They do not show, at this scale, how much of the cross-sectional variation in Steam prices can be captured by linear and nonlinear models after obvious post-release engagement measures are set aside. The present study examines that narrower question.
Research Question and Contribution
The question of this study is very clear: which observable characteristics on the Steam platform are most closely related to the listed price, and what is the prediction accuracy of these characteristics for the listed price?
The analysis compared a mean baseline, Linear Regression, Random Forest, and Gradient Boosting among 135,043 games. It also compared the full model with a simplified model that removed owners, reviews, recommendations, CCU, and playtime. Because the remaining metadata may have changed after release, this comparison was not regarded as a true publish-time model. To test the robustness of the model, cross-validation, time split, and various importance indicators were adopted.
Methods
Data Source and Acquisition
This analysis adopts the JSON version of the Steam Games Dataset31 data set. The data set contains 135,043 games released between 1997 and 2026, including 107,205 paid games and 27,838 free games. The JSON data set is selected because its field name and values are correctly aligned with the target data set.
The dataset documentation states that, the records combine public Steam information with SteamSpy estimates. The estimated-owners field was a range but not a verified transaction count31, so it was treated as a proxy.
The fields used here covered listed price, release date, required age, positive and negative reviews, peak concurrent users (CCU), achievements, recommendations, playtime, genres, categories, tags, and Windows, Mac, and Linux support.
This dataset can be obtained from Kaggle. The license information of this dataset can be found on page 31 of its dataset page. It should be noted that this dataset is not regarded as the official record of all Steam transactions.
Exploratory Data Analysis
Before fitting the models, I reviewed the distributions of the candidate variables, the span of release years, and the completeness of the source fields.
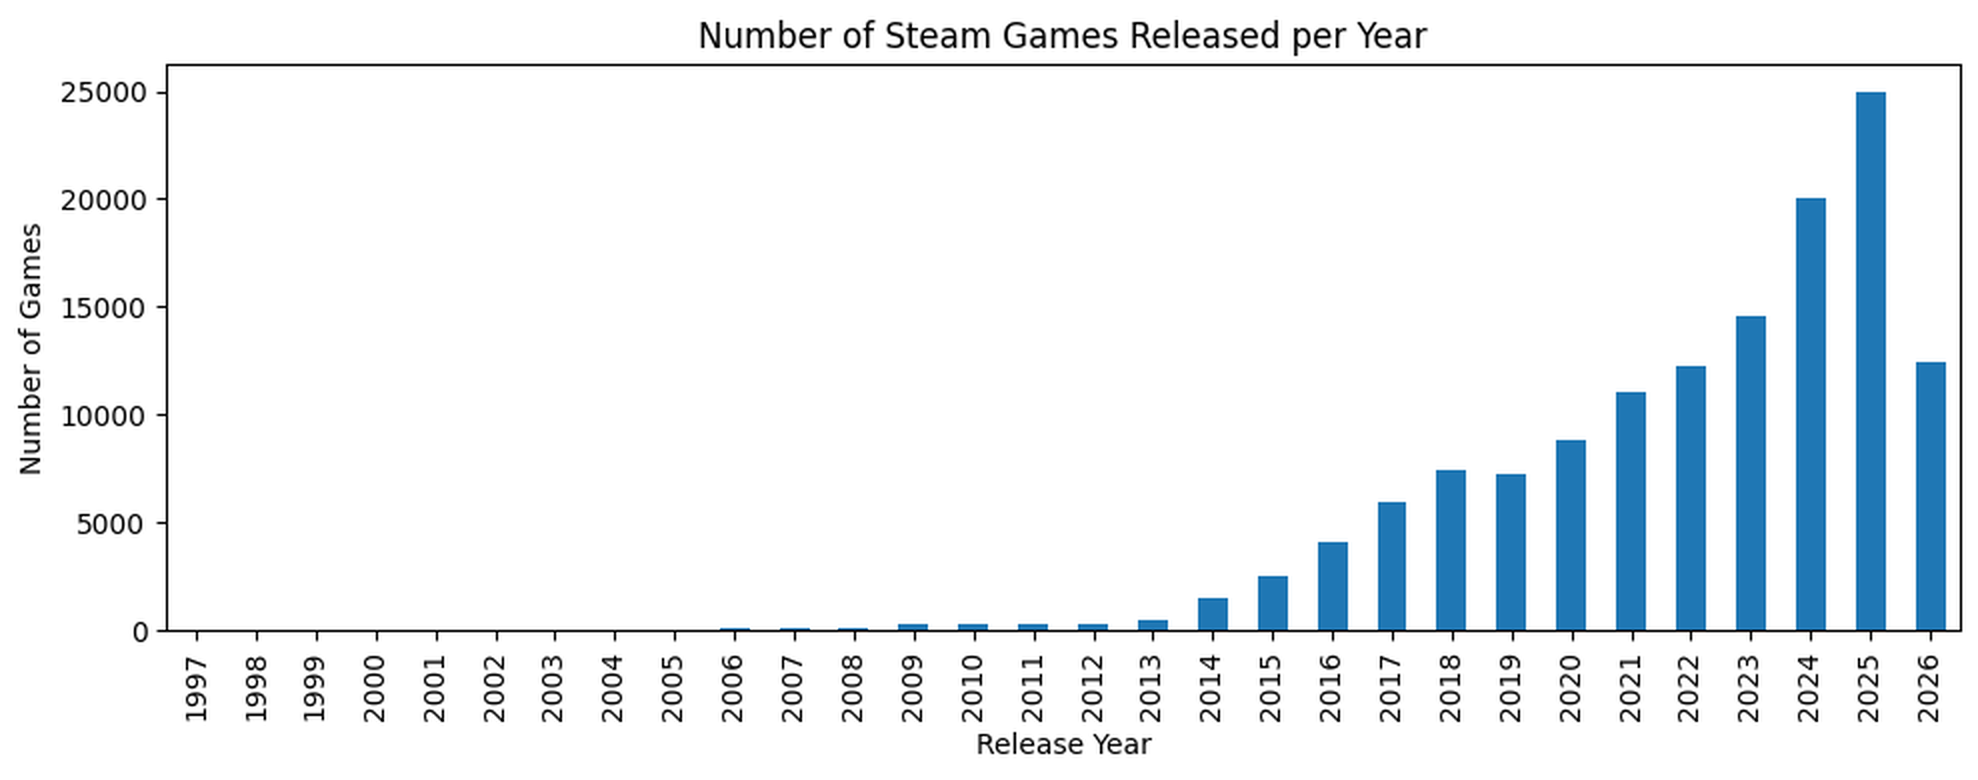
The sample covers the release time span of games from 1997 to 2026, but the number of games has increased sharply in recent years (Figure 1). Since the recently released games dominate the sample, I have independently evaluated the later released game groups, rather than relying solely on the random split.
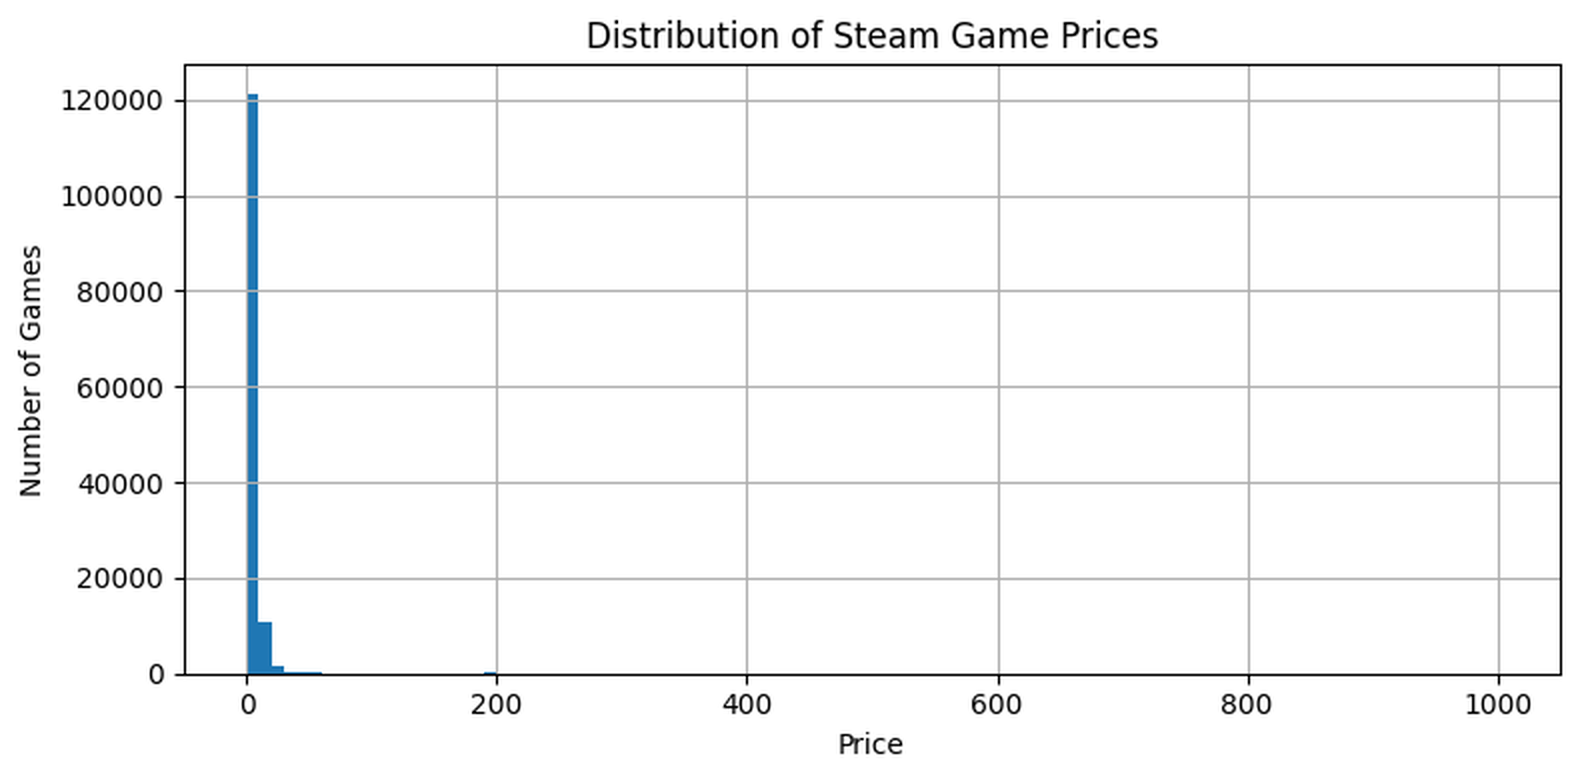
Listed price was strongly right-skewed. The median was $2.49, the 75th percentile was $5.99, and the 99th percentile was $29.99. The maximum value is $999.99. Although these extreme values are retained, they limit the confidence in the interpretation of the error measure.
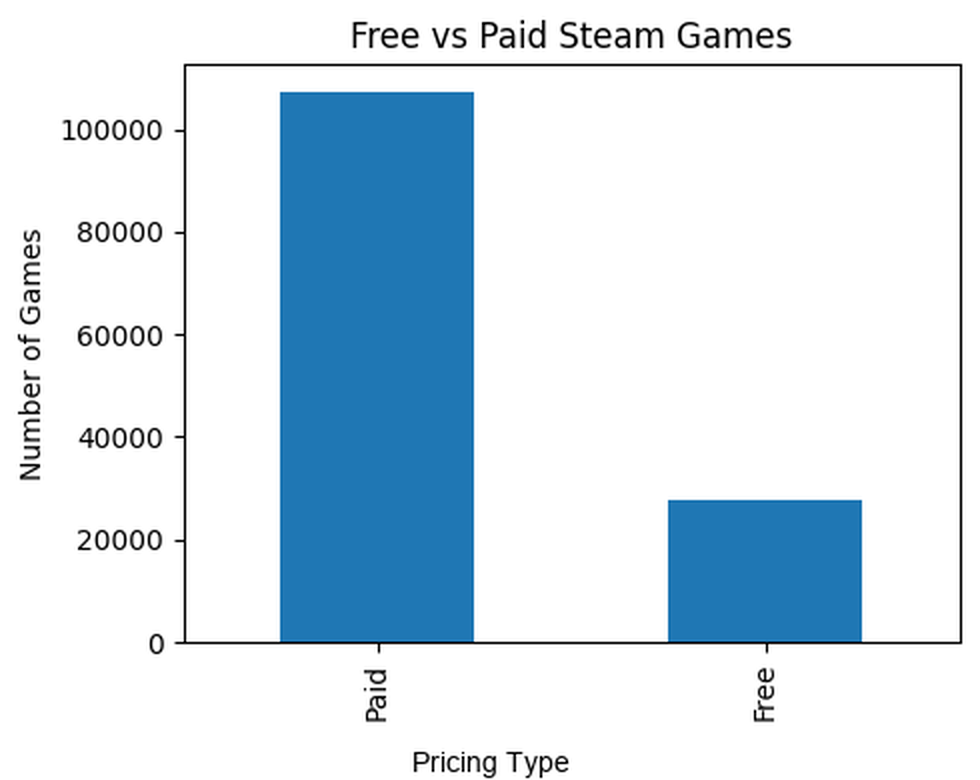
Of the 135,043 records, 27,838 had a listed price of zero and 107,205 had a positive price. Neither group was removed.
Review counts, playtime, ownership, and achievements were also highly dispersed, which motivated the transformations described below.
Data Preprocessing and Feature Engineering
Data Cleaning
I did not delete the fields that based on a missingness cutoff. Instead, I excluded the fields by data types and research scope: detailed_description, about_the_game, short_description, reviews, header_image, website, support_url, support_email, metacritic_url, notes, supported_languages, full_audio_languages, packages, screenshots, movies, and score_rank were URLs, media, long text, or otherwise unsuitable for the tabular model. No numerical values were imputed, and all 135,043 rows entered the main analysis. The selected JSON fields contained no pandas null values, although developers, publishers, genres, categories, and tags could be empty; the respective counts were 8,451, 8,849, 8,433, 8,973, and 51,667 games. Empty genre, category, and tag lists were coded as zero. Reported zeros were also retained, including 27,838 zero prices, 115,354 zero peak-CCU values, and 93,484 zero current discounts. This treatment preserves the original data but cannot resolve situations where zero may mean either “none” or “not recorded”.
Free games were retained by defining the target as log(price + 1). Separate indicators for Windows, Mac, and Linux were retained as well as a summary statistics of the number of platforms, so different operating system combinations were not merely measured by the quantity.
Variable Transformation and Feature Construction
I converted the raw fields into model inputs in the following five stages:
I use the time period corresponding to all recorded release dates to construct the release-year variable.
I converted the list-valued genre, category, and tag fields into three count variables by recording the number of entries in each list.
I replace each SteamSpy-owner range with its midpoint. For example, the range of 0–20,000 is encoded as 10,000.
Owner midpoint, peak CCU, positive and negative reviews, recommendations, achievements, DLC count, and the four playtime measures were transformed with log(x + 1).
Listed price was transformed with log(price + 1), which retained zero-priced games.
Twenty-two variables were included in the full model. To isolate the obvious impact of activities, which is after the release, such as discount event, I refit the model without ownership, reviews, recommendations, CCU, or playtime. Tags, categories, achievements, and platform support still remained in the data, but these information also came from the current snapshot and may have changed since release. Thus, the resulting comparison measured the loss of engagement information and did not reconstruct the available information on launch day.
For the grouped analysis, variables were assigned to content, engagement, platform, temporal, review-score, and other metadata categories. These groups were used only to summarize importance; they did not identify causal effects.
| Variable | Definition | Example |
| Required age | Minimum age listed by Steam | 0; 18 |
| Estimated owners midpoint | Midpoint of the SteamSpy owner range | Range 0-20,000; midpoint 10,000 |
| Peak CCU | Highest concurrent-user count | 496 |
| DLC count | Number of listed DLC items | 0; 25 |
| Positive reviews | Number of positive reviews | 252 |
| Negative reviews | Number of negative reviews | 20 |
| Achievements | Number of listed achievements | 100 |
| Recommendations | Number of recommendations | 38 |
| Average lifetime playtime | Mean lifetime playtime in minutes | 342 minutes |
| Average two-week playtime | Mean playtime in the previous two weeks | 173 minutes |
| Median lifetime playtime | Median lifetime playtime in minutes | 86 minutes |
| Median two-week playtime | Median playtime in the previous two weeks | 139 minutes |
| Platform variables | Windows, Mac, Linux, and supported-system count | Windows = 1; count = 2 |
| Release year | Year extracted from release date | 2024 |
| Genre count | Number of listed genres | 3 |
| Category count | Number of listed categories | 5 |
| Tag count | Number of listed tags | 12 |
| Target | log(price + 1) | $0 becomes 0 |
Model Development
Four models were fitted: a mean-prediction baseline, Linear Regression, Random Forest, and Gradient Boosting.
The random split assigned 80% of observations to training and 20% to testing, with random_state = 42. Random Forest used 200 trees, a maximum depth of 20, and random_state = 1. Gradient Boosting used 300 estimators, a learning rate of 0.05, a maximum depth of 3, and random_state = 42. MSE, RMSE, MAE, and R² were reported on the log(price + 1) scale. Five-fold cross-validation provided an additional check on the random split.
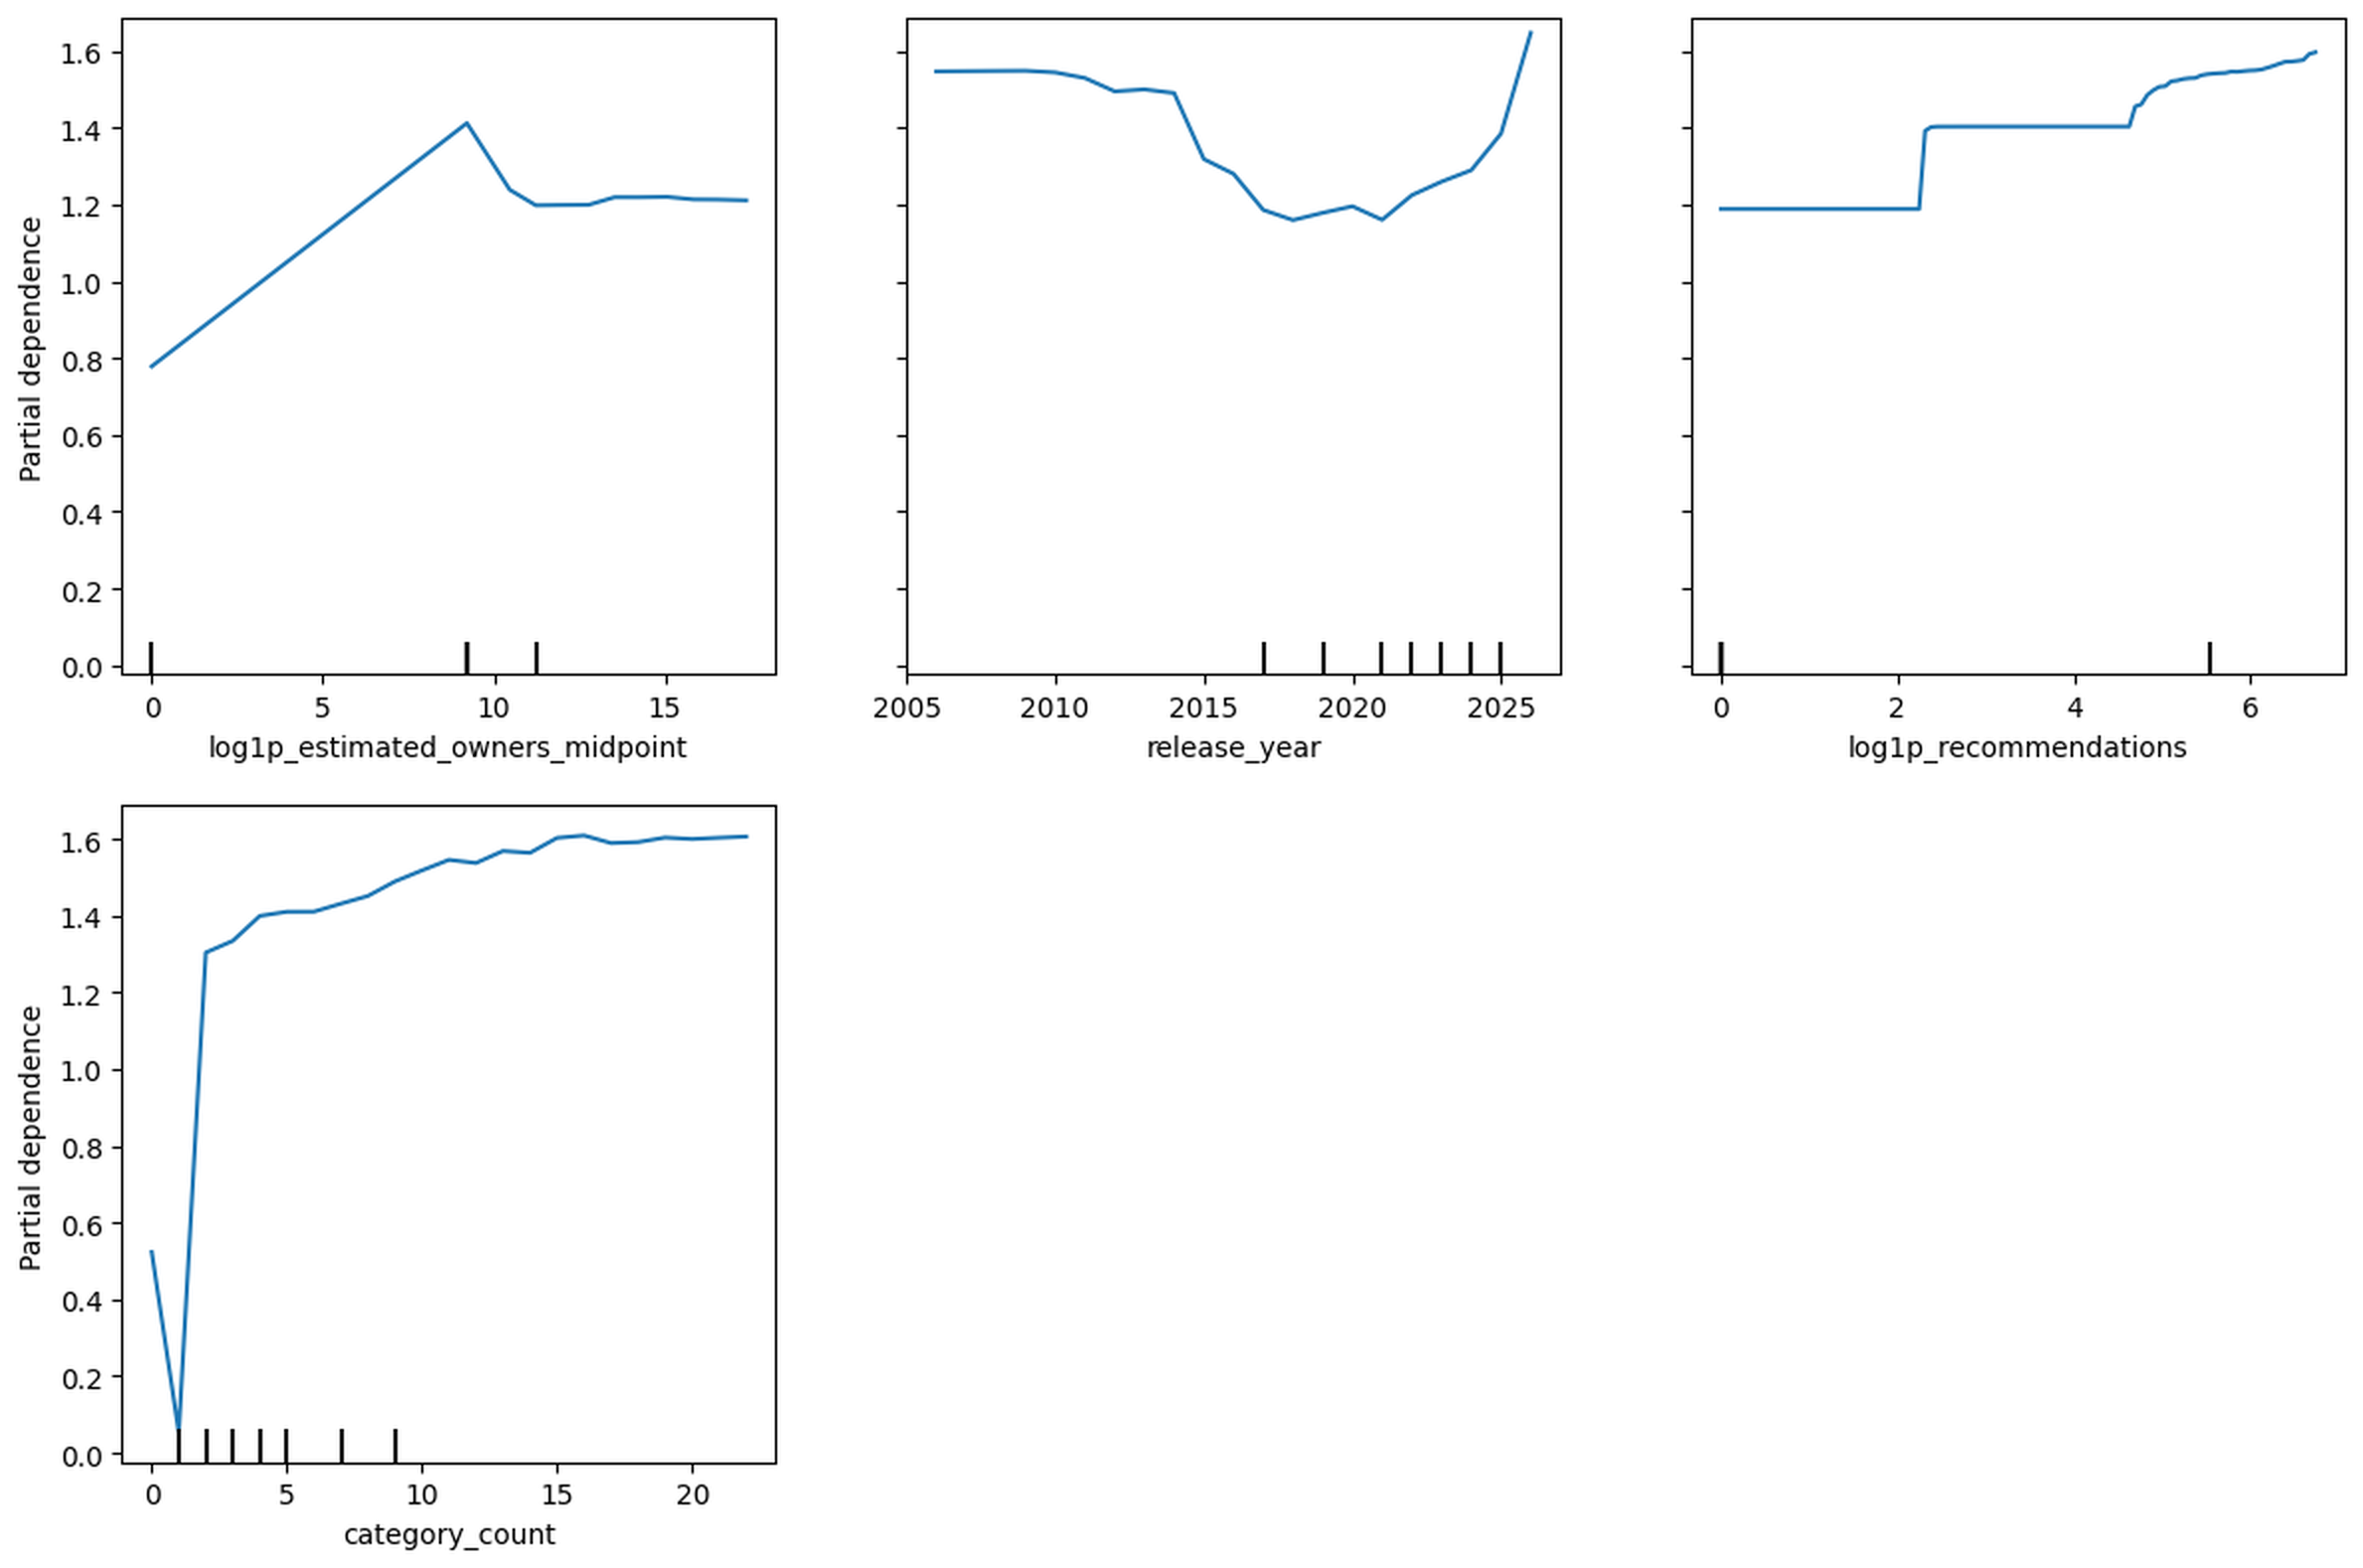
I examined feature importance in three ways: Random Forest impurity importance, permutation importance, and SHAP. The SHAP calculation used a fixed sample of 2,000 observations from the held-out set, and partial dependence plots were used to inspect the fitted patterns of selected variables. For the temporal check, the training sample ended in 2025 and the test sample consisted of games released in 2026.
To test if current market context provided predictive information, I fitted a independent sensitivity model with the available proxies–developer and publisher portfolio size, current discount, and indicators for the ten most common genres. Portfolio size was defined as the number of games that associated with the developer or publisher in the current dataset. These measures were not attributes of the games when they were released, and did not replace unavailable regional prices, marketing expenditure, development budgets, or historical discount.
Results
Random Forest achieved the best performance on the held-out test set: MSE = 0.512, RMSE = 0.716, MAE = 0.532, and R² = 0.421. Gradient Boosting ranked second (R² = 0.385), followed by Linear Regression (R² = 0.206). Each model improved on the mean baseline.
Across five folds, Random Forest achieved a mean R² of 0.399 (SD = 0.078) and a mean MSE of 0.536 (SD = 0.066). One fold fell to R² = 0.243, showing that performance varied across partitions.
Removing the obvious post-release engagement measures lowered R² to 0.279. The full model reached 0.421, but part of that gain came from variables that may themselves depend on price, marketing, popularity, and time since release. The simplified model is not regarded as a real launch time prediction.
The time split is far less successful than expected. Training on releases through 2025 and testing on 2026 games produced MSE = 0.866, RMSE = 0.931, MAE = 0.741, and R² = -0.082. The negative R² value indicates that the model’s performance in the late cohort is inferior to the average baseline level.
Therefore, the random-split results are useful for describing this dataset, not for predicting future prices.
| Model | MSE | RMSE | MAE | R² |
| Dummy mean baseline | 0.8857 | 0.9411 | 0.7873 | 0.0000 |
| Linear Regression | 0.7034 | 0.8387 | 0.6829 | 0.2058 |
| Random Forest | 0.5124 | 0.7158 | 0.5316 | 0.4214 |
| Gradient Boosting | 0.5450 | 0.7382 | 0.5696 | 0.3846 |
Although the absolute values obtained by the three importance measurement methods are different, the corresponding dominant groups are similar. The importance of impurities obtained by the category counting method (0.322). The midpoint value calculated by the estimation owner method corresponds to both the supposition importance (R² decreases 0.415) and the average absolute SHAP value (0.202).
The SHAP then ranked category count (0.172), release year (0.156), recommendations (0.148) and positive reviews (0.086). These variables also ranked first in the analysis of the importance of replacement. The variable “required age” did not enter the top 15 under both analysis methods.
| Feature | Permutation importance | Mean |SHAP| |
| Estimated owners midpoint (log1p) | 0.4146 | 0.2019 |
| Release year | 0.2728 | 0.1560 |
| Recommendations (log1p) | 0.2719 | 0.1476 |
| Category count | 0.2476 | 0.1725 |
| Positive reviews (log1p) | 0.1340 | 0.0859 |
| Genre count | 0.0871 | 0.0404 |
| Achievements (log1p) | 0.0622 | 0.0700 |
| Median lifetime playtime (log1p) | 0.0317 | 0.0240 |
| Tag count | 0.0279 | 0.0220 |
| Negative reviews (log1p) | 0.0272 | 0.0168 |
At the group level, the content variable explains 0.504 of the total importance of impurities, while the participation variable explains 0.336. Since there is a correlation between multiple predictors, these total values should be regarded as descriptive aggregate indicators, rather than evidence that a group has determined pricing.
RMSE = 0.716 is measured on the log (price + 1) scale, not in dollars. The value is roughly equivalent to the factor exp(0.716) = 2.05 in price + 1, so from the perspective of practical application, its typical error is still large.
| Category | Included features | Sum of impurity importance |
| Content complexity | Genres, categories, tags, achievements | 0.5038 |
| Engagement | Owners, CCU, reviews, recommendations, playtime | 0.3358 |
| Temporal | Release year | 0.0931 |
| Platform | Windows, Mac, Linux, platform count | 0.0382 |
| Other metadata | Required age, DLC count | 0.0246 |
| Review-score metadata | Metacritic score, user score | 0.0044 |
The extended synchronous agent model raises the test R² value from 0.421 to 0.625 and reduces the MSE value from 0.512 to 0.332 (RMSE = 0.576; MAE = 0.393). Its leading new variables include: Free To Play genre status (impurity importance = 0.254), developer portfolio size (0.101), current discount (0.086) and publisher portfolio size (0.044). This improvement should be interpreted carefully: the status of free games directly corresponds to the zero-pricing business model; the current discount rate is measured under the condition of synchronization with the price; and the size of the portfolio is calculated based on the current data set, not on the information available at the time of game release.
Discussion
Predictive Performance and Generalization
Random forests can capture the law of price change better than linear regression, which shows that there is a nonlinear relationship in metadata. Even so, R² = 0.421 leaves about 58% of log-price variation unexplained. The negative time-split R² is a stronger warning signal: the performance on the random test set does not continue to the subsequent data set.
Content and Engagement Associations
When all impurity importance indicators are summarized by group, the weight of the content variable is 0.504, and the number of categories accounts for the highest proportion in the group. However, the alternative sorting results are different: the estimated owner ranks first, and the release year and recommendations rank second. This difference reflects the different evaluation criteria used by the two methods and the overlap between the predicted variables. None of the above sorting results can accurately predict how the price will change after the developer adds categories, results or comments.
Reduced-Engagement and Full Models
The R² value of the complete model is 0.421, while the R² value of the model after removing the selected participation variable is 0.279. This difference shows that in the current data sample, all current permissions and participation variables contain predictive information; however, this does not allow the simplified model to be directly used for predictions at the time of release, because labels, categories, achievements and platform support may also change after the product is released.
Proxy-Variable Sensitivity Check
After introducing the available platform, discount and categories variables, the $R^2$ value rises to 0.625. This result confirms that the missing market background factors have an important impact, but a better listing pricing model has not been built.The Free To Play indicator is closely linked to a zero price, and the other proxies are measured from the same present-day snapshot. Their importance is evidence of contemporaneous association, not a causal brand, discount, or genre effect.
Platform and Age Variables
Platform variables contribute little to impurity importance (0.038), and required age is not a leading predictor. The results do not support using age restriction as a stand-in for budget, production quality, or willingness to pay.
Robustness and Practical Use
Cross-validation broadly agrees with the random test split, although the fold results vary. The time split does not. For that reason, the model is better suited to describing broad patterns than to recommending prices for new games.
Practical Implications
For developers, these results reveal the rules in the current product list; and after collecting user comments or adding metadata, these rules are no longer applicable. Early research also shows that the pricing and performance of games are affected by time, demand, competition and platform architecture15,16,6.
For variables such as platform, content and user participation, these indicators help to summarize the current market situation. This article does not test the ranking algorithm, nor does it verify the depth score of the content.
No measure of consumer value was included in the dataset. A higher listed price or a longer tag list therefore cannot be read as evidence of better quality or value; production quality, development cost, and player satisfaction were not observed.
Limitations and Future Directions
Several data limitations restrict the claims. First, only one cross-sectional snapshot cannot establish causal direction, or recover the visible metadata on a game’s release date. Second, the source contains several empty strings, empty lists, and numerical zeros which did not consistently distinguish none from not recorded. Third, owner counts are interval estimates represented by midpoints, and the sample retains prices as high as $999.99. The three importance measures are also sensitive to correlated predictors and, in the case of impurity and SHAP values, to the fitted model. Finally, the model’s poor performance on the later release group limits its use beyond the observed snapshot.
Regional prices, marketing expenditure, development budgets, and historical discount are not available in this dataset. Developer and publisher names, current discount, and genre labels are available only the metadata which were collected on the present day, and can serve as limited proxies in a contemporaneous robustness check. Future work needs historical launch snapshots, transaction prices, regional prices, marketing measures, and publisher or developer histories. Any practical model should be tested repeatedly on later release data.
Conclusion
On the random 20% test set, Random Forest outperformed Linear Regression and explained 42.1% of the variation in log(price + 1). Permutation importance and SHAP identified the same leading set of variables: estimated owners, category count, release year, recommendations, and positive reviews. Adding present-day developer, publisher, discount, and genre proxies increased R² to 0.625, although the Free To Play indicator directly marked a zero-price business model and the other additions were also contemporaneous. The reduced-engagement model did not reproduce launch conditions, and the 2026 test performed below the mean baseline. The results describe associations in the observed Steam snapshot; they do not yield a causal pricing rule or a dependable forecast for new releases.
References
- V. Shankar and B. L. Bayus. Network effects and competition: an empirical analysis of the home video game industry. Strategic Management Journal. Vol. 24, no. 4, pp. 375-384, 2003. https://doi.org/10.1002/smj.296. [↩]
- M. T. Clements and H. Ohashi. Indirect network effects and the product cycle: video games in the U.S., 1994-2002. Journal of Industrial Economics. Vol. 53, no. 4, pp. 515-542, 2005. https://doi.org/10.1111/j.1467-6451.2005.00268.x. [↩]
- J. L. G. Binken and S. Stremersch. The effect of superstar software on hardware sales in system markets. Journal of Marketing. Vol. 73, no. 2, pp. 88-104, 2009. https://doi.org/10.1509/jmkg.73.2.88. [↩]
- K. S. Corts and M. Lederman. Software exclusivity and the scope of indirect network effects in the U.S. home video game market. International Journal of Industrial Organization. Vol. 27, no. 2, pp. 121-136, 2009. https://doi.org/10.1016/j.ijindorg.2008.08.002. [↩]
- V. Landsman and S. Stremersch. Multihoming in two-sided markets: an empirical inquiry in the video game console industry. Journal of Marketing. Vol. 75, no. 6, pp. 39-54, 2011. https://doi.org/10.1509/jm.09.0199. [↩]
- C. Cennamo and J. Santalo. Platform competition: strategic trade-offs in platform markets. Strategic Management Journal. Vol. 34, no. 11, pp. 1331-1350, 2013. https://doi.org/10.1002/smj.2066. [↩] [↩]
- R. S. Lee. Vertical integration and exclusivity in platform and two-sided markets. American Economic Review. Vol. 103, no. 7, pp. 2960-3000, 2013. https://doi.org/10.1257/aer.103.7.2960. [↩]
- J. Rietveld and J. P. Eggers. Demand heterogeneity in platform markets: implications for complementors. Organization Science. Vol. 29, no. 2, pp. 304-322, 2018. https://doi.org/10.1287/orsc.2017.1183. [↩]
- J. Rietveld, J. N. Ploog, and D. B. Nieborg. The coevolution of platform dominance and governance strategies: effects on complementor performance outcomes. Academy of Management Discoveries, 2020. https://doi.org/10.5465/amd.2019.0064. [↩]
- C. Cennamo, H. Ozalp, and T. Kretschmer. Platform architecture and quality trade-offs of multihoming complements. Information Systems Research. Vol. 29, no. 2, pp. 461-478, 2018. https://doi.org/10.1287/isre.2018.0779. [↩]
- J. Rietveld, M. A. Schilling, and C. Bellavitis. Platform strategy: managing ecosystem value through selective promotion of complements. Organization Science. Vol. 30, no. 6, pp. 1232-1251, 2019. https://doi.org/10.1287/orsc.2019.1290. [↩]
- R. T. Gretz, A. Malshe, C. Bauer, and S. Basuroy. The impact of superstar and non-superstar software on hardware sales: the moderating role of hardware lifecycle. Journal of the Academy of Marketing Science. Vol. 47, no. 3, pp. 394-416, 2019. https://doi.org/10.1007/s11747-019-00631-3. [↩]
- D. Lin, C.-P. Bezemer, and A. E. Hassan. An empirical study of early access games on the Steam platform. Empirical Software Engineering. Vol. 23, no. 2, pp. 771-799, 2018. https://doi.org/10.1007/s10664-017-9531-3. [↩]
- D. Lin, C.-P. Bezemer, Y. Zou, and A. E. Hassan. An empirical study of game reviews on the Steam platform. Empirical Software Engineering. Vol. 24, no. 1, pp. 170-207, 2019. https://doi.org/10.1007/s10664-018-9627-4. [↩] [↩]
- H. Nair. Intertemporal price discrimination with forward-looking consumers: application to the US market for console video-games. Quantitative Marketing and Economics. Vol. 5, no. 3, pp. 239-292, 2007. https://doi.org/10.1007/s11129-007-9026-4. [↩] [↩]
- H. Liu. Dynamics of pricing in the video game console market: skimming or penetration? Journal of Marketing Research. Vol. 47, no. 3, pp. 428-443, 2010. https://doi.org/10.1509/jmkr.47.3.428. [↩] [↩]
- J. Cox. What makes a blockbuster video game? An empirical analysis of US sales data. Managerial and Decision Economics. Vol. 35, no. 3, pp. 189-198, 2014. https://doi.org/10.1002/mde.2608. [↩]
- J. A. Chevalier and D. Mayzlin. The effect of word of mouth on sales: online book reviews. Journal of Marketing Research. Vol. 43, no. 3, pp. 345-354, 2006. https://doi.org/10.1509/jmkr.43.3.345. [↩]
- C. Dellarocas, X. Zhang, and N. F. Awad. Exploring the value of online product reviews in forecasting sales: the case of motion pictures. Journal of Interactive Marketing. Vol. 21, no. 4, pp. 23-45, 2007. https://doi.org/10.1002/dir.20087. [↩]
- W. Duan, B. Gu, and A. B. Whinston. Do online reviews matter? An empirical investigation of panel data. Decision Support Systems. Vol. 45, no. 4, pp. 1007-1016, 2008. https://doi.org/10.1016/j.dss.2008.04.001. [↩]
- C. Forman, A. Ghose, and B. Wiesenfeld. Examining the relationship between reviews and sales: the role of reviewer identity disclosure in electronic markets. Information Systems Research. Vol. 19, no. 3, pp. 291-313, 2008. https://doi.org/10.1287/isre.1080.0193. [↩]
- X. Li and L. M. Hitt. Self-selection and information role of online product reviews. Information Systems Research. Vol. 19, no. 4, pp. 456-474, 2008. https://doi.org/10.1287/isre.1070.0154. [↩]
- A. Ghose and P. G. Ipeirotis. Estimating the helpfulness and economic impact of product reviews: mining text and reviewer characteristics. IEEE Transactions on Knowledge and Data Engineering. Vol. 23, no. 10, pp. 1498-1512, 2011. https://doi.org/10.1109/TKDE.2010.188. [↩]
- N. Archak, A. Ghose, and P. G. Ipeirotis. Deriving the pricing power of product features by mining consumer reviews. Management Science. Vol. 57, no. 8, pp. 1485-1509, 2011. https://doi.org/10.1287/mnsc.1110.1370. [↩]
- N. A. Ho-Dac, S. J. Carson, and W. L. Moore. The effects of positive and negative online customer reviews: do brand strength and category maturity matter? Journal of Marketing. Vol. 77, no. 6, pp. 37-53, 2013. https://doi.org/10.1509/jm.11.0011. [↩]
- F. Zhu and X. Zhang. Impact of online consumer reviews on sales: the moderating role of product and consumer characteristics. Journal of Marketing. Vol. 74, no. 2, pp. 133-148, 2010. https://doi.org/10.1509/jm.74.2.133. [↩]
- W. W. Moe and M. Trusov. The value of social dynamics in online product ratings forums. Journal of Marketing Research. Vol. 48, no. 3, pp. 444-456, 2011. https://doi.org/10.1509/jmkr.48.3.444. [↩]
- G. Y. Ban and N. B. Keskin. Personalized dynamic pricing with machine learning: high-dimensional features and heterogeneous elasticity. Management Science. Vol. 67, no. 5, pp. 2719-2738, 2021. https://doi.org/10.1287/mnsc.2020.3680. [↩]
- Y. Wang, B. Chen, and D. Simchi-Levi. Multimodal dynamic pricing. Management Science. Vol. 67, no. 10, pp. 6010-6024, 2021. https://doi.org/10.1287/mnsc.2020.3819. [↩]
- H. Bastani, D. Simchi-Levi, and R. Zhu. Meta dynamic pricing: transfer learning across experiments. Management Science. Vol. 68, no. 12, pp. 8675-8697, 2022. https://doi.org/10.1287/mnsc.2021.4071. [↩]
- M. Bustos. Steam Games Dataset. Kaggle, 2024. https://www.kaggle.com/datasets/fronkongames/steam-games-dataset. [↩] [↩]