
Abstract
Aging is a biological decline in the body, gradually impairing cellular function and raising susceptibility to disease. While age-prediction models can aid in the diagnosis and treatment of different medical conditions, many are hindered by poor data quality, lack of generalizability for a wide variety of samples, and inherent biases, reducing the confidence of applications in real-world situations. To address this issue, AGEOptimizer seeks to enhance the robustness of genomic age prediction through improved data preprocessing, progressive hyperparameter tuning, and rigorous model selection. Compared with the baseline XGBoost model evaluated in this study, AGEOptimizer reduced overall mean absolute error (MAE) by 12.37% and reduced MAE by 46.17% in the best-performing tissues. In the GTEx dataset, AGEOptimizer achieved its lowest prediction error in the brain amygdala, substantia nigra, and cortex. While AGEOptimizer predicted healthy tissue age with low error, predicted ages for low-grade glioma (LGG) samples were approximately 26% greater than their chronological ages. This difference suggests that LGG samples may share transcriptomic features with healthy tissues from older individuals. Overall, AGEOptimizer improved transcriptomic age prediction across the datasets examined in this study. Although additional validation using independent datasets is needed, these results suggest that systematic optimization can improve transcriptomic age-prediction performance.
Keywords: Biological Age, Machine Learning, GTEx, RNA-Seq, Hyperparameter Optimization, Low-Grade Glioma (LGG)
Introduction
Aging in humans is the temporal change in the body’s functions to meet physiological demands1. Thus, it is also the main risk factor in many prevalent diseases such as cancer, cardiovascular disease2, and neurodegeneration3,4. These conditions are classified as age-related diseases due to their strong association with transcriptomic changes and increasing incidence with age3,4,5. Therefore, understanding how aging contributes to disease risk has important implications for both biological research and clinical medicine.
The widespread use of high-throughput RNA sequencing has produced large transcriptomic datasets from many human tissues6. These datasets have enabled researchers to study age-related changes in gene expression and develop models that predict biological age from transcriptomic profiles rather than chronological age alone7,8,9,10,11. Early transcriptomic aging studies demonstrated that gene expression profiles could be used to estimate chronological age across multiple tissues9,10,11, while more recent studies have improved prediction accuracy using machine-learning methods trained on large transcriptomic datasets12,13.
Predicting biological age from transcriptomic data remains challenging. Gene expression datasets contain tens of thousands of genes, and expression patterns vary across tissues. Differences in preprocessing methods, feature-selection approaches14,15,16, and optimization procedures17,18,19 also make it difficult to compare results across studies. In addition, the high dimensionality of transcriptomic data and variation between datasetscan reduce model performance and limit how well models generalize to new data20,21,22,23.
Although previous studies have developed machine-learning models for transcriptomic age prediction12,13, most have focused on improving the performance of a single prediction model. Other studies have examined feature selection separately14,15,16. Model interpretation24 and optimization17,18,19have likewise been investigated independently. Few studies have evaluated how combining standardized preprocessing, systematic model selection, and staged hyperparameter tuning influences transcriptomic age-prediction performance across multiple machine-learning algorithms17,18,19.
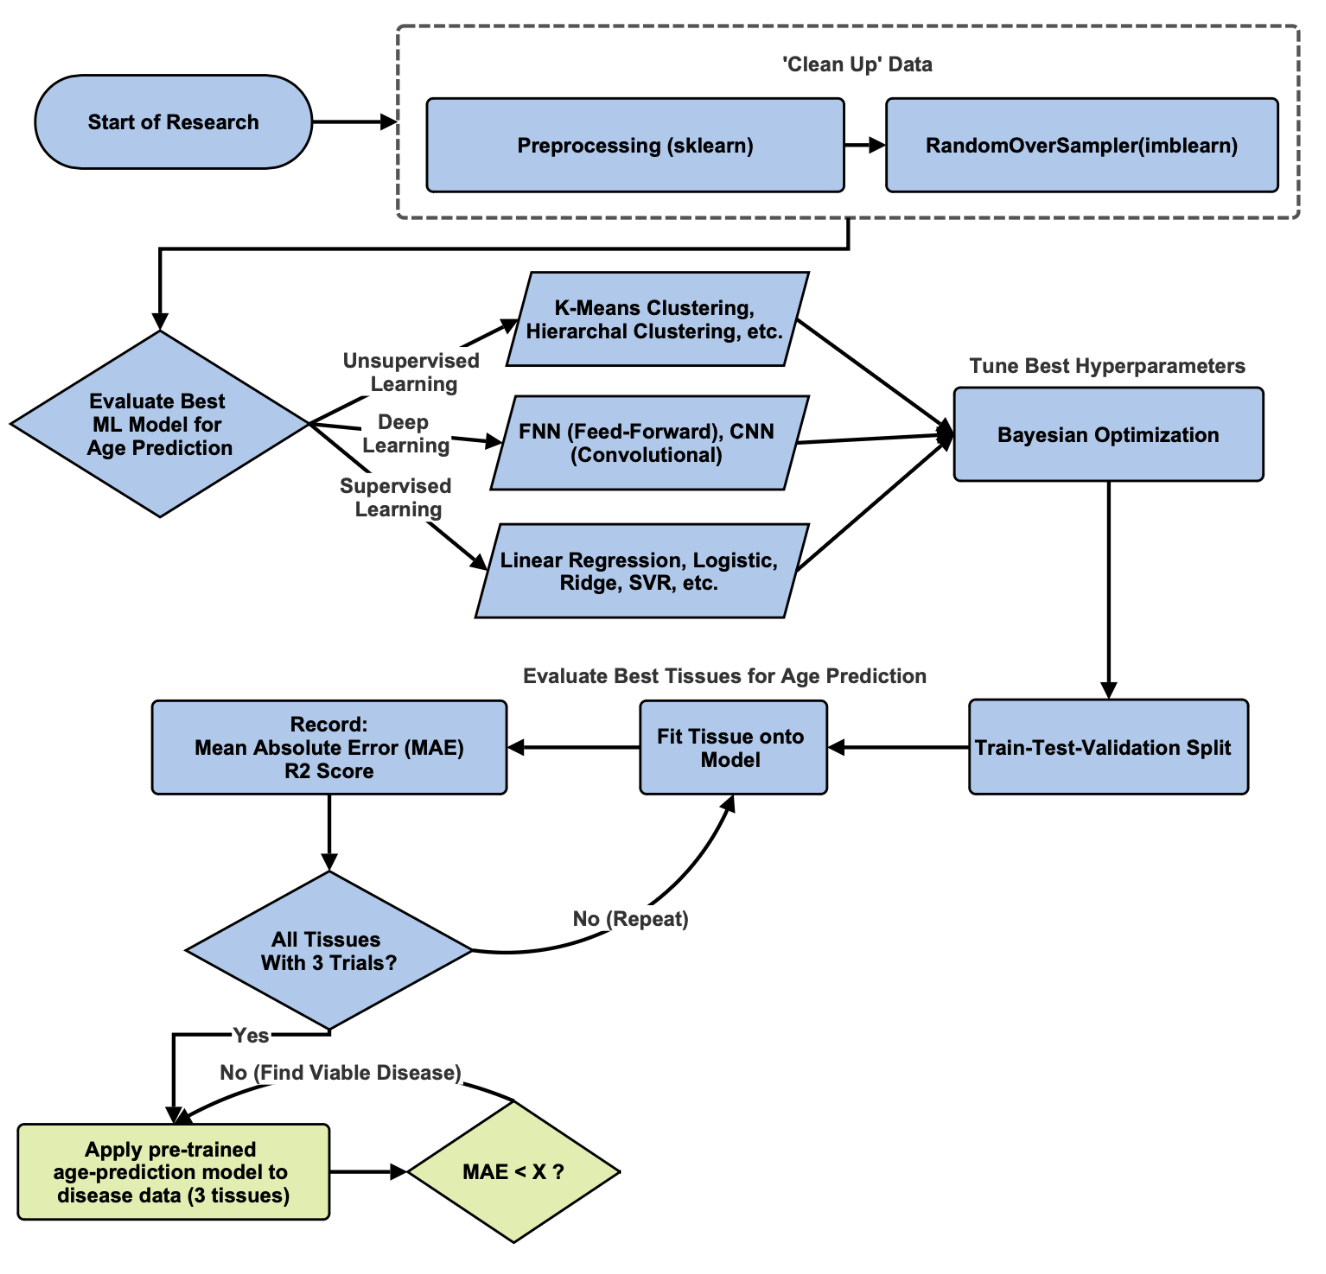
To address this, we developed AGEOptimizer, an optimization framework for transcriptomic age prediction. Figure 1 summarizes the overall workflow of the study. GTEx RNA-seq data were first preprocessed, and several machine-learning models were compared to identify the best-performing approach. Following staged hyperparameter optimization, the final model was evaluated across multiple tissue types and then applied to low-grade glioma (LGG) samples to compare predicted biological age with chronological age
Methods
Data Collection and Preprocessing
Gene expression data were obtained from the GTEx v10 repository and included 56,304 genes across multiple healthy human tissue types. For disease analysis, RNA-sequencing data from 506 Low-Grade Glioma (LGG) patient samples were obtained from The Cancer Genome Atlas (TCGA)25. Only genes shared between the GTEx and TCGA datasets (approximately 36,000 genes) were retained for subsequent analyses.
The age-prediction model was developed exclusively using GTEx samples. The GTEx dataset was randomly divided at the sample level into training (70%), validation (15%), and test (15%) sets, while the LGG samples were kept separate and used only after model development had been completed.
To normalize the data, gene expression values were log-transformed using log₂(x + 0.001). The data were then feature-scaled before model training. Keeping the LGG dataset separate throughout model development helped prevent information leakage and ensured that disease samples did not influence model training or optimization.
Model Development
Several machine-learning algorithms with different levels of complexity, including Linear Regression, Ridge Regression, Lasso Regression, Elastic Net, a feedforward Neural Network, and XGBoost, were compared to determine which framework performed best for transcriptomic age prediction. All models were trained using the same preprocessed GTEx dataset and identical training, validation, and test splits. Model performance was evaluated using mean absolute error (MAE). Among the models tested, XGBoost produced the lowest validation MAE and was selected for further optimization.
To further refine the selected model, a three-stage hyperparameter tuning process was employed. In the first stage, model complexity parameters (max_depth and min_child_weight) were adjusted. In the second stage, regularization and subsampling parameters (subsample and colsample_bytree) were tuned. Finally, in the third stage, the learning parameters (n_estimators and eta) were optimized. Dividing the hyperparameter search into stages reduced the search space while allowing improvements from earlier stages to be carried forward into later ones.
Hyperparameter tuning was performed using the Optuna framework19, with validation MAE used as the optimization objective. Early stopping was employed during hyperparameter optimization to reduce overfitting. The parameter combination that achieved the lowest validation MAE was selected for the final model. The final optimized model was then evaluated on the held-out test set before being applied to tissue-specific and LGG analyses.
Benchmarking
To evaluate performance, AGEOptimizer was compared with a baseline XGBoost model trained using the same dataset and data split but with default hyperparameters rather than the staged optimization procedure. Model performance was evaluated using mean absolute error (MAE), which measures the average difference between predicted biological age and chronological age. Lower MAE values indicate more accurate age prediction.
Tissue-Specific Performance Analysis
To identify the tissues in which the model performed most accurately, MAE values were compared across all GTEx tissue types. Tissues with the lowest MAE were considered to have the lowest prediction error.
LGG Disease Analysis
For the disease analysis, AGEOptimizer was applied to gene expression data from LGG samples after the model had been developed using only GTEx data. Predicted biological ages for the LGG samples were compared with those of healthy GTEx brain tissues to determine whether the LGG samples consistently showed higher predicted biological ages than the healthy reference tissues.
Results
Model Development and Hyperparameter Tuning
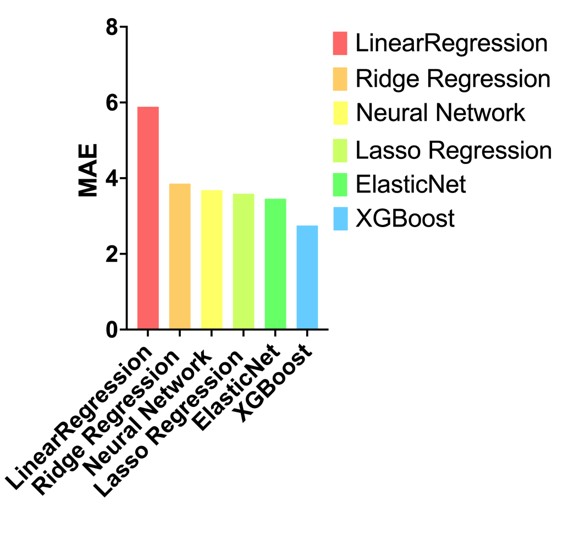
Multiple machine-learning models, including Linear Regression, Ridge Regression, Lasso Regression, Elastic Net, a feedforward Neural Network, and XGBoost, were evaluated using the same preprocessed GTEx dataset and identical training, validation, and test splits. Each model was first trained using its default parameters, and performance was assessed using mean absolute error (MAE). Among the models evaluated, XGBoost had the lowest validation MAE and was selected for further optimization (Figure 2).
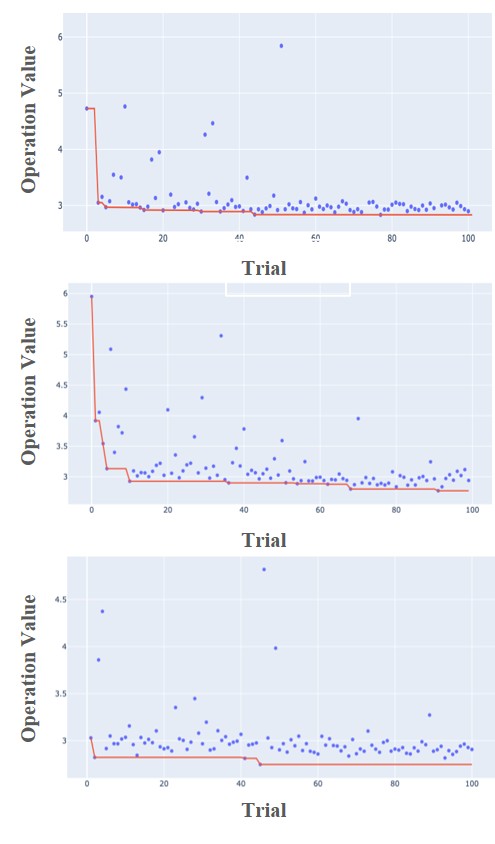
Hyperparameter tuning was performed in three stages. The largest reduction in validation MAE occurred during the first stage, while the second and third stages produced smaller improvements as performance began to level off (Figure 3). Validation MAE decreased from 3.136 for the baseline XGBoost model to 2.927 after the first stage, 2.879 after the second stage, and 2.748 after the final stage (Table 1). Overall, staged hyperparameter tuning improved model performance and resulted in the final AGEOptimizer model.
The optimized XGBoost model had the lowest validation MAE and was used for all subsequent analyses, including benchmarking, tissue-specific performance analysis, and LGG disease analysis
| Optimization Stage | Hyperparameter | Search Range | Selected Value | Validation MAE |
| Baseline | Default XGBoost | Default | Default | 3.136 |
| Stage 1 | max_depth | 3–10 | 5 | 2.927 |
| min_child_weight | 1–300 | 154.82 | ||
| Stage 2 | subsample | 0.5–1.0 | 0.85 | 2.879 |
| colsample_bytree | 0.5–1.0 | 0.68 | ||
| Stage 3 | n_estimators | 100–1500 | 1164 | 2.748 |
| eta | 0.01–0.30 | 0.101 |
Prediction Accuracy and Tissue-Specific Performance
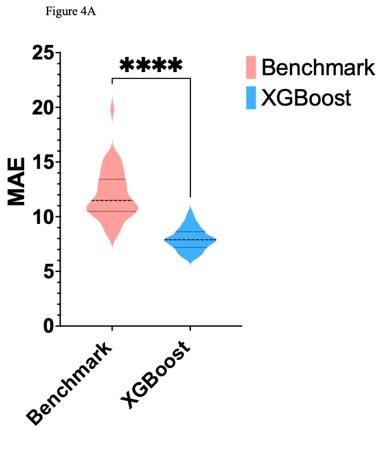
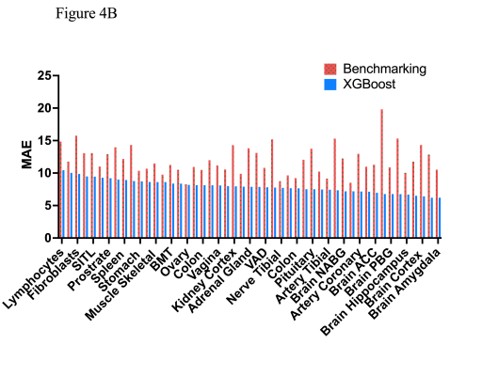
On the held-out test set, AGEOptimizer reduced overall mean absolute error (MAE) by 12.37% compared with the baseline XGBoost model and reduced MAE by 46.17% in the best-performing tissues (Figure 4A). In the tissue-specific analysis, several brain tissues, including the amygdala, substantia nigra, and cortex, showed the lowest MAE values. These tissues therefore showed the lowest prediction error under the AGEOptimizer framework (Figure 4B).
Biological Age Prediction in LGG
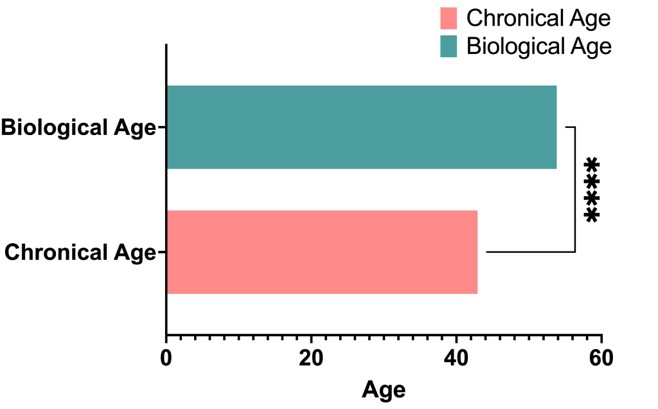
AGEOptimizer predicted healthy GTEx tissue age with an average error of approximately 7%. By comparison, predicted biological ages for the low-grade glioma (LGG) samples were, on average, approximately 26% higher than their chronological ages (Figure 5). This observation suggests that LGG samples differ from healthy tissues in ways that result in higher predicted biological ages under the AGEOptimizer model.
Discussion
In this study, we developed AGEOptimizer to improve transcriptomic age prediction by combining standardized preprocessing, progressive hyperparameter tuning, and systematic model selection. Compared with the baseline model, the optimized framework reduced prediction error throughout the benchmarking analyses. Most of the improvement occurred during the early stages of hyperparameter tuning, while later stages produced smaller gains as performance began to level off. Overall, these findings suggest that systematic optimization can improve transcriptomic age prediction beyond the use of default model settings17,18,19.
Prediction accuracy also varied across tissue types. AGEOptimizer achieved the lowest mean absolute error (MAE) in several brain tissues, particularly the amygdala, substantia nigra, and cortex. These tissues had the lowest prediction errors among those included in the GTEx dataset. However, MAE can also be influenced by factors such as sample size, age distribution, tissue heterogeneity, RNA quality, and other technical differences20,21,22,23. Therefore, these findings reflect model performance within the GTEx dataset and should not be interpreted as evidence that these tissues are inherently more informative for biological aging.
When AGEOptimizer was applied to low-grade glioma (LGG) samples, the predicted biological ages were, on average, higher than the corresponding chronological ages. This suggests that LGG samples share some transcriptomic features with older healthy tissues5,11,12. However, this finding should not be interpreted as evidence that aging causes LGG or that LGG undergoes accelerated biological aging. Because the model was trained only on GTEx data and applied independently to the TCGA-LGG dataset, the observed differences should be interpreted as an association rather than a causal relationship.
This study also has several limitations. The model was developed and evaluated primarily using GTEx data, so additional validation with independent transcriptomic datasets will be needed to determine how well the approach generalizes. Although GTEx and TCGA-LGG were kept separate during model development, differences in sequencing protocols, sample processing, and other technical factors may still contribute to differences between healthy and disease samples20,21,22,23. In addition, while hyperparameter tuning improved model performance, future studies should include donor-level validation and external test datasets to provide a stronger assessment of generalizability.
Future studies should evaluate AGEOptimizer using additional cohorts and tissue types to determine whether these findings can be reproduced in independent datasets. Comparing AGEOptimizer with additional machine-learning models and evaluating its performance across different age groups would also provide a more comprehensive assessment of its robustness. For the LGG analysis, future work should account for factors such as tumor purity, cell-type composition, sequencing batch, and immune infiltration to determine whether the higher predicted ages remain after these variables are considered.
Overall, AGEOptimizer improved transcriptomic age-prediction accuracy within the datasets examined in this study. Although additional validation is still needed, these findings suggest that systematic optimization can improve prediction performance and provide a reproducible framework for transcriptomic age prediction18,19.
In conclusion, AGEOptimizer improved transcriptomic age-prediction accuracy through systematic optimization. The model performed best in several brain tissues within the GTEx dataset and predicted higher biological ages for LGG samples than their chronological ages. Although these findings require further validation, they suggest that systematic optimization can improve transcriptomic age prediction and provide a foundation for future studies of age-related transcriptomic changes.
References
- T. Niccoli, L. Partridge. Ageing as a risk factor for disease. Current Biology. Vol. 22, pg. R741–R752, 2012, https://doi.org/10.1016/j.cub.2012.07.024. [↩]
- B. J. North, D. A. Sinclair. The intersection between aging and cardiovascular disease. Circulation Research. Vol. 110, pg. 1097–1108, 2012, https://doi.org/10.1161/CIRCRESAHA.111.246876. [↩]
- T. Wyss-Coray. Ageing, neurodegeneration and brain rejuvenation. Nature. Vol. 539, pg. 180–186, 2016, https://doi.org/10.1038/nature20411. [↩] [↩]
- C. López-Otín, M. A. Blasco, L. Partridge, M. Serrano, G. Kroemer. The hallmarks of aging. Cell. Vol. 153, pg. 1194–1217, 2013, https://doi.org/10.1016/j.cell.2013.05.039. [↩] [↩]
- J. Wang, et al. Accurate estimation of biological age and its application in disease prediction using a multimodal image transformer system. Proceedings of the National Academy of Sciences of the United States of America. Vol. 121, pg. e2308812120, 2024, https://doi.org/10.1073/pnas.2308812120. [↩] [↩]
- GTEx Consortium. The GTEx Consortium atlas of genetic regulatory effects across human tissues. Science. Vol. 369, pg. 1318–1330, 2020, https://doi.org/10.1126/science.aaz1776. [↩]
- S. Horvath. DNA methylation age of human tissues and cell types. Genome Biology. Vol. 14, pg. R115, 2013, https://doi.org/10.1186/gb-2013-14-10-r115. [↩]
- J. Jylhävä, N. L. Pedersen, S. Hägg. Biological age predictors. EBioMedicine. Vol. 21, pg. 29–36, 2017, https://doi.org/10.1016/j.ebiom.2017.03.046. [↩]
- M. J. Peters, R. Joehanes, L. C. Pilling, et al. The transcriptional landscape of age in human peripheral blood. Nature Communications. Vol. 6, pg. 8570, 2015, https://doi.org/10.1038/ncomms9570. [↩] [↩]
- J. G. Fleischer, R. Schulte, H. H. Tsai, et al. Predicting age from the transcriptome of human dermal fibroblasts. Genome Biology. Vol. 19, pg. 221, 2018, https://doi.org/10.1186/s13059-018-1599-6. [↩] [↩]
- X. Ren, P. F. Kuan. RNAAgeCalc: A multi-tissue transcriptional age calculator. Aging. Vol. 12, pg. 4535–4555, 2020, https://doi.org/10.18632/aging.102900. [↩] [↩] [↩]
- P. Mamoshina, et al. Machine learning on human muscle transcriptomic data for biomarker discovery and tissue-specific drug target identification. Frontiers in Genetics. Vol. 9, pg. 242, 2018, https://doi.org/10.3389/fgene.2018.00242. [↩] [↩] [↩]
- A. Zhavoronkov, P. Mamoshina, Q. Vanhaelen, et al. Deep aging clocks: the emergence of AI-based biomarkers of aging and longevity. Trends in Pharmacological Sciences. Vol. 40, pg. 546–559, 2019, https://doi.org/10.1016/j.tips.2019.05.004. [↩] [↩]
- Y. Saeys, I. Inza, P. Larrañaga. A review of feature selection techniques in bioinformatics. Bioinformatics. Vol. 23, pg. 2507–2517, 2007, https://doi.org/10.1093/bioinformatics/btm344. [↩] [↩]
- I. Guyon, A. Elisseeff. An introduction to variable and feature selection. Journal of Machine Learning Research. Vol. 3, pg. 1157–1182, 2003. [↩] [↩]
- T. Hastie, R. Tibshirani, J. Friedman. The Elements of Statistical Learning: Data Mining, Inference, and Prediction. 2nd ed. Springer, 2009, https://doi.org/10.1007/978-0-387-84858-7. [↩] [↩]
- T. Chen, C. Guestrin. XGBoost: A scalable tree boosting system. Proceedings of the 22nd ACM SIGKDD International Conference on Knowledge Discovery and Data Mining. pg. 785–794, 2016, https://doi.org/10.1145/2939672.2939785. [↩] [↩] [↩] [↩]
- P. Probst, M. N. Wright, A. L. Boulesteix. Hyperparameters and tuning strategies for random forest. Wiley Interdisciplinary Reviews: Data Mining and Knowledge Discovery. Vol. 9, pg. e1301, 2019, https://doi.org/10.1002/widm.1301. [↩] [↩] [↩] [↩] [↩]
- T. Akiba, S. Sano, T. Yanase, T. Ohta, M. Koyama. Optuna: A next-generation hyperparameter optimization framework.Proceedings of the 25th ACM SIGKDD International Conference on Knowledge Discovery and Data Mining. pg. 2623–2631, 2019, https://doi.org/10.1145/3292500.3330701. [↩] [↩] [↩] [↩] [↩] [↩]
- J. T. Leek, R. B. Scharpf, H. C. Bravo, et al. Tackling the widespread and critical impact of batch effects in high-throughput data. Nature Reviews Genetics. Vol. 11, pg. 733–739, 2010, https://doi.org/10.1038/nrg2825. [↩] [↩] [↩]
- W. E. Johnson, C. Li, A. Rabinovic. Adjusting batch effects in microarray expression data using empirical Bayes methods. Biostatistics. Vol. 8, pg. 118–127, 2007, https://doi.org/10.1093/biostatistics/kxj037. [↩] [↩] [↩]
- W. W. B. Goh, W. Wang, L. Wong. Why batch effects matter in omics data, and how to avoid them. Trends in Biotechnology. Vol. 35, pg. 498–507, 2017, https://doi.org/10.1016/j.tibtech.2017.02.012. [↩] [↩] [↩]
- J. T. Leek, J. D. Storey. Capturing heterogeneity in gene expression studies by surrogate variable analysis. PLoS Genetics. Vol. 3, pg. e161, 2007, https://doi.org/10.1371/journal.pgen.0030161. [↩] [↩] [↩]
- S. M. Lundberg, S.-I. Lee. A unified approach to interpreting model predictions. Advances in Neural Information Processing Systems. Vol. 30, pg. 4765–4774, 2017. [↩]
- The Cancer Genome Atlas Research Network. Comprehensive, Integrative Genomic Analysis of Diffuse Lower-Grade Gliomas. N Engl J Med. 2015;372:2481–2498. [↩]